Pierre said:
Aya said:
On the forum of the website, people are posting their random observations on meteorites and fireballs, but I don't see any overall statistics of it.
Here is a different website that I found.
On the English title it says "Recent Meteorites and Meteoritic Fireballs in Nippon (after 1985)"
but in the Japanese title it says: "The recent fireballs that hit and are sure to be hit in Japan. (after1985)"
http://www5e.biglobe.ne.jp/~shibaya/meteorites/meteoritesE.html
Currently, I am not finding any better websites that has the statistics of fireballs observed in Japan. I think I need to do a lot of digging, maybe some experts have taken statistics but with a quick browsing, I cannot find anything.
Or we end up needing to make statistics on our own, if that's what you are intending to do, I can help you with that.
Are you also looking for observations on sprites?
I can count the sightings from SontataCo.JP and add if I can find more information from different websites, what do you think?
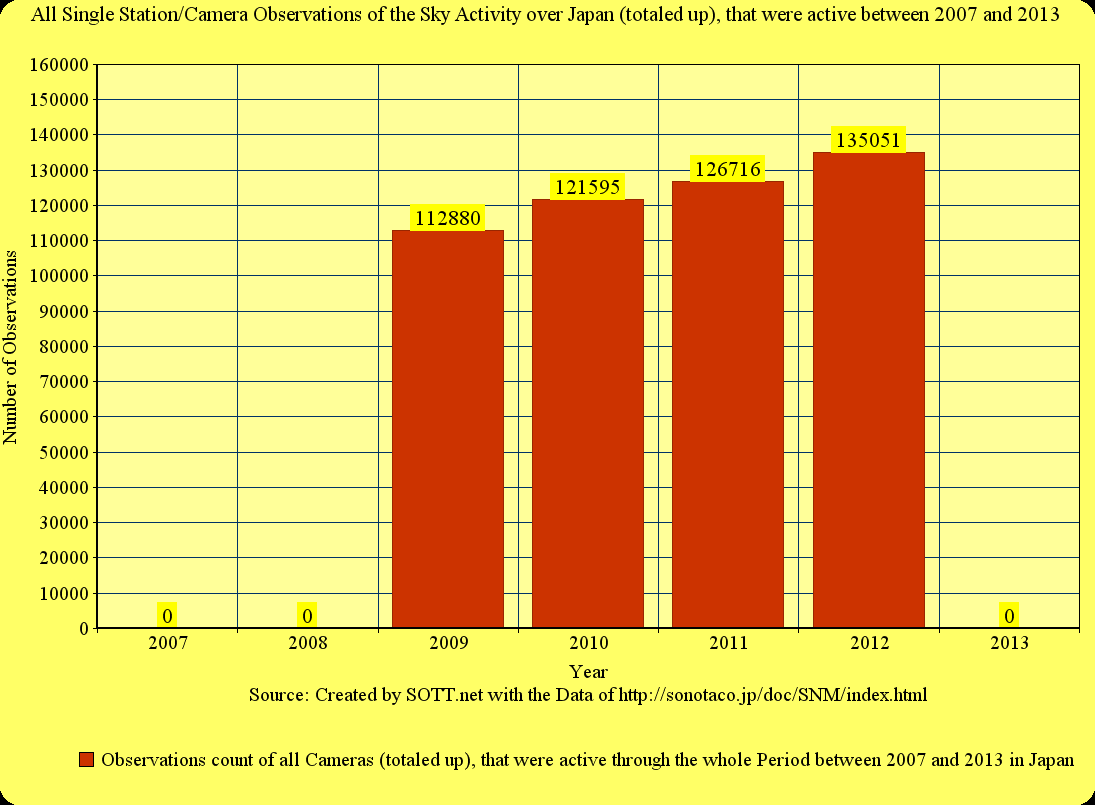
I compiled the data posted above into a table and chart (see below).
The linear regression indicates an average annual increase of 8%.
I want to include those graphs in the book I'm currently finalizing but first
I would like to know if the number of observation stations has changed over the period 2007-2012. So we can know if the increase in number of observations is due to increase in number of stations and/or increase in actual fireballs?
Also did the SonotaCo publih their figures for 2013?
I'm currently on it, to find out if the number of observation stations that were used in each year for the data above varies.
As of now I've compared the years 2007, 2008 and 2009 in that respect (The rest till 2012 I'll do the next coming days) and it looks like the numbers of observation stations that were used to come up with those numbers above
vary significantly through the time frame I've looked at so far.
So I don't think we can get a reliable statistical data set from the numbers that were posted above, to decide if there was really an increase or not...
I've looked through the data carefully now and I think there could be another way I could filter out statistical reliable data from 2009 onwards. I can't include 2007 and 2008 as of yet, since the data they shared for those two years does not specify what cameras were used so that I can compare it to the years of 2009 - 2012 which display this crucial data.
What I'm trying to do, is to finish the data set I mentioned above until the year of 2012:
Pashalis said:
I'm currently on it, to find out if the number of observation stations that were used in each year for the data above varies.
As of now I've compared the years 2007, 2008 and 2009 in that respect (The rest till 2012 I'll do the next coming days) and it looks like the numbers of observation stations that were used to come up with those numbers above vary significantly through the time frame I've looked at so far.
When I have finished that, I can see which observation stations were active throughout the whole period of 2007 - 2012. Then when I have those stations, I then can compare each station through those years and see what cameras were used throughout that time frame (unfortunately only from 2009 -2012, as of yet). I will then be able to add up all those reliable data for each year and the result will give us the following data:
"Number of all observed events added up from all camera station that are listed in the source list below, throughout 2009 -2012"
That should give us a real indicator.
But then another question emerges: Can those camera networks also detect fireballs that are behind clouds?.
Lets propose for example that 2009 was pretty cloudy throughout the year in Japan and 2010 was pretty cloudless compared to that year respectively on those camera stations. Would that effect the reliability of the data, I will figure out soon? I guess that could be the case? So do we know if those cameras can also detect fireballs when it is cloudy? Can somebody figure that out?, If the cameras can not detect fireballs when it is cloudy, I think we will have to figure out how cloudy each year from 2007 until 2012 was in Japan on those camera stations. If there is not much difference throughout those years, or if the cameras can detect them through the clouds
we might finally have a real indicator of what is going on in the skies, respectively in those areas that are covered by those cameras in Japan, throughout this time frame.
Pashalis said:
I can't include 2007 and 2008 as of yet, since the data they shared for those two years does not specify what cameras were used so that I can compare it to the years of 2009 - 2012 which display this crucial data.
Maybe once I'm finished with my data set, we could contact them and ask if (with the list at hand, that I will create) if the cameras that were used throughout 2009 -2012 were also active in 2007 and 2008? A response to that could also enable me to include 2007 and 2008 into the table, which would be nice...
I'm also wondering when the data of 2013 will be available? Maybe we can ask for that too? That would really be handy...