Computational modelling of the companion star and its interaction with Sol

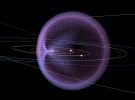
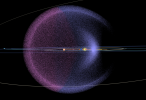
During the simulations time and again I made interesting observation that when something is thrown at the solar system (I mean some large pile of rocks here) the sun acts as a big gravitational lens. As the bodies approach the sun, they will be attracted and as a result a dense region is formed on the side of the sun that is opposite to the direction from which the rocks came.

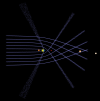
The situation is illustrated in Fig. 53. For better clarity I arranged the bodies into rays that are moving from left to right. You can see that even though the rays are initially parallel to each other the sun simply changes their direction and focuses them into some small region. Here in the picture only two-dimensionsal representation is shown, in three dimensions the effect is extended into the third dimension in a straightforward manner. If you imagine the rays arranged into a tube with the sun on the axis of the tube then all the objects would be redirected towards the axis. Because the gravitational potential is a scalar it means that it has no direction and therefore all objects are pulled into the very same region that is on the opposite side of the sun.

The shape of the region is complex because unlike optical lens (properly shaped) the gravitational lens does not send the rays into one single point. Nevertheless the simulation indicate that the density (of the rocks) in the region is increased.
 

Attachments

  • Fig53.png
    Fig53.png
    112.4 KB · Views: 156
To prove the point I made some refined simulations. I placed a very dense patch at about 70 AU heliocentric distance and let the companion star pass directly through the patch. This created quite dense primary wave which was directed toward the solar system. You can see visually the density in Fig. 54 from suitable angle with the companion star moving away in the background. The sideview is shown in Fig. 55 with the primary wave initially coming from the left. Clearly visible is increased denseness of the rocks on the opposite side of the Sun. The most concentrated region is at the plane of the ecliptic.

Because the rocks were thrown in all directions the primary wave covers the whole solar system. This got me thinking that the new moons of the outer planets that psychegram mentioned in post #82 might be a sign that we are already experiencing the primary wave.

This would explain a lot because if there is an increased density of the rocks, it would also mean more collisions and as a result there would be a lot of dust produced as a side effect. So effectively the dust would be produced inside the inner solar system.

So is it possible that this lensing effect is going on right now in the solar system?
 

Attachments

  • Fig54.png
    Fig54.png
    619.5 KB · Views: 136
  • Fig55.png
    Fig55.png
    647.2 KB · Views: 129
Well, the simulation results in the previous post were intriguing enough that it made me thinking whether the increased density in the inner region of the solar system (if it is present there) will be reflected in the number of observed fireballs. If this would be the case then the number of observed fireballs should vary seasonally.

So I made myself useful and extracted data from the AMS database. But this time I did extract monthly data, that is the number of observed fireballs each month for last 10 years. It took me a little while because I had to literally count the events for each month. But in the end I think it was worth it.

I organized the data in the form of histogram or bar chart with the months (and years) on the x-axis and the number of fireball events for each month on the y-axis (Fig. 56). Each year has twelve bars which correspond to twelve months of the year starting with january and ending with december.

So what is so interesting about this chart? Until now I have seen only yearly numbers and there only the exponential rise was observable. But in this chart here one can see how the number of fireball events changes with seasons. And because seasons are tied to the position of the Earth on her orbit, it is possible to determine the location of the high density region. And that such region is present is evident from the chart.

Year after year again and again there is the same peak occuring around november (except for 2009 where there the companion must have traversed a gap). This is better perceivable in Fig. 57 where I rearranged the data so that the same months of all the years are grouped together. So the bars above the first month are januaries for all the years and above the 12 are decembers and so on.

On average there is approximately 2 times more fireballs in winter months compared to summer months. Evident is also sharp increase in the number of events as the Earth enters the dense region followed by sharp decrease upon her exit from the region. During summer months the number of events is almost constant which is logical because from the direction of the companion the primary wave is almost equally dense. Remember that the denser region is on the opposite side of the sun and it is due to the lensing effect.

Another interesting thing is that if one looks at Fig. 56 and connects with a line only the summer months (totally ignoring the winter months) one will get smooth continuous line that (as it was shown during the simulations) is proportional to the density of the asteroid cloud through which the companion travels. So it is even possible to reverse engineer the density profile of the asteroid cloud outside of the solar system.

Clearly the first dense ring that was penetrated by the companion had its peak at 2014 and it is obvious that in 2015 the density declines.

Only a massive body that is very near can cause exponential rise in the fireball count. Fig. 17 can be inspected for comparison.

And the dense region which Earth traverses during winter months is a big clue as to where the massive body might be. But where exactly is Earth on her orbit during november/december?
 

Attachments

  • Fig56.png
    Fig56.png
    20.1 KB · Views: 103
  • Fig57.png
    Fig57.png
    18.8 KB · Views: 100
tohuwabohu,

I wonder if this latest report corresponds with the recent fires we are having in the US as reported on Intra Agency Fire Center ?

I can't help thinking that you are giving us critical updates on the Cosmic implications of what we might be able to expect in terms of Earth changes.

I wonder if many of these fires are not fireball related.
 
Hi tohuwabohu,

I much appreciate your effort to collect and interpret all this data - just want to thank you, as my lack of knowledge is this area prevents me to contribute.

Joy
 
Hello tohuwabohu, love your work - I wondered if you might compare your data against the known meteor streams , maybe you could correlate the maximum in your data to a particular stream. Not sure what it's worth, but here goes anyway:

Nature’s fireworks: the best meteor showers coming in 2015
_http://theconversation.com/natures-fireworks-the-best-meteor-showers-coming-in-2015-35906

or, for more details, from JPL: Meteor Streams
_http://ssd.jpl.nasa.gov/?meteor_streams

You never know, it might tell us which comet is likely to be perturbed.
Hope this helps.
 
goyacobol said:
tohuwabohu,

I wonder if this latest report corresponds with the recent fires we are having in the US as reported on Intra Agency Fire Center ?

I can't help thinking that you are giving us critical updates on the Cosmic implications of what we might be able to expect in terms of Earth changes.

I wonder if many of these fires are not fireball related.

That is a good question goyacobol. Theoretically if the wildfires would be caused solely by the fireballs then we should observe the same seasonality variations. That is, the most wildfires would have to occur during winter. I checked the SOTT WorldView for wildfires (by the way it's a great tool) and the result is attached.

What can be seen is that most of the wildfires occur during summer months and rarely also during winter.
Well of course it is probable that to compare this chart to the number of fireballs we should bias the results because it is much easier to start wildfire during summer when everything is dry and hot than during winter when everything is frozen and covered in snow.

I have searched the transcripts for changes in gravity because Perceval mentioned it in another thread and instead I found this:

Session 22 March 2014

Q: (Perceval) I don't think we've asked this question before even though it's been going on for a long time. What causes the large-scale wildfires in places and at times, for example in the winter, when...

A: Gas emissions combined with active plasmas.

Q: (L) So it doesn't have to be from overhead explosions. (Perceval) Well, we were thinking it must have been gas. (Andromeda) And electrical activity. (Pierre) It's both. Active plasma due to cometary activity, and the earth opening up. (L) Yeah, how about that gas explosion in New York recently?

A: A prime example: We warned about such things and more to come. The planet on which you dwell is opening up!!!

So I would say that there is only some (unknown) contribution from the fireballs and the rest is gas and plasma.
 

Attachments

  • wildfires.png
    wildfires.png
    46.8 KB · Views: 13
tohuwabohu said:
goyacobol said:
tohuwabohu,

I wonder if this latest report corresponds with the recent fires we are having in the US as reported on Intra Agency Fire Center ?

I can't help thinking that you are giving us critical updates on the Cosmic implications of what we might be able to expect in terms of Earth changes.

I wonder if many of these fires are not fireball related.

That is a good question goyacobol. Theoretically if the wildfires would be caused solely by the fireballs then we should observe the same seasonality variations. That is, the most wildfires would have to occur during winter. I checked the SOTT WorldView for wildfires (by the way it's a great tool) and the result is attached.

What can be seen is that most of the wildfires occur during summer months and rarely also during winter.
Well of course it is probable that to compare this chart to the number of fireballs we should bias the results because it is much easier to start wildfire during summer when everything is dry and hot than during winter when everything is frozen and covered in snow.

I have searched the transcripts for changes in gravity because Perceval mentioned it in another thread and instead I found this:

Session 22 March 2014

Q: (Perceval) I don't think we've asked this question before even though it's been going on for a long time. What causes the large-scale wildfires in places and at times, for example in the winter, when...

A: Gas emissions combined with active plasmas.

Q: (L) So it doesn't have to be from overhead explosions. (Perceval) Well, we were thinking it must have been gas. (Andromeda) And electrical activity. (Pierre) It's both. Active plasma due to cometary activity, and the earth opening up. (L) Yeah, how about that gas explosion in New York recently?

A: A prime example: We warned about such things and more to come. The planet on which you dwell is opening up!!!

So I would say that there is only some (unknown) contribution from the fireballs and the rest is gas and plasma.

I am wondering if the fireballs in some cases might be the match to ignite the gas being released. From the chart I noticed some fires in February 2014 but most as you mention seem to be in the spring and summer months. I guess there is more than one cause such as the gas and active plasmas from cometary activity. Thanks for the chart and the quote.
 
Shared Joy said:
Hi tohuwabohu,

I much appreciate your effort to collect and interpret all this data - just want to thank you, as my lack of knowledge is this area prevents me to contribute.

Joy

Hi Joy, I am always glad when someone comes by and says hello. And even though you think you can't contribute, you just did. You can contribute in many ways.
 
goyacobol said:
tohuwabohu said:
goyacobol said:
tohuwabohu,

I wonder if this latest report corresponds with the recent fires we are having in the US as reported on Intra Agency Fire Center ?

I can't help thinking that you are giving us critical updates on the Cosmic implications of what we might be able to expect in terms of Earth changes.

I wonder if many of these fires are not fireball related.

That is a good question goyacobol. Theoretically if the wildfires would be caused solely by the fireballs then we should observe the same seasonality variations. That is, the most wildfires would have to occur during winter. I checked the SOTT WorldView for wildfires (by the way it's a great tool) and the result is attached.

What can be seen is that most of the wildfires occur during summer months and rarely also during winter.
Well of course it is probable that to compare this chart to the number of fireballs we should bias the results because it is much easier to start wildfire during summer when everything is dry and hot than during winter when everything is frozen and covered in snow.

I have searched the transcripts for changes in gravity because Perceval mentioned it in another thread and instead I found this:

Session 22 March 2014

Q: (Perceval) I don't think we've asked this question before even though it's been going on for a long time. What causes the large-scale wildfires in places and at times, for example in the winter, when...

A: Gas emissions combined with active plasmas.

Q: (L) So it doesn't have to be from overhead explosions. (Perceval) Well, we were thinking it must have been gas. (Andromeda) And electrical activity. (Pierre) It's both. Active plasma due to cometary activity, and the earth opening up. (L) Yeah, how about that gas explosion in New York recently?

A: A prime example: We warned about such things and more to come. The planet on which you dwell is opening up!!!

So I would say that there is only some (unknown) contribution from the fireballs and the rest is gas and plasma.

I am wondering if the fireballs in some cases might be the match to ignite the gas being released. From the chart I noticed some fires in February 2014 but most as you mention seem to be in the spring and summer months. I guess there is more than one cause such as the gas and active plasmas from cometary activity. Thanks for the chart and the quote.

I am sure it is possible. I think that even the plasma or fireball alone can cause some serious damage. I mean plasma torches are commonly used to cut even through very thick metal plates. And when gas is present it surely helps with the damage.
 
MusicMan said:
Hello tohuwabohu, love your work - I wondered if you might compare your data against the known meteor streams , maybe you could correlate the maximum in your data to a particular stream. Not sure what it's worth, but here goes anyway:

Nature’s fireworks: the best meteor showers coming in 2015
_http://theconversation.com/natures-fireworks-the-best-meteor-showers-coming-in-2015-35906

or, for more details, from JPL: Meteor Streams
_http://ssd.jpl.nasa.gov/?meteor_streams

You never know, it might tell us which comet is likely to be perturbed.
Hope this helps.

Hello MusicMan to tell you the truth I was wondering about the same thing. First I was thinking that the seasonal variation in the number of observed fireballs can be explained by meteor showers. But the meteor showers are just that - meteor showers. They are already known for tens or hundreds of years and when I was looking at one such event I saw just small streaks across the sky and that was it. So no fireballs.

That is why the AMS database is very good for this project because people know what is ordinary and what is not. If I would see a streak across the sky would I report it? Surely not. Why? Because I saw many of them so I know it is not worth it.
But what if I would observe a fireball? I mean a large fuming bright like a furnace fireball. I would be like "OMG that is so beautiful, I never saw anything like that, I have to tell someone." So the database is already filtered from noise to a great extent.

It is also known that the meteor showers are quite stable and there are no large fluctuations and surely not exponential increase in the number of observed meteors. The recent increase in the fireball events is on the other hand something quite new.

The Taurids for example were of interest for me because they are active during november where according to the chart I presented in Fig. 56 should be a peak in the fireball events. This stream is linked with the comet 2P/Encke. This comet has the proper perihelion argument but the aphelion is only approx. 4 AU. So the comet cannot interact with anything outside the solar system. But of course it could be perturbed by some large rocks that were thrown at the solar system. It traverses the dense region together with Earth.

But even if that would happen it could be explained in many ways. The nasa would be like "there was debris from our spacecraft so nothing to see here move along" or something like that. And if there would be a comet that would interact with the companion star it would take her some 250 years to get back. And that is too late. So I guess we can only "feel" or guess from various manifestations what is going on.

But nice thinking there MusicMan.
 
tohuwabohu said:
goyacobol said:
tohuwabohu said:
goyacobol said:
tohuwabohu,

I wonder if this latest report corresponds with the recent fires we are having in the US as reported on Intra Agency Fire Center ?

I can't help thinking that you are giving us critical updates on the Cosmic implications of what we might be able to expect in terms of Earth changes.

I wonder if many of these fires are not fireball related.

That is a good question goyacobol. Theoretically if the wildfires would be caused solely by the fireballs then we should observe the same seasonality variations. That is, the most wildfires would have to occur during winter. I checked the SOTT WorldView for wildfires (by the way it's a great tool) and the result is attached.

What can be seen is that most of the wildfires occur during summer months and rarely also during winter.
Well of course it is probable that to compare this chart to the number of fireballs we should bias the results because it is much easier to start wildfire during summer when everything is dry and hot than during winter when everything is frozen and covered in snow.

I have searched the transcripts for changes in gravity because Perceval mentioned it in another thread and instead I found this:

Session 22 March 2014

Q: (Perceval) I don't think we've asked this question before even though it's been going on for a long time. What causes the large-scale wildfires in places and at times, for example in the winter, when...

A: Gas emissions combined with active plasmas.

Q: (L) So it doesn't have to be from overhead explosions. (Perceval) Well, we were thinking it must have been gas. (Andromeda) And electrical activity. (Pierre) It's both. Active plasma due to cometary activity, and the earth opening up. (L) Yeah, how about that gas explosion in New York recently?

A: A prime example: We warned about such things and more to come. The planet on which you dwell is opening up!!!

So I would say that there is only some (unknown) contribution from the fireballs and the rest is gas and plasma.

I am wondering if the fireballs in some cases might be the match to ignite the gas being released. From the chart I noticed some fires in February 2014 but most as you mention seem to be in the spring and summer months. I guess there is more than one cause such as the gas and active plasmas from cometary activity. Thanks for the chart and the quote.

I am sure it is possible. I think that even the plasma or fireball alone can cause some serious damage. I mean plasma torches are commonly used to cut even through very thick metal plates. And when gas is present it surely helps with the damage.

Well it took me a little while but finally I get it what the C's meant (me thinks). I mentioned plasma torch and in plasma torch there is always working gas which is then ionized by electric arc. So Perceval and Andromeda were right and I think what C's meant is:
Gas + Active plasma (electricity) = Plasma torch

I can't believe it but it finally clicked. :D
 
The last question was what is the position of Earth on her orbit in relation to calendar months. So I was looking at the simulation and gathered more data. The problem is that many online images of solar system together with planets are shown from various angles or viewpoints and therefore one gets easily confused.
And I am not talking about images of skymap where the observer is somewhere on earth and looks at the sky, because that is defined in fairly unique way.

Rather I am interested in view of the solar system and also some space in its vicinity with Sun as the origin.
I have a feeling sometimes that NASA is deliberately using the most bizarre angles so as to confuse people. And if Pluto is not present (with its eccentric orbit) it is hard to navigate. It's similar to a problem one is facing when floating in space. Where is up and where is down? So it boils down to the necessity of having some reference.

So I have chosen a view from the north ecliptic pole. When viewing the solar system from this point the sun is the origin and we are watching the solar system in a top to bottom manner. The planets are orbiting the sun in counterclockwise direction. The axes of the reference system are fixed and do not rotate with the sun.

I then played little bit in a paint program and added the calendar months so we can see where the Earth is on her orbit. The positions of the three innermost planets as of yesterday are shown in Fig. 58. The Earth is colored blue and one can see that because it was 7th august yesterday it is at the beginning of the sector that represents august.

The coordinate axes are chosen in a straightforward way. When Earth is exactly to the right of the Sun we have fall equinox, when she is exactly above the Sun we have winter solstice etc. So the positive x-axis is defined by the fall equinox and the positive y-axis is defined by the winter solstice. Naturally on the opposite sides we have spring equinox and summer solstice.

So now we know where the Earth is on her orbit when we reference time of year.
 

Attachments

  • Fig58.png
    Fig58.png
    103.3 KB · Views: 19
tohuwabohu said:
The last question was what is the position of Earth on her orbit in relation to calendar months. So I was looking at the simulation and gathered more data. The problem is that many online images of solar system together with planets are shown from various angles or viewpoints and therefore one gets easily confused.
And I am not talking about images of skymap where the observer is somewhere on earth and looks at the sky, because that is defined in fairly unique way.

Rather I am interested in view of the solar system and also some space in its vicinity with Sun as the origin.

[...]

So now we know where the Earth is on her orbit when we reference time of year.

For getting the feeling of planetary relations/positions in our Solar system it might be good to take a look at orreries. There are many decent ones online for free, for example http://www.solarsystemscope.com/ and/or https://in-the-sky.org/solarsystem.php .
What's interesting to note is that in Novembers for recent years, Saturn was aprox. right on the other side of the Sun relative to Earth, which according to "lensing" phenomenon described above could have had an additional effect. Also, in 2011 since when steep increase was observed in winter fireball rates, Jupiter was just behind the Earth on "this" side of the Sun.

Although, for "seeing" what's behind the fireball stream, i.e. what's the direction where majority of them come from (and possible indication where the companion has been located), maybe it's better to include in the picture some more local spatial neighbourhood of the Solar system like some nearby stars and/or constellations, depending on distance between the Sun and it's companion.
 
Saša said:
Although, for "seeing" what's behind the fireball stream, i.e. what's the direction where majority of them come from (and possible indication where the companion has been located), maybe it's better to include in the picture some more local spatial neighbourhood of the Solar system like some nearby stars and/or constellations, depending on distance between the Sun and it's companion.

I was wondering, based on the lens effect as described by tohuwabohu, which would be the region of space in which the twin sun would most likely be. If we get more fireballs around November, that means that the twin star would be roughly behind our sun during that month. The sun would be either in Scorpio or Sagitarius, as per sky divisions by tropical astrologers, and so would the twin.

Astrology divides the constellations in twelve equal parts, but astronomically constellations do not necessarily correspond with this division. But it would be safe to say that it is the same region of those constellations, which is also not far from Libra. In fact, according to Wikipedia, our sun is in Libra between the 31st of October to the 22nd of November, and in sidereal astrology (based on the actual positions of stars which has changed due to the precession of the equinoxes), it is between October 15 and November 15th. This is intriguing in view of the very early comment by the Cs that prophecies discussed would happen "when the sun is in Libra".

I also once came across a youtube channel that claims that the twin star is in Libra. Most of what the guy said seemed off the mark to me. For example, I think he was assuming that the twin would come into the inner solar system in the near future. But I wondered why he had reached the conclusion that it was in Libra. So I looked and unfortunately I couldn't find his explanation of that (he has way too many videos). If anyone is interested, the channel is here:

_https://www.youtube.com/channel/UCNrZdBjWjfssfMx5dETze_g

I would also like to know, tohuwabohu, if by looking at when the increase in fireballs during the November period began, and estimating the amount of time that objects would take to get to the inner solar system from the Oort cloud, if it would be possible to determine how long ago they were disturbed by the twin star, and depending on that, to adjust its likely current position.

Thanks for sharing your work. I find it quite interesting!
 
Back
Top Bottom