The Ice Age Cometh! Forget Global Warming!

Pierre said:
thorbiorn said:
In the last post, I left out some folks, here we go, this own shows the Northern hemisphere, but it does not cover all the seas, or is is just that tilt of the Earth shifted?
http://ice.tsu.ru/files/paul/WorldLGMr.jpg

Earth shift is a definite possibility. Do you know to what period (which ice age) this ice cover model refers to?

Here is an article in English with this image: _http://www.qpg.geog.cam.ac.uk/lgmextent.html

This map for the northern hemisphere Last Glacial Maximum (Weichselian, Valdaian, Würmian, Devensian, Wisconsinan, MIS 2) was compiled by Jürgen Ehlers for 2005 from data and maps assembled and published in the books Quaternary glaciations - Extent and Chronology by Jürgen Ehlers & Philip Gibbard (Elsevier, 2004). A second map compiled plotted onto a Google Earth north polar view is now available below in static form but it is planned to make these maps interactive with Google Earth shortly.

thorbiorn said:
This map shows how the ice moved over Northern Eurasia http://doklad-referat.ru/public/page_images/729/77.jpg The extend of the ice is somewhat larger than previously shown, perhaps it refers to a different ice age. Irrespective of the extend of the ice sheet, the tendency will be to move from the areas of higher altitude towards areas of less altitude. Since mountains get snow first and are colder in summer, this is were the ice will pile up. What is great about this map is that one can see where modern day towns are, so if one is in Volgograd, Samara, Yekatarinburg, Omsk, Novosibirsk, or Chelyabinsk there will be no skiing in summer :)

Here is original article (in Russian).

It mentions Quaternary period as well.

And here is more digital high resolution maps: _http://booksite.elsevier.com/9780444534477/digital_maps.php
 
thorbiorn said:
This map shows how the ice moved over Northern Eurasia http://doklad-referat.ru/public/page_images/729/77.jpg The extend of the ice is somewhat larger than previously shown, perhaps it refers to a different ice age. Irrespective of the extend of the ice sheet, the tendency will be to move from the areas of higher altitude towards areas of less altitude. Since mountains get snow first and are colder in summer, this is were the ice will pile up. What is great about this map is that one can see where modern day towns are, so if one is in Volgograd, Samara, Yekatarinburg, Omsk, Novosibirsk, or Chelyabinsk there will be no skiing in summer :)

Thanks for sharing, Thorbiorn.

Here's also another map:

SGEdxZ9.jpg


showing the maximum extent of glaciers in the Early Pleistocene (blue line) and the Middle Pleistocene (red line).
 
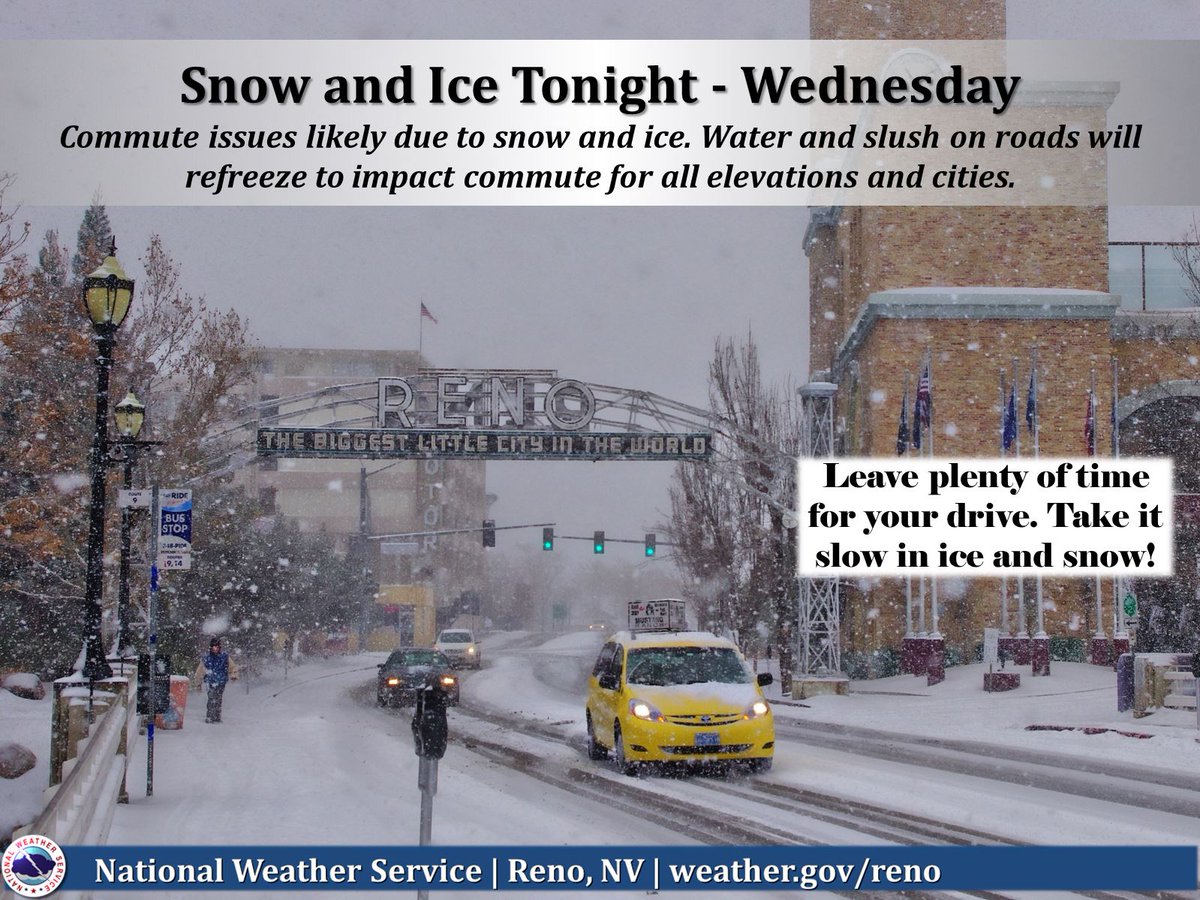
Reno, Nv.
Dan Collins‏@collinds06 Feb 20
https://twitter.com/collinds06/media
C5Kg_SiUMAA55Fz.jpg

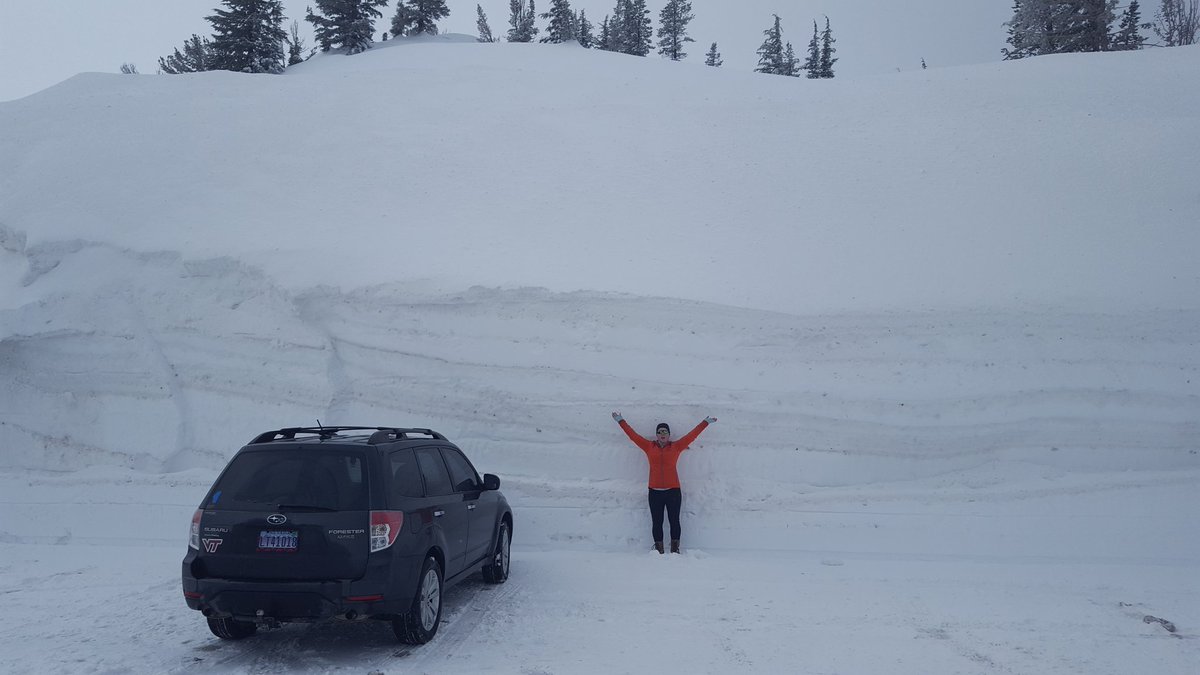
@NWSReno @JimCantore @ReedTimmerAccu @findOpenSnow @breakingweather Top of Mt. Rose Highway 2.19.2017. Crazy amounts of snow with more today

1-22-17 2-hrs ago
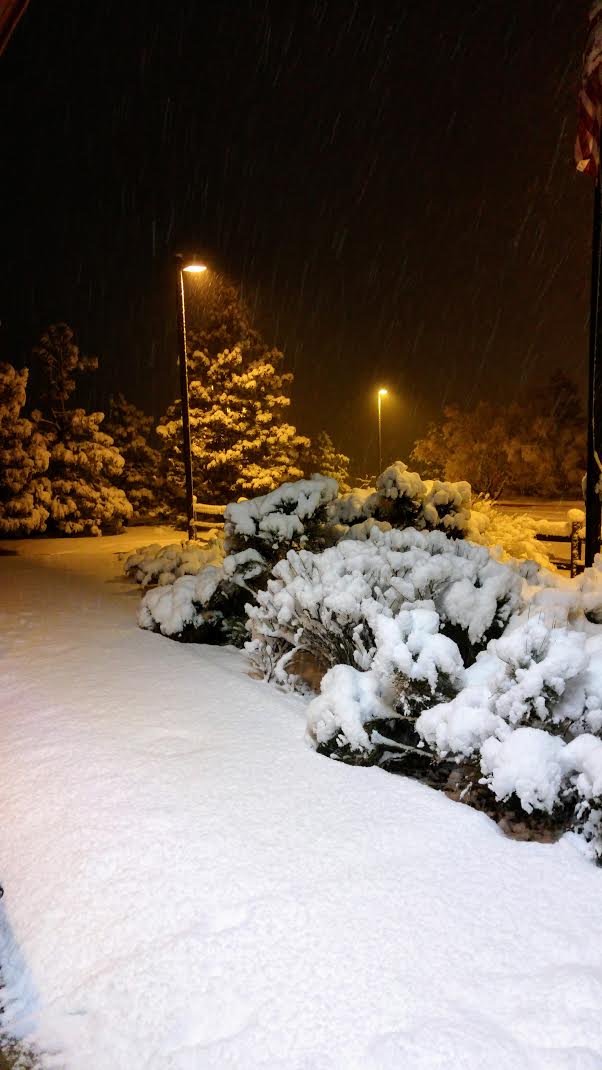
Snow continues to fall with road conditions worsening as temps fall. Remember to allow extra time for the commute in the morning! Be safe!
C5P3ELNVMAEcWa_.jpg

https://twitter.com/NWSReno/status/834282186887032832
Comments:
MarketingGoddes‏@MarketingGoddes 2h2 hours ago
@NWSReno wow. SNOWmaggeden. Just like Idaho this year, Keep it there pretty please. #nomoresnow.
C5Nsb9HVcAAyLla.jpg

C5MmU_VUkAMi_ff.jpg


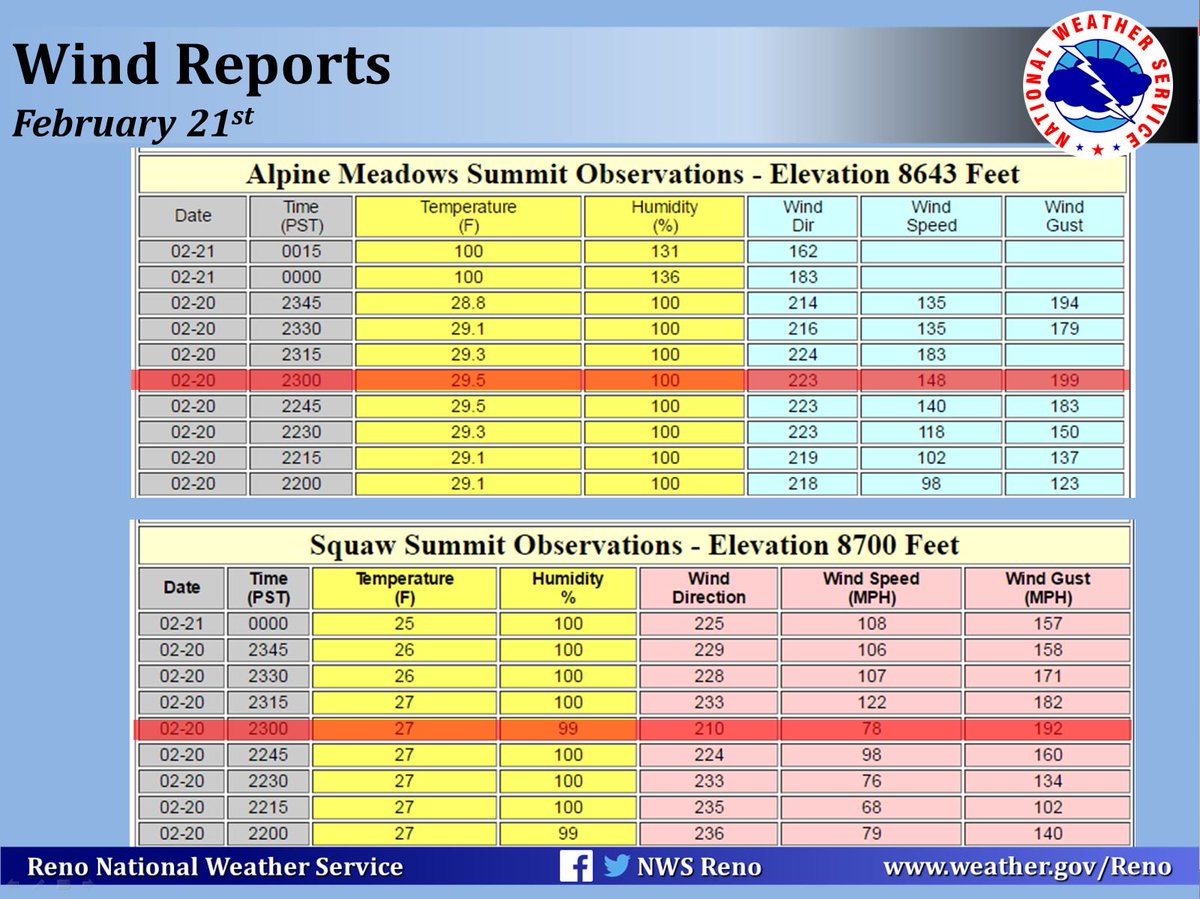
Category F-1 and F-2 winds Feb. 21, 17
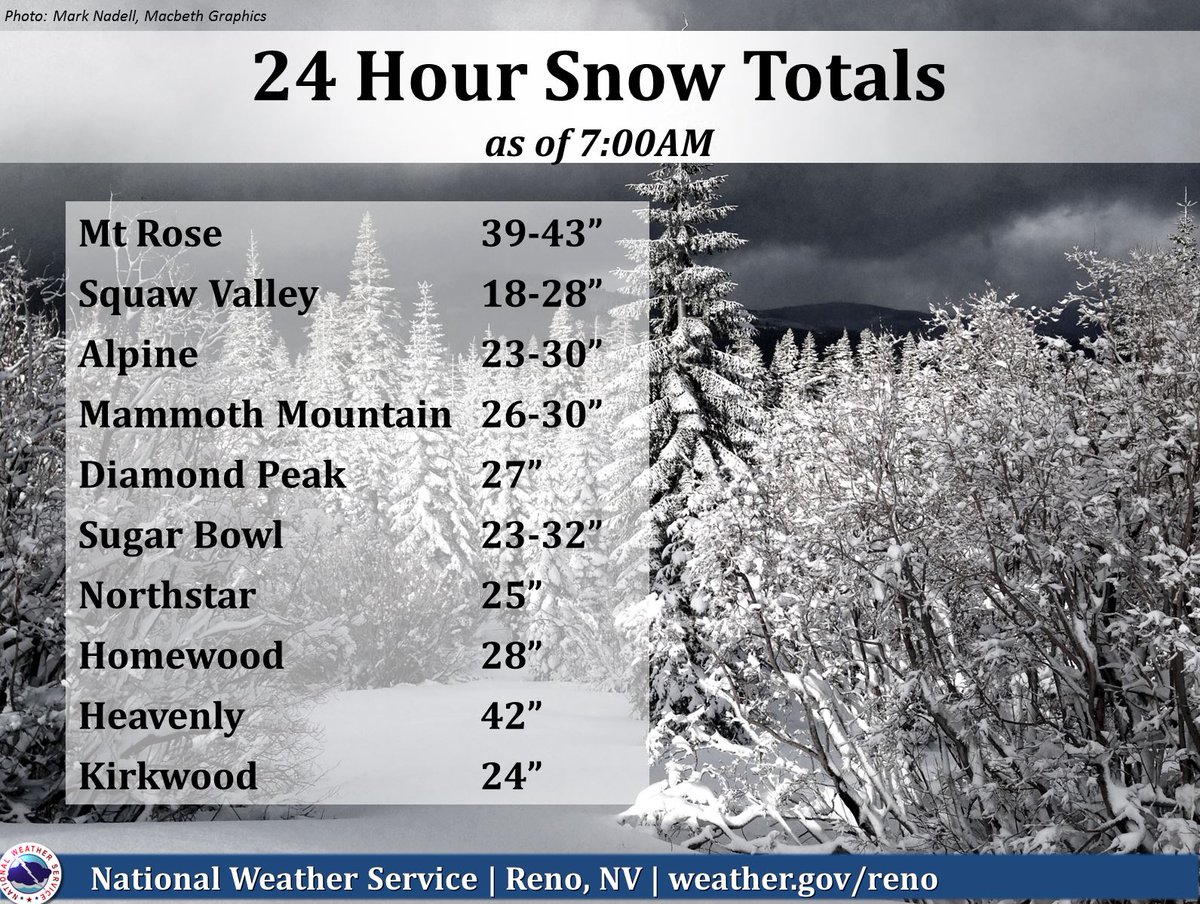
Holy wind! Observations from the top of Squaw Summit. Yes...those gusts to 177 mph are for real!
C5MMVBDUcAAWyEH.jpg
 
Severe weather conditions in Spain and Italy, including snowfall and flooding, have resulted in vegetable shortages in countries that rely on importing from these locations at this time of the year. The UK has been one of them and I certainly have been struggling to buy my veggies over the last couple of weeks. This prompted me to check what was going on and I found a couple of articles that talk about this. Some of them are 'entertainment media sources' (aka tabloids) but I can confirm that what they are describing is in fact visible on supermarket shelves. Apparently these problems are expected to last until April - June 2017.

http://www.bbc.co.uk/news/uk-38666752
Anyone trying to stock their kitchen full of vegetables may have noticed a shortage of their favourite greens or salad items.
It started last month with some supermarkets having problems stocking courgettes and spinach, while iceberg lettuce is now being rationed by some chains.

Retailers have blamed empty shelves on bad weather in Spain and Italy.

Why are we facing a shortage?
A combination of flooding, cold weather and poor light levels in southern Europe is said to have created the "perfect storm" of poor growing conditions.
During the winter months, Spain's south-eastern Murcia region supplies 80% of Europe's fresh produce. But after suffering its heaviest rainfall in 30 years, only 30% of Murcia's growing fields are useable.

This has coincided with a cold snap in Italy, which normally exports vegetables at this time of the year but is now having to import them.
The effects of shortages are particularly pronounced in Britain, which imports an estimated 50% of its vegetables and 90% of its fruit.
The Grocer magazine's fresh and chilled foods editor, Kevin White, told the BBC he could not recall the weather affecting supplies so severely. (...)

https://www.thesun.co.uk/news/2773682/vegetable-rationing-lettuce-broccoli-courgettes-supermarkets-uk/
VEGETABLES are being rationed in supermarkets across the UK after storms and snow in Spain decimated crops, causing a supply shortage.

Signs warning customers they can only buy limited numbers of certain items have sprung up in stores, while online shoppers are unable to order basic vegetables such as lettuces as they are out of stock. And there are fears the severe shortage could lead to a European trade war – with industry experts warning the UK could end up with nothing if France and Germany are prepared to pay more for their veg.

The drought began with aubergines and courgettes, but customers can expect shortages of iceberg lettuce, baby spinach, mixed leaves, rocket, lollo rossa, cauliflower, broccoli, peppers, cucumbers, tomatoes, lemons, and oranges, reports the Daily Mail.

Morrisons has imposed a limit of three heads of broccoli and three iceberg lettuces per customer throughout its 492 stores. And some Tesco stores are also displaying signs capping lettuces at three per person.

Earlier this month, The Sun Online was the first publication to report about shortages of courgettes due to the bad weather in Spain. Storms and snow in parts of Spain, including the southern eastern area of Murcia, are to blame for supply problems with crops. The region produces 80 per cent of vegetables sold in the UK during winter.

Italy has also been affected by a cold snap, meaning the region is having to import more produce that it would expect at this time of year. Industry experts told this newspaper that supply shortages of courgettes could continue until June at least.

While the availability of tomatoes, peppers, broccoli and lettuce may be tight until at least May.

(...)

Industry experts warned Britain could end up fighting with its European rivals to snap up the limited supply of veg from the Mediterranean.

British Leafy Salads Association (BLSA) spokesman Dieter Lloyd said: “If the German or French markets are prepared to pay more for the product, we could end up with nothing.

“These difficult trading conditions are set to continue into February and March.” He said contingency supplies were expected to be flown in from the US but this was an “expensive solution”.

(...)

Flooding, plummeting temperatures and poor light are said to have created a “perfect storm” which is to blame for the poor crop.

Spain’s south-eastern Murcia region – estimated to supply 80 per cent of the continent’s fresh produce in winter – has experienced the heaviest rainfall seen in 30 years. Italy, which normally exports vegetables at this time of year, is being forced to import after unusually cold temperatures took their toll on crops. And the Spanish regions of Andalucia and Valencia have also seen a dramatic dip in production.

Philippe Binard, of produce industry forum Freshfel Europe, told the BBC the problems crippling agriculture were unprecedented. Production levels of some crops had dropped by as much as 25 per cent, with prices rising by between 25 and 40 per cent, he said.
 
Altair said:
Pierre said:
thorbiorn said:
In the last post, I left out some folks, here we go, this own shows the Northern hemisphere, but it does not cover all the seas, or is is just that tilt of the Earth shifted?
http://ice.tsu.ru/files/paul/WorldLGMr.jpg

Earth shift is a definite possibility. Do you know to what period (which ice age) this ice cover model refers to?

Here is an article in English with this image: _http://www.qpg.geog.cam.ac.uk/lgmextent.html

This map for the northern hemisphere Last Glacial Maximum (Weichselian, Valdaian, Würmian, Devensian, Wisconsinan, MIS 2) was compiled by Jürgen Ehlers for 2005 from data and maps assembled and published in the books Quaternary glaciations - Extent and Chronology by Jürgen Ehlers & Philip Gibbard (Elsevier, 2004). A second map compiled plotted onto a Google Earth north polar view is now available below in static form but it is planned to make these maps interactive with Google Earth shortly.

Thanks for finding the answer.

The model suggests a North geographic pole located in Canada during the last glacial maximum. At the end of this ice age (around 12500 BCE), a comet might have hit Hudson Bay, this comet following an almost tangential trajectory and travelling towards the South-East could have shifted the North pole to a position closer to its current one.

That might explain why during the younger dryas (c. 12500 BCE), most regions experienced a sudden cooling except Northern America (because it moved away from the pole). It would also explain the location and orientation of the Carolina Bays (South East of Hudson Bay).
 
thorbiorn said:
If anyone is interested this is the link to DMI with a graph of the estimated volume of ice sheet over Greenland (buttom graph) with the daily gain og loss (top graph) The latest is:
accumulatedsmb.png

For more detail check http://www.dmi.dk/en/groenland/maalinger/greenland-ice-sheet-surface-mass-budget/
The total amount of ice in the arctic appears to be on the low side:
osisaf_nh_iceextent_daily_5years_en.png

Perhaps it is because the temperatures have been above average.
http://ocean.dmi.dk/arctic/plots/meanTarchive/meanT_2017.png
With the good amounts of snow the Arctic Circle Race in Sisimiut in western Greenland should have a fair chance. If you like to know about this experience of an Ice Age, there are various Youtubes and stories from the Arctic Circle Race like https://www.youtube.com/watch?v=ZovZfple2ig or http://www.skiclub.co.uk/skiclub/news/story.aspx?storyID=9429#.WLLQMX_HVao
 
Pierre said:
Altair said:
Pierre said:
thorbiorn said:
In the last post, I left out some folks, here we go, this own shows the Northern hemisphere, but it does not cover all the seas, or is is just that tilt of the Earth shifted?
http://ice.tsu.ru/files/paul/WorldLGMr.jpg

Earth shift is a definite possibility. Do you know to what period (which ice age) this ice cover model refers to?

Here is an article in English with this image: _http://www.qpg.geog.cam.ac.uk/lgmextent.html

This map for the northern hemisphere Last Glacial Maximum (Weichselian, Valdaian, Würmian, Devensian, Wisconsinan, MIS 2) was compiled by Jürgen Ehlers for 2005 from data and maps assembled and published in the books Quaternary glaciations - Extent and Chronology by Jürgen Ehlers & Philip Gibbard (Elsevier, 2004). A second map compiled plotted onto a Google Earth north polar view is now available below in static form but it is planned to make these maps interactive with Google Earth shortly.

Thanks for finding the answer.

The model suggests a North geographic pole located in Canada during the last glacial maximum. At the end of this ice age (around 12500 BCE), a comet might have hit Hudson Bay, this comet following an almost tangential trajectory and travelling towards the South-East could have shifted the North pole to a position closer to its current one.

That might explain why during the younger dryas (c. 12500 BCE), most regions experienced a sudden cooling except Northern America (because it moved away from the pole). It would also explain the location and orientation of the Carolina Bays (South East of Hudson Bay).

Yes, interesting that that could have been the case, and it does account/align with the Carolina Bays.

Thanks for that link, thorbiorn. Noticed the discussion around their BALTEEM project - the Baltics and also the Baltic sea from the same link. Velikovski discussed the findings in geology of some of the lakes in the U.S's West, North West as having been tipped up and drained. The science then suggested the lakes were not more than 3100 - 3500 yrs old, with a detailed study of the salts in the sediments beds if remembered. The link referenced above (Quaternary Palaeoenvironments Group) includes "palaeooceanography, archaeology, geochronology, sedimentology, stratigraphy, palaeobotany, dendrochronology, micropalaeontology and palaeoecology" yet it is unfortunate (if it is the case) that there is no interaction with astrophysicist etc. in the group (the other side of the coin), yet their findings should be interesting nonetheless.
 
Side Note: 21.C' yesterday. This morning, light snow on the ground, and moderate amounts on the mountains. Near the Border of Spain, and France.

Adapt 2030
Blizzard Hawaii Peaks, Pakistan Avalanches Floods Unearth 7th Century Lunar Calendar Iran (323)

Published on Mar 2, 2017

https://youtu.be/74SUEEUkfRM
More than 10 inches of snow on the summits of the Big Island in Hawaii with blizzard warnings, Pakistan villages cut off by 46 avalanches and villagers are without food and medicine in the Hindukush area. Floods unearthed a 7th century lunar calendar cemetery in Iran and epic lightning storms over the Amazon.

Make Money Now Off Weather Predictions Here -
https://tradegenius.co/go/ref/23

Rid Your Body of Unwanted Toxins Now!
https://www.getthetea.com

Don't get caught un-prepared stock up on survival food today!
http://foodforliberty.com/adapt2030

Support ADAPT 2030 on PATREON http://www.patreon.com/adapt2030

ADAPT 2030 Mini Ice Age FB Page https://www.facebook.com/Miniiceage

David's Website http://www.oilseedcrops.org

You can also find this Mini Ice Age Conversations podcast on iTunes and Stitcher Radio

Isolated Arkari valley citizens urge govt for help 46 avalanches https://www.sott.net/article/343990-1...
http://dailytimes.com.pk/pakistan/27-...
Heavy Flood Uncovers Medieval Cemetery in Iran https://www.sott.net/article/344162-H...
https://sputniknews.com/environment/2...
http://en.el-balad.com/2325102
Pilot captures photos of apocalyptic-looking lightning storm looming over the Amazon
https://www.sott.net/article/344168-A...
https://www.sott.net/image/s19/381332...
https://www.sott.net/image/s19/381329...
http://www.dailymail.co.uk/travel/tra...
Blizzard Warning Hawaii and several inches of Snow http://kdvr.com/2017/03/02/hawaii-got...
https://www.iceagenow.info/blizzard-w...
https://www.yahoo.com/news/m/deac9db2...
http://www.hawaiinewsnow.com/story/34...
http://khnl.images.worldnow.com/image...
http://khnl.images.worldnow.com/image.
.

Looks cold up there. Brrrr. ;)
Grand Tourmalet Barèges - La Mongie Cam's
_http://www.n-py.com/en/grand-tourmalet/webcams
 
The National Weather Service issued a blizzard warning in Hawaii this week. While that may sound peculiar, it’s not all that extraordinary. It snows nearly every year on the Big Island’s tallest mountains, where the warning was issued.

Hawaii Had More Snow This Week Than Denver Or Chicago Has Had All Year
_http://www.huffingtonpost.com/entry/hawaii-snow-denver-chicago_us_58ba1e31e4b05cf0f400c753

But during that blizzard, which lasted late Tuesday to early Wednesday, the Big Island received more snow than Denver has received all year, according to Fox 31 Denver.

Indeed, this week’s blizzard left up to 8 inches of snow on Mauna Kea and Mauna Loa, which are both more than 13,000 feet high, USA Today reported. Denver, on the other hand, has had a total of only 7.9 inches of snow measured in 2017. However, the Mile High City has had 19.3 inches of snow for the winter season, according to CBS Denver.

The Big Island’s peaks even saw more snow than Chicago, which documented zero snow on the ground in January and February for the first time in 146 years, The Chicago Tribune reported.

Chicago’s measurements don’t include any snow that may have fallen and melted after 6 a.m., which is when the National Weather Service measures the snow. Some experts are chalking up Chicago’s lack of snow to climate change, according to the Tribune.

“This is occurring against a backdrop of a changing climate,” Tom Skilling, a Chicago meteorologist told the newspaper. “I think the door is open to additional unusual weather events as we go forward.”

And the Aloha State’s blizzard was particularly strong.

“The reason for the snow amounts being heavier than we usually see is that the upper low (pressure system) really persisted down there, that has allowed colder air to remain locked in place,” Andrew Orrison, a forecaster for the National Weather Service’s Weather Prediction Center, told Reuters on Thursday.

But don’t let the Big Island’s recent show of snow fool you: The islands are not taking over as the next premiere ski destination.

The Hawaii Snow Ski Club website states that Mauna Kea’s summit only “sometimes gets a skiable/boardable mantle of snow.”

“There are no lifts, no grooming, no resort,” the website says. “Conditions at the top are extremely variable.”

The club also warns that “snow conditions on Mauna Kea may not be the best in the world.”
 
Storm Leaves 600,000 French Households Without Power
http://www.zerohedge.com/sites/default/files/images/user5/imageroot/2017/03/06/1488794898_weathermap.jpg
According to French electricity grid operator Enedis, winter storm Zeus which unleashed hurricane-force winds across much of southern France, has left more than 600,000 French households without power as of 4pm on Monday. The company's website advises that the power cuts have affected 175,000 customers in Brittany, 190,000 in Auvergne Rhone Alpes, 130,000 in Nouvelle Aquitaine, 80,000 in Pays de Loire, and the company advises that more than 3,500 technicians from Enedis are working in the field to deal with “very major” storm damage.

Earlier in the day, The Local reported that weather warnings are in place for large swathes of France as wind speeds hit over 190km/hr on Monday. National weather agency Météo France updated the number of departments on orange alert to 31 on Monday morning, as fierce winds lashed much of the country. The town of Camaret, in Brittany, already saw record winds of 193km/hr during Monday morning, reported Europe 1 radio.

Map:
http://www.zerohedge.com/sites/default/files/images/user5/imageroot/2017/03/06/1488794898_weathermap_0.jpg

An orange alert is the second highest alert on the agency's scale, and urges residents to be vigilant.

Winds are expected to reach up to 150km/hr on Brittany's coastline and 120km/hr inland. Heavy rainfall has been predicted in some areas too. The agency said that residents could expect "significant damage" caused by the wind and disruptions to local traffic.

It warned that there was a possibility of cuts to electricity and telephone lines, and as noted above, this is precisely what has happened. The agency warned residents in affected areas to stay off the rooftops and to secure objects that are liable to be blown away.

Elswhere, the entire island of Corsica was issued an orange alert for flood risks as well as "particularly strong winds". Residents were told to avoid getting too close to the sea, or indeed anywhere that was already flooded. The warnings are in place until Tuesday at 10am.

Prévisions Météo-France du 7 au 13 mars 2017

https://youtu.be/Abi4GCPcafY

Study warns Venice could disappear in 100 years
Published on Mar 6, 2017
https://www.youtube.com/watch?v=Yh0zO8Gh4kE
A new study warns climate change is rapidly changing the landscape of Italy. Canal-laden Venice is one of the cities that is most at risk of disappearing if nothing is done to stop rising sea levels and coastal flooding

Meteo France Vendredi 10 mars
http://www.meteofrance.com/previsions-meteo-france/metropole
http://icecream.me/uploads/6e6270760c6a47d6b6ecbb394ca726a2.png

NASA | Aquarius Observations of Sea Surface Salinity
Published on Mar 6, 2017

https://youtu.be/yAsv6CtCL9I
This visualization shows changes in global sea surface salinity, as measured by NASA's Aquarius instrument aboard the Aquarius/SAC-D spacecraft, from December 2011 through December 2012. Red represents areas of high salinity, while blue represents areas of low salinity. Aquarius is a focused effort to measure sea surface salinity and will provide the global view of salinity variability needed for climate studies. The mission is a collaboration between NASA and the Space Agency of Argentina (Comisión Nacional de Actividades Espaciales).

Space Weather
http://spaceweather.com/
SOLAR EXPLOSION MISSES EARTH: A coronal mass ejection (CME) billowed away from the eastern limb of the sun during the late hours of March 5th. Because the explosion was so so far off the sun-Earth line, it is unlikely to affect our planet. Movie
http://spaceweather.com/images2017/06mar17/cme_anim.gif?PHPSESSID=56h08508mn79lv6t68g45eerh7

Daily Sun: 06 Mar 17 Image
http://spaceweather.com/images2017/06mar17/hmi1898.gif?PHPSESSID=56h08508mn79lv6t68g45eerh7
New sunspot AR2641 is tiny and poses no threat for strong solar flares. Credit: SDO/HMI

Near Earth Asteroids Chart 3-6-17
http://icecream.me/uploads/8987368bee98b716ec03ebd02b9df096.png
 
I think the winds here were only about 80 to 90 kmh and that only in gusts. But a strong wind was almost constant.
 
Laura said:
I think the winds here were only about 80 to 90 kmh and that only in gusts. But a strong wind was almost constant.

The maximum wind speeds were reached in Brittany (Finistere) with 193 km/h (120 mph). According to meteorologists, Zeus was the strongest storm since the series of two storms (Lothar and Martin) that struck Europe in 1999
 
Pierre said:
Laura said:
I think the winds here were only about 80 to 90 kmh and that only in gusts. But a strong wind was almost constant.

The maximum wind speeds were reached in Brittany (Finistere) with 193 km/h (120 mph). According to meteorologists, Zeus was the strongest storm since the series of two storms (Lothar and Martin) that struck Europe in 1999

I have know idea of what that might be like. So, i got-sta know.

120MPH

https://youtu.be/4WEoPJFTR24


The agency warned residents in affected areas to stay off the rooftops and to secure objects that are liable to be blown away

Who would want to be on there roof, under condition's like this?

Love the news, never anything relevant on the media in France.

The farmers here are very intelligent, and resourceful. And i will always watch, and take (and be ready to give), there subtle Q's (to the changes), with heart and soul.
 
Published on Feb 28, 2017
Jake Miille Photography
On February 25th, 2017, the rotary snow plows returned to Donner Pass to battle the heavy Sierra Snow along the UP Roseville Subdivision.
The rotaries are somewhat of a legend along the railroad. Only used every 10 years or so, the rotaries are rarely seen. Flangers and spreaders work tirelessly through the winter months to keep the tracks open. When they cannot keep up with Mother Nature, the railroad turns to the rotaries. "They were sometimes called War Wagons" said retired Southern Pacific superintendent Bill Lynch, "Going to war against Mother Nature."

It has been a difficult winter for the Union Pacific Roseville Division. Intense storms have dropped over 13 feet of snow in the mountains, making it difficult to move trains along the Donner Pass Route (Roseville to Sparks via Truckee). The Feather River Route, which can often alleviate rail traffic from Donner Pass, has been closed for weeks due to massive washouts near Portola.


https://youtu.be/RjBQ3MaBYiU
 
Regarding Greenland and the ice sheet, in a previous post there was this image
_http://www.dmi.dk/typo3temp/pics/04b37e48b0.png
04b37e48b0.png

On the one hand it show that more snow has fallen this year. Overall, they say the ice sheet is loosing mass:
_http://www.dmi.dk/typo3temp/pics/bb90202056.png
bb90202056.png

The loss of mass is not evenly distributed:
_http://www.dmi.dk/typo3temp/pics/a9c3f0e558.png
The map shows the average between 1990 and 2013. Blue is gaining Red is loosing.
a9c3f0e558.png


The reason for the large snowfall in Southern and Eastern Greenland has been a warm Winter. Warm air can carry more humidity, which then, because the temperature is still below 0C, falls as snow.
 
Back
Top Bottom