Which led me to recall, that the Moon and the Earth move around a barycenter, so would Kepler's law apply to this center, more than to the geographic center of the Earth? Leaving the question aside, here is what they write about the barycenter:According to Kepler’s 2nd law of planetary motion,
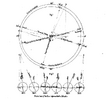
For an animation of how the Earth-Moon movement can be conceived with the barycenter of the system as the important location, there is this Tweet, otherwise the Wiki has an illustration:In astronomy, the barycenter (or barycentre; from Ancient Greek βαρύς (barús) 'heavy', and κέντρον (kéntron) 'center')[1] is the center of mass of two or more bodies that orbit one another and is the point about which the bodies orbit. A barycenter is a dynamical point, not a physical object. It is an important concept in fields such as astronomy and astrophysics. The distance from a body's center of mass to the barycenter can be calculated as a two-body problem.
If one of the two orbiting bodies is much more massive than the other and the bodies are relatively close to one another, the barycenter will typically be located within the more massive object. In this case, rather than the two bodies appearing to orbit a point between them, the less massive body will appear to orbit about the more massive body, while the more massive, body might be observed to wobble slightly. This is the case for the Earth–Moon system, whose barycenter is located on average 4,671 km (2,902 mi) from Earth's center, which is 75% of Earth's radius of 6,378 km (3,963 mi).
To add to the complexity, the rotation of the Earth is not around the center of the Sun, but around the barycenter of the solar system.
This NASA site writes:
Astronomers have decided to define a Barycentric Dynamical Time:Our entire solar system also has a barycenter. The sun, Earth, and all of the planets in the solar system orbit around this barycenter. It is the center of mass of every object in the solar system combined.
Our solar system’s barycenter constantly changes position. Its position depends on where the planets are in their orbits. The solar system's barycenter can range from being near the center of the sun to being outside the surface of the sun. As the sun orbits this moving barycenter, it wobbles around.
Barycentric Dynamical Time (TDB, from the French Temps Dynamique Barycentrique) is a relativistic coordinate time scale, intended for astronomical use as a time standard to take account of time dilation[1] when calculating orbits and astronomical ephemerides of planets, asteroids, comets and interplanetary spacecraft in the Solar System. TDB is now (since 2006) defined as a linear scaling of Barycentric Coordinate Time (TCB). A feature that distinguishes TDB from TCB is that TDB, when observed from the Earth's surface, has a difference from Terrestrial Time (TT) that is about as small as can be practically arranged with consistent definition: the differences are mainly periodic,[2] and overall will remain at less than 2 milliseconds for several millennia.[3]
The differences are small, but it may give an idea of how complicated it is to measure the length of a day,From the 17th century to the late 19th century, planetary ephemerides were calculated using time scales based on the Earth's rotation: usually the mean solar time of one of the principal observatories, such as Paris or Greenwich. After 1884, mean solar time at Greenwich became a standard, later named Universal Time (UT). But in the later 19th and early 20th centuries, with the increasing precision of astronomical measurements, it began to be suspected, and was eventually established, that the rotation of the Earth (i.e. the length of the day) showed irregularities on short time scales, and was slowing down on longer time scales. Ephemeris time was consequently developed as a standard that was free from the irregularities of Earth rotation, by defining the time "as the independent variable of the equations of celestial mechanics", and it was at first measured astronomically, relying on the existing gravitational theories of the motions of the Earth about the Sun and of the Moon about the Earth.
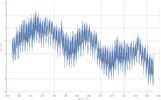
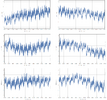
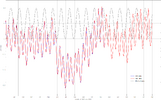
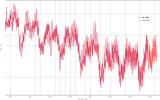
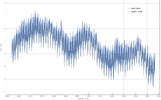
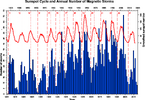
The diagrams in the last post were from TimeAndDate.com, and here are some more data:
On this page: How Long Is a Day on Earth?, they will tell us how much off the current day is.
While diagrams showing the variations are helpful for an overview, the numbers reveal the magnitude of the differences more clearly and show the date of the shortest and longest day for a period of about 50 years:Exact Day Length* — Fri, 2 Dec 2022
Today's prediction: 24 hours, 0 minutes, 0.0004430 seconds (0.4430 milliseconds)
Yesterday's prediction: 24 hours, 0 minutes, 0.0004407 seconds (0.4407 milliseconds)
At the start of today, UT1 was 0.0200320 seconds behind UTC.
�
| Average Solar Day Length* | |||||
|---|---|---|---|---|---|
| Year | Average day | Total yearly difference | Shortest day | Longest day | Leap second added |
| 2023 | -0.27 ms | -100.30 ms | 12 Aug -1.94 ms | 21 Mar +1.08 ms | - |
| 2022 | -0.25 ms | -90.16 ms | 29 Jun -1.59 ms | 5 Nov +1.01 ms | - |
| 2021 | -0.18 ms | -65.15 ms | 9 Jul -1.46 ms | 26 Apr +1.00 ms | - |
| 2020 | -0.00 ms | -1.30 ms | 19 Jul -1.47 ms | 8 Apr +1.62 ms | - |
| 2019 | +0.39 ms | +141.25 ms | 16 Jul -0.95 ms | 22 Mar +1.68 ms | - |
| 2018 | +0.69 ms | +252.47 ms | 30 Jun -0.64 ms | 4 Feb +1.69 ms | - |
| 2017 | +1.03 ms | +375.01 ms | 4 Aug +0.06 ms | 25 Apr +2.20 ms | - |
| 2016 | +1.34 ms | +490.76 ms | 18 Jul -0.03 ms | 10 Mar +2.49 ms | 31 Dec |
| 2015 | +1.25 ms | +458.03 ms | 17 Jun +0.19 ms | 26 Oct +2.31 ms | 30 Jun |
| 2014 | +0.99 ms | +362.96 ms | 24 Jul +0.02 ms | 26 Apr +2.02 ms | - |
| 2013 | +1.02 ms | +373.99 ms | 6 Jul -0.35 ms | 28 Mar +1.97 ms | - |
| 2012 | +0.83 ms | +304.11 ms | 16 Jul -0.35 ms | 5 Apr +1.87 ms | 30 Jun |
| 2011 | +0.76 ms | +277.94 ms | 27 Jul -0.34 ms | 14 May +1.85 ms | - |
| 2010 | +0.70 ms | +254.74 ms | 23 Jul -0.76 ms | 1 Mar +2.09 ms | - |
| 2009 | +0.80 ms | +293.37 ms | 6 Jul -0.43 ms | 22 Apr +1.81 ms | - |
| 2008 | +0.87 ms | +319.49 ms | 16 Jul -0.41 ms | 5 Apr +1.91 ms | 31 Dec |
| 2007 | +0.85 ms | +310.81 ms | 27 Jul -0.63 ms | 16 Apr +2.31 ms | - |
| 2006 | +0.82 ms | +300.88 ms | 12 Jun -0.40 ms | 7 Oct +2.26 ms | - |
| 2005 | +0.43 ms | +157.76 ms | 5 Jul -1.05 ms | 27 Feb +1.73 ms | 31 Dec |
| 2004 | +0.31 ms | +114.01 ms | 15 Jul -1.05 ms | 5 Apr +1.56 ms | - |
| 2003 | +0.27 ms | +100.16 ms | 13 Jul -0.96 ms | 19 Mar +1.55 ms | - |
| 2002 | +0.48 ms | +173.79 ms | 6 Aug -0.74 ms | 2 Mar +1.66 ms | - |
| 2001 | +0.57 ms | +208.94 ms | 2 Aug -0.71 ms | 11 Mar +1.64 ms | - |
| 2000 | +0.72 ms | +262.42 ms | 11 Aug -0.25 ms | 26 Oct +1.58 ms | - |
| 1999 | +0.99 ms | +361.19 ms | 30 Jun -0.13 ms | 15 Apr +1.93 ms | - |
| 1998 | +1.37 ms | +501.72 ms | 9 Jul +0.01 ms | 1 Mar +2.66 ms | 31 Dec |
| 1997 | +1.84 ms | +671.08 ms | 4 Jul +0.52 ms | 6 Apr +2.98 ms | 30 Jun |
| 1996 | +1.82 ms | +666.37 ms | 10 Aug +0.67 ms | 12 May +2.68 ms | - |
| 1995 | +2.31 ms | +843.66 ms | 25 Jul +0.81 ms | 17 Mar +3.29 ms | 31 Dec |
| 1994 | +2.19 ms | +800.86 ms | 6 Jul +0.86 ms | 27 Feb +3.36 ms | 30 Jun |
| 1993 | +2.36 ms | +862.66 ms | 17 Jul +1.25 ms | 2 May +3.49 ms | 30 Jun |
| 1992 | +2.22 ms | +812.25 ms | 12 Jul +0.84 ms | 18 Mar +3.59 ms | 30 Jun |
| 1991 | +2.04 ms | +743.88 ms | 27 Jun +0.79 ms | 1 Mar +3.00 ms | - |
| 1990 | +1.95 ms | +710.04 ms | 20 Jul +0.63 ms | 26 Mar +3.28 ms | 31 Dec |
| 1989 | +1.52 ms | +555.00 ms | 2 Jul +0.25 ms | 10 Nov +2.82 ms | 31 Dec |
| 1988 | +1.31 ms | +480.30 ms | 12 Jul -0.09 ms | 20 Feb +2.76 ms | - |
| 1987 | +1.36 ms | +497.35 ms | 23 Jul -0.06 ms | 1 Mar +2.67 ms | 31 Dec |
| 1986 | +1.24 ms | +451.06 ms | 2 Aug -0.04 ms | 23 Apr +2.30 ms | - |
| 1985 | +1.45 ms | +528.83 ms | 16 Jul +0.11 ms | 9 Mar +2.64 ms | 30 Jun |
| 1984 | +1.51 ms | +554.42 ms | 12 Jul +0.16 ms | 18 Mar +2.77 ms | - |
| 1983 | +2.28 ms | +832.08 ms | 23 Jul +1.01 ms | 1 Feb +3.57 ms | 30 Jun |
| 1982 | +2.16 ms | +789.64 ms | 2 Aug +0.84 ms | 23 Apr +3.14 ms | 30 Jun |
| 1981 | +2.15 ms | +786.03 ms | 16 Jul +0.82 ms | 8 Mar +3.42 ms | 30 Jun |
| 1980 | +2.30 ms | +842.04 ms | 8 Aug +1.34 ms | 23 Oct +3.24 ms | - |
| 1979 | +2.61 ms | +953.02 ms | 23 Jul +1.46 ms | 27 Mar +3.65 ms | 31 Dec |
| 1978 | +2.88 ms | +1051.83 ms | 31 Jul +1.49 ms | 9 Mar +3.83 ms | 31 Dec |
| 1977 | +2.77 ms | +1012.60 ms | 14 Jul +1.46 ms | 4 Apr +3.72 ms | 31 Dec |
| 1976 | +2.91 ms | +1064.67 ms | 26 Jun +1.87 ms | 21 Oct +3.90 ms | 31 Dec |
| 1975 | +2.69 ms | +980.87 ms | 20 Jul +1.54 ms | 1 Nov +3.72 ms | 31 Dec |
| 1974 | +2.72 ms | +991.99 ms | 30 Jul +1.57 ms | 5 Apr +3.79 ms | 31 Dec |
| 1973 | +3.04 ms | +1106.21 ms | 2 Jan +0.00 ms | 2 Apr +4.03 ms | 31 Dec |
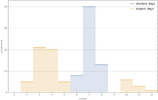
If one goes through the list, then the shortest day has varied between January 2 (1973) and August 12 (2023), though it is true that most have fallen in July. The longest day has fallen anywhere between February 1 (1983) and November 10 (1989).
The time between the shortest and the longest day varies. 1973 appears as a span of three months, and 1980 had less than three months, from the shortest day, August 8, to the longest day, October 23.
The variations in the length of day are difficult to explain. One will need a lot of mathematics and physics to explain the variations, more so since there are not only the shortest and the longest day. Within one year, there are variations with minor ups and downs. It is far from a straight line.

