The Ice Age Cometh! Forget Global Warming!

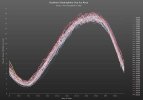
For the sake of completeness here is also the plot (in absolute units of 106 km2) for Southern Hemisphere (Antarctic) Sea Ice Coverage (see attachment) taken from http://arctic.atmos.uiuc.edu/cryosphere/antarctic.sea.ice.interactive.html, kind of interactive diagram refreshed on daily basis.

Last year (dark red line) the ice coverage exceeded for the most part of the year all shown measurements (from 1979), and we entered in 2015 (yellow line) with new record.


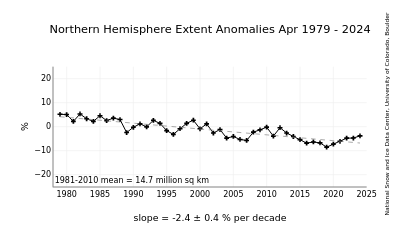
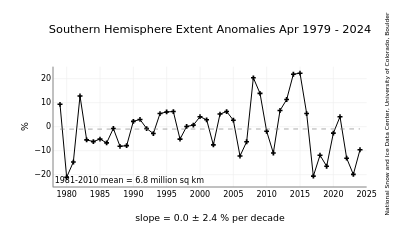
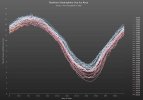
On the other hand, below are extent anomalies in percentage, i.e. the difference (in percentage) between the mean sea ice extent for given month and the mean for that month in 1981-2010 time period. Positive difference means that mean ice extent for the month (e.g. Jan 2015) is larger than that month (January) median of 1981-2010 period.

Graphs taken from the The National Snow and Ice Data Center: http://nsidc.org/data/seaice_index/

n_plot.png
s_plot.png

About This Graph said:
This graph shows monthly ice extent anomalies plotted as a time series of percent difference between the extent for the month in question and the mean for that month based on the January 1981 to December 2010 data. The anomaly data points are plotted as plus signs and the trend line is plotted with a dashed grey line.


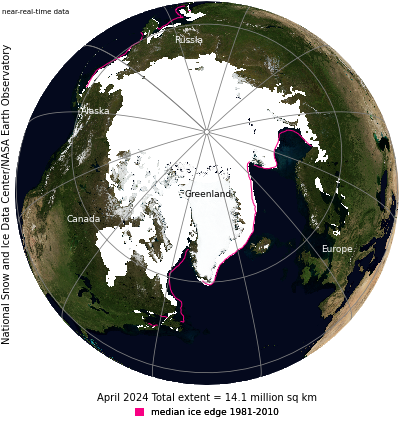
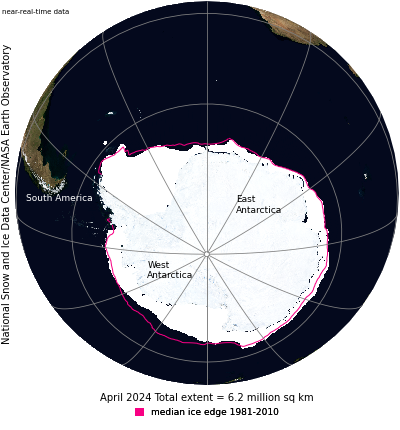
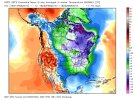
Here is also how it (the actual monthly extent; Arctic - left; Antarctic - right) looks like on BBM, with 1981-2010 monthly mean denoted with magenta line.

Description said:
Monthly images show sea ice extent with an outline of the 30-year (1981-2010) median extent for that month (magenta line).

N_monthly_bm_extent_web.png
S_monthly_bm_extent_web.png

edit: Added plot descriptions.
 

Attachments

  • Antarctica_sea_ice_coverage_Feb2015.jpg
    Antarctica_sea_ice_coverage_Feb2015.jpg
    487.2 KB · Views: 417
And here's the same type of plot for Arctic (attachment). This and a lot of other plots/graphs can be found on http://arctic.atmos.uiuc.edu/cryosphere/
Of course, as Mal7 pointed out, it should be viewed with a healthy dose of discernment about what's been shown.
In addition, also as Mal7 said, from the attached graph, it seems that Arctic sea ice coverage is increasing for few years now (compared to years before that).
 

Attachments

  • Arctic_sea_ice_coverage_Feb2015.jpg
    Arctic_sea_ice_coverage_Feb2015.jpg
    517.5 KB · Views: 395
'February's frigid temperatures continue into March' - Southern Ontario, Canada.

"Looking further ahead, it looks like the pattern will continue into early March. While every day will not necessarily be this way, mild temperatures are expected to dominate across British Columbia, and there are no signs of an early spring from the Prairies to Atlantic Canada."

"For those who experienced one of the coldest winters in recent memory last year, there is no question that this winter started out much milder than last year. However, it looks like the end of this winter will be reminiscent of last year (or even colder) from the Great Lakes to the Maritimes. If you are eager for milder temperatures, heading west to British Columbia will provide you with an early taste of spring. Heading south will also work, but even Florida will be impacted with colder than average temperatures during the next couple of weeks."

Yay. Just when I was gonna pack my bags for the "Sunshine State." Oh well, if the ice age switch does flip on this year I'm keeping them packed in the trunk.
 

Attachments

  • Weather Network Feb 2015.jpg
    Weather Network Feb 2015.jpg
    92.7 KB · Views: 326
On the iceagenow website there is some interesting but confusing discussion in the comments section about "The sun has gone flat line for 6th day in a row" (report on February 18, 2015).

Here is the article – the comments of those on the forum who know more about this subject and what is happening, would be very welcome.

http://iceagenow.info/2015/02/sun-flat-line-6th-day-row/

The sun has gone flat line for 6th day in a row
By Robert. February 18, 2015

Weakest solar cycle in more than a century.

“The Sun is flatlining,” says spaceweather.com. “For the 6th day in a row, solar activity remains very low. No sunspots are flaring, and the sun’s X-ray output has flatlined.”

“The main driver of all weather and climate, the entity which occupies 99.86% of all of the mass in our solar system, the great ball of fire in the sky – has gone quiet again during what is likely to be the weakest sunspot cycle in more than a century,” echoes vencoreweather.com. “Not since cycle 14 peaked in February 1906 has there been a solar cycle with fewer sunspots. We are currently more than six years into Solar Cycle 24 and today the sun is virtually spotless despite the fact that we are still in what is considered to be its solar maximum phase.”

“There have been two notable historical periods with decades-long episodes of low solar activity,” continues vencoreweather.com. “The first period is known as the “Maunder Minimum”, named after the solar astronomer Edward Maunder, and it lasted from around 1645 to 1715. The second one is referred to as the “Dalton Minimum”, named for the English meteorologist John Dalton, and it lasted from about 1790 to 1830.

“Both of these historical periods coincided with below-normal global temperatures in an era now referred to by many as the “Little Ice Age”.

“If this trend continues for the next couple of cycles, then there would likely be more talk of another “grand minimum” for the sun.”

http://vencoreweather.com/2015/02/17/29475/
http://spaceweather.com/

Thanks to Winona Campbell, Kurt Strom, Benjamin Napier, Jason Cragg and Tim Kieler for these links


Image: The flatlining of solar X-ray output in recent days – Courtesy NOAA/Space Weather Prediction Center
 

Attachments

  • Sun-x-ray-output-flatlined.gif
    Sun-x-ray-output-flatlined.gif
    16.1 KB · Views: 327
I found this video clip today. It shows the pacific ocean surface tempurature dropping from 50 degrees to 0 degress rapidly off the California coast, like maybe a vortex of sorts. Kinda like in the day after tomorrow movie. Ive tried to find the "surface tempurature heat index" for the pacific ocean so as to varifiy this article, but not getting very far, thus this post. Does anyone know where to find this info ? The post said it occurred yesterday Feb 21st.

This video came from utube from a site called Thornews, and Im not recommending the site. It appearse to have a few things a sott reader would find interesting but its a little on the comic/sexy side so buyer beware as usual. I do give the guy kudos on his rednex accent thou. Anyway, Im trying to confirm "if" this anomaly did in fact happen. Video below.

_https://www.youtube.com/watch?v=slnATedennE

Thx
 
Sorry to tell you but according to the 'scientists' you can indeed have both - an ice age and global warming!

Recently out in Nature Communications Journal:

http://www.nature.com/ncomms/2015/150623/ncomms8535/abs/ncomms8535.html

and garishly headlined by quite a few main stream media sources in the UK:

http://www.express.co.uk/news/nature/586404/Britain-freezing-winters-slump-solar-activity

is a rare seepage into the mainstream that the UK, US, northern Europe, Russia etc is now facing an imminent mini-ice age due to deepening sun inactivity. But apparently all is well because, according to the Met Office there is nothing to worry about…

http://home.bt.com/news/uk-news/britain-braced-for-mini-ice-age-as-temperatures-are-set-to-drop-to-a-300-year-low-11363988285992

'A Met Office-led study in conjunction with scientists at the Universities of Oxford, Cambridge and Reading, found that a return to low solar activity not seen for centuries could increase the chances of cold winters in Europe and eastern parts of the United States.

But the study, which was published in the Nature Communications journal, added that the freeze will not be enough to halt global warming.

Sarah Ineson, a Met Office scientist and lead author of the study said: "This research shows that the regional impacts of a grand solar minimum are likely to be larger than the global effect, but it's still nowhere near big enough to override the expected global warming trend due to man-made change.

"This means that even if we were to see a return to levels of solar activity not seen since the Maunder Minimum, our winters would likely still be getting milder overall."

See - sinful man has still debts to pay in the global warming scam that will run and run until the glaciers knock at the front door... :lol: :evil: :O :huh:

Cognitive dissonance KO! Thank God they have their computer models to keep us all safe at night! They had me worried there!
 
Solar activity to fall by 60% in 2030-40?

Today's news:

There will be a "mini ice age" in 2030, solar scientists have said.

We are now able to predict solar cycles with far greater accuracy than ever before thanks to a new model which shows irregularities in the sun’s 11-year heartbeat.

The model shows that solar activity will fall by 60 per cent between 2030 and 2040 causing a "mini ice age".

The conditions predicted have not been experienced since the last "mini ice age" which lasted from 1645 to 1715, called the Maunder Minimum.

The findings are being presented by Professor Valentina Zharkova at the National Astronomy Meeting in Llandudno.

In 1843 scientists first discovered that the sun's activity varies over a cycle of 10 to 12 years.

Fluctuations within that cycle have been difficult to predict, although many solar physicists new that the variations were caused by a dynamo of moving fluid deep inside the sun.

Professor Zharkova’s team of researchers has found that adding a second dynamo close to the surface of the sun, creates a far more accurate model.

The scientists found magnetic waves in two different layers of the sun’s interior which fluctuate between the northern and southern hemispheres of the sun.

“Combining both waves together and comparing to real data for the current solar cycle, we found that our predictions showed an accuracy of 97 per cent," Professor Zharkova said.

The magnetic wave patterns show that there will be fewer sunspots in the next two solar cycles. Cycle 25, which peaks in 2022 and Cycle 26, from 2030 to 2040 will both have a significant reduction in solar activity.

Edit: found on SoTT http://www.sott.net/article/298913-Scientists-say-Suns-heartbeat-will-bring-on-Ice-Age.
 
Re: Solar activity to fall by 60% in 2030-40?

Great, so we still have a few more years to prepare for the Ice Age. :)

Also, a drop in solar activity causes the Earth magnetic field to weaken which then leads to increased activity on the planet such as hurricanes, tornadoes, earthquakes and volcanic eruptions as described in Pierre's book. Looks like the things are going to get turbulent in the coming years.
 
Re: Solar activity to fall by 60% in 2030-40?

Eboard10 said:
Great, so we still have a few more years to prepare for the Ice Age. :)

Thank you for your optimism Eboard10. :)

Eboard10 said:
Also, a drop in solar activity causes the Earth magnetic field to weaken which then leads to increased activity on the planet such as hurricanes, tornadoes, earthquakes and volcanic eruptions as described in Pierre's book. Looks like the things are going to get turbulent in the coming years.

Yeah, this figure (60 per cent drop in solar activity within just 15 years) sounds like a pretty dramatic change. It will probably be accompanied by all of the above at even bigger scale than we're already witnessing. This year we're already having overwhelming floods and fires in Russia and even tornadoes which used to be unusual for most of our territory. And giant craters too. Turbulent years to come indeed.
 
Michael BC said:
'A Met Office-led study in conjunction with scientists at the Universities of Oxford, Cambridge and Reading, found that a return to low solar activity not seen for centuries could increase the chances of cold winters in Europe and eastern parts of the United States. But the study, which was published in the Nature Communications journal, added that the freeze will not be enough to halt global warming. Sarah Ineson, a Met Office scientist and lead author of the study said: "This research shows that the regional impacts of a grand solar minimum are likely to be larger than the global effect, but it's still nowhere near big enough to override the expected global warming trend due to man-made change. This means that even if we were to see a return to levels of solar activity not seen since the Maunder Minimum, our winters would likely still be getting milder overall."

.......

Cognitive dissonance KO! Thank God they have their computer models to keep us all safe at night! They had me worried there!

It's great to see they include an increased rate of meteoric dust loadings in these 'models' (sarcasm). Baby steps I guess, at least it's now potentially in the periphery of more people's minds.
 
Sunspot count now lower than during the Dalton Minimum

According to NASA, the sunspot cycle we are now passing through – Sunspot Cycle 24 – is the smallest such cycle since Cycle 14, which ended back in 1906.That is incorrect, says reader J. H. Walker.“The problem with NASA’s sunspot count is that these are inflated by every blemish and spot fragment due to the optics they use,” says Walker.

sc5_sc24_Laymans-Count-Comparison.png


If you use the Landscheidt sunspot-counting method, which counts only those spots that can be seen by 40MM optics, you realize that the current count is less than Solar Cycle 5. That solar cycle began in May 1798 and ended in December 1810.It also corresponded with the Dalton Minimum.

The Dalton Minimum, a period of low solar activity named after English meteorologist John Dalton, lasted from about 1790 to 1830, says Wikipedia.

Like the Maunder Minimum and Spörer Minimum, the Dalton Minimum coincided with a period of lower-than-average global temperatures. The Oberlach Station in Germany, for example, experienced a 2.0°c decline over 20 years.The “year without a summer” also occurred during the Dalton Minimum.“

The NASA counting method bears no relationship to the methods used in previous Solar Minimums, says Walker. “Hence the comparison with 1906 SC14 rather than SC5 1798.”

http://www.landscheidt.info/images/sc5_sc24_1.png

Source: http://iceagenow.info/2015/08/sunspot-count-now-lower-than-during-the-dalton-minimum/
 
Altair said:
According to NASA, the sunspot cycle we are now passing through – Sunspot Cycle 24 – is the smallest such cycle since Cycle 14, which ended back in 1906.That is incorrect, says reader J. H. Walker.“The problem with NASA’s sunspot count is that these are inflated by every blemish and spot fragment due to the optics they use,” says Walker.

If you use the Landscheidt sunspot-counting method, which counts only those spots that can be seen by 40MM optics, you realize that the current count is less than Solar Cycle 5. That solar cycle began in May 1798 and ended in December 1810.It also corresponded with the Dalton Minimum.

Thanks for sharing the article Altair. It's quite worrying to read that NASA scientists reporting on sunspot count fail to take into account the fact that astronomers in the past didn't possess today's equipment and could only observe larger sunspots. Are they really that absent-minded or is it done on purpose? I wonder...
 
Eboard10 said:
Altair said:
According to NASA, the sunspot cycle we are now passing through – Sunspot Cycle 24 – is the smallest such cycle since Cycle 14, which ended back in 1906.That is incorrect, says reader J. H. Walker.“The problem with NASA’s sunspot count is that these are inflated by every blemish and spot fragment due to the optics they use,” says Walker.

If you use the Landscheidt sunspot-counting method, which counts only those spots that can be seen by 40MM optics, you realize that the current count is less than Solar Cycle 5. That solar cycle began in May 1798 and ended in December 1810.It also corresponded with the Dalton Minimum.

Thanks for sharing the article Altair. It's quite worrying to read that NASA scientists reporting on sunspot count fail to take into account the fact that astronomers in the past didn't possess today's equipment and could only observe larger sunspots. Are they really that absent-minded or is it done on purpose? I wonder...

They are either stupid or disingenious. Since those PhD NASA guys spend their lives using telescopes I think they are perfectly aware that their hi tech equipments detect sunspots that are way smaller than what was being detected during the 18th century.

In addition, this is not the first time such manipulation of data in order to support the dominant ideology happens. See for example the East Anglia scandal or the removal of weather stations in rural area which magnifies the effects urban heat island on the calculation of world average temperatures.
 
Back
Top Bottom