Judith A Hubbard and
Kyle Bradley (from Earthquake Insights on Sub Stack) provide a very insightful, well-researched breakdown of the Nevada quake.
It's freek'n eye-opening IMHO!
Is it related to the earlier M5.7 in December 2024?

earthquakeinsights.substack.com
At 6:29 PM on April 13th, 2026 (2026-04-14 UTM), a
magnitude 5.7 earthquake struck western Nevada. The USGS estimates that the maximum shaking reached intensity VI (strong) near the epicenter, with reports of weaker shaking from as far away as San Francisco. We are not aware of any reports of damage; in general, intensity VI shaking may break dishes and some windows, and cause slight damage to homes.
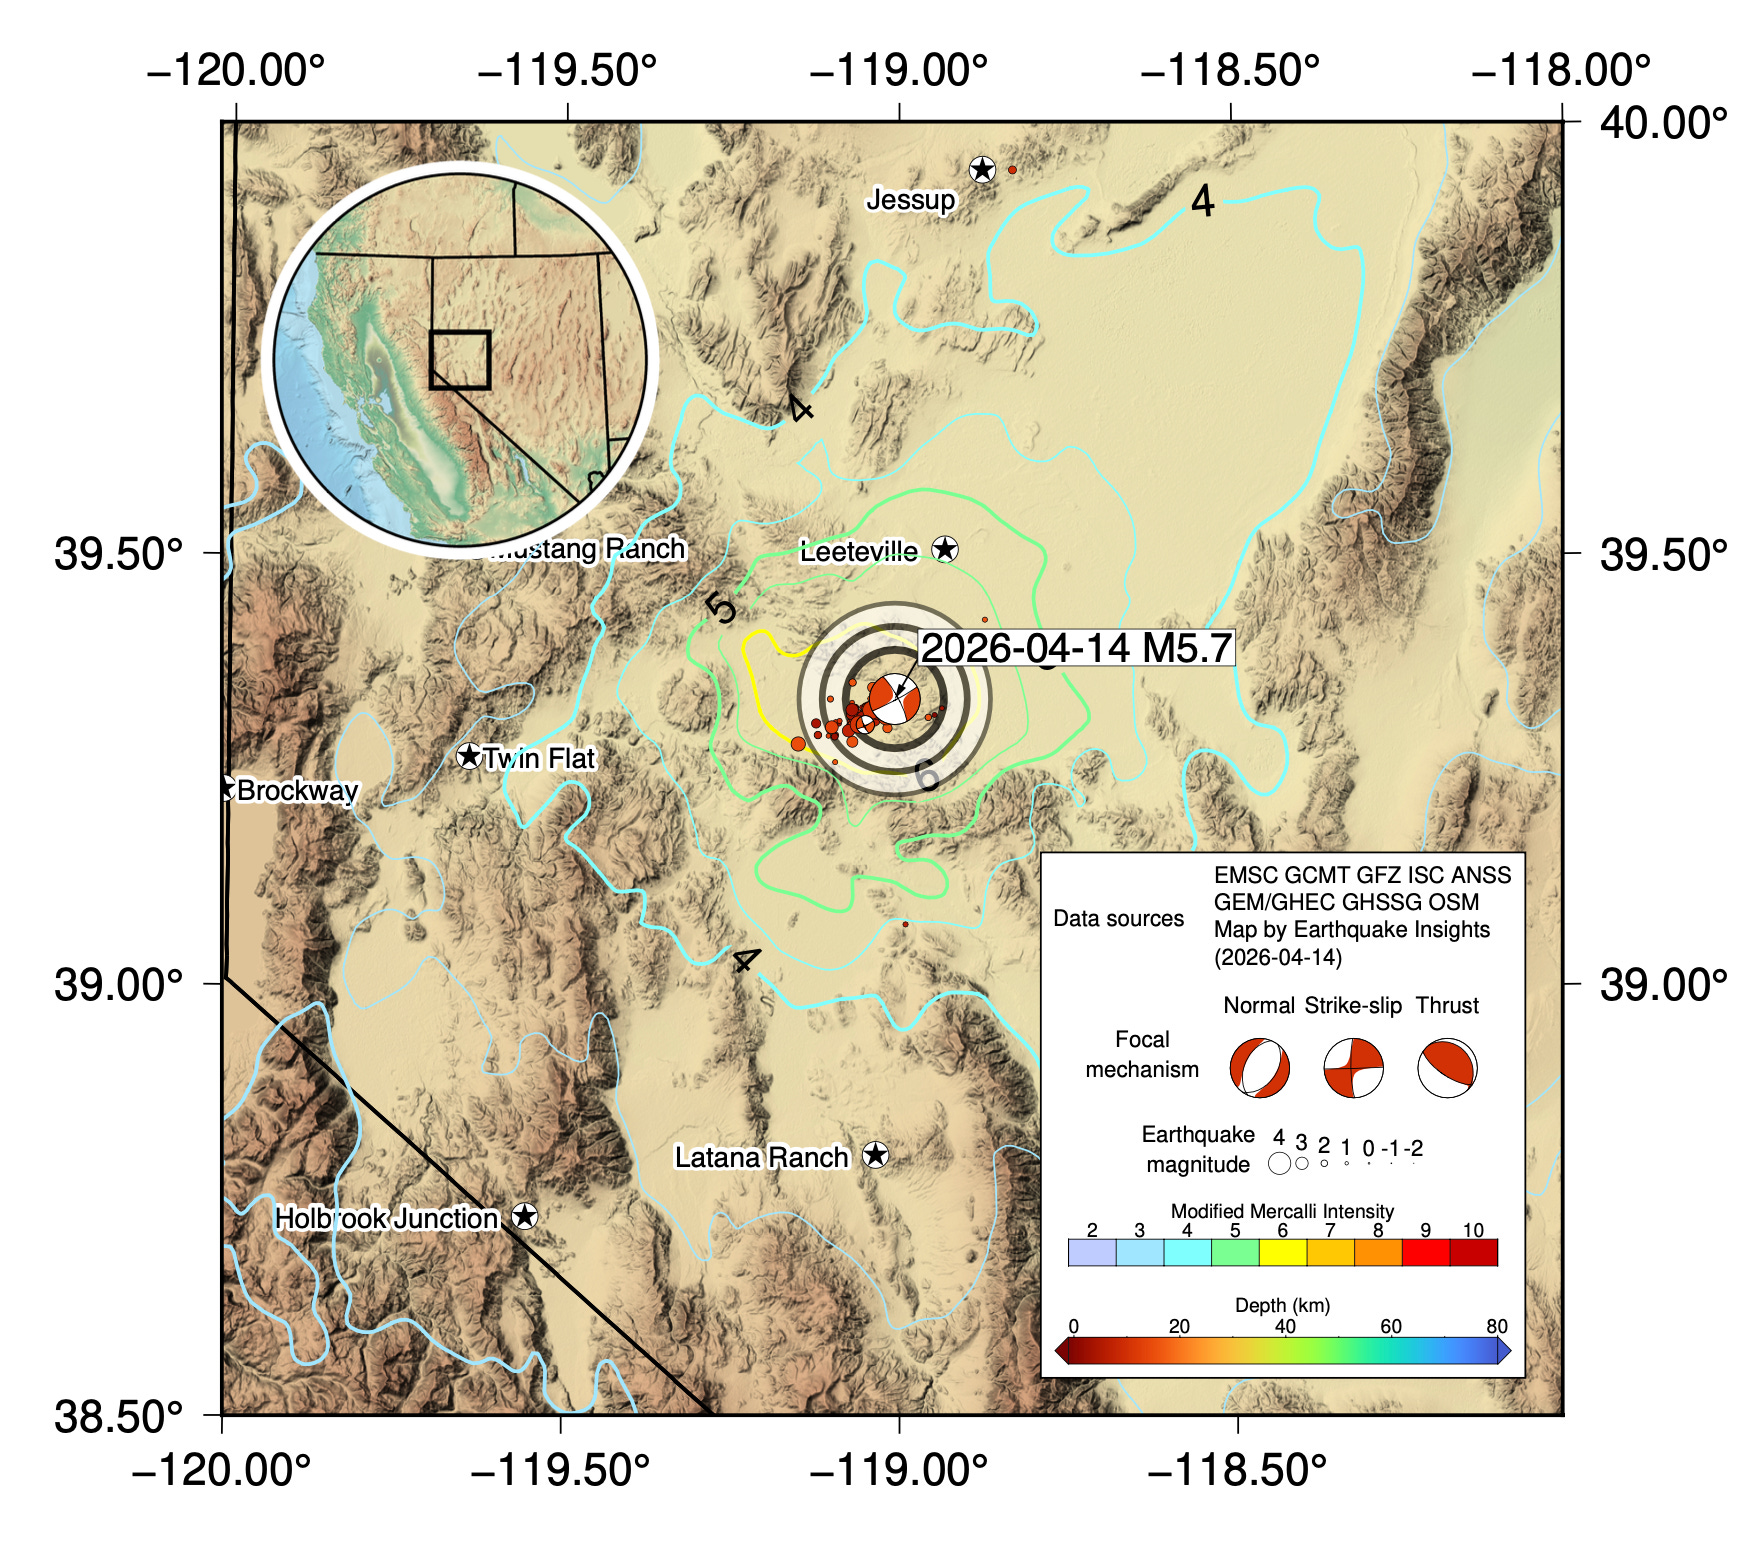
 Figure 1:
 Map of the 2026-04-14 M5.7 earthquake and its aftershocks. Colored lines are contours of estimated shaking intensity from the USGS.
So far, more than six thousand people have reported feeling shaking in the event to the USGS Did-You-Feel-It system; you can add your own report
here.
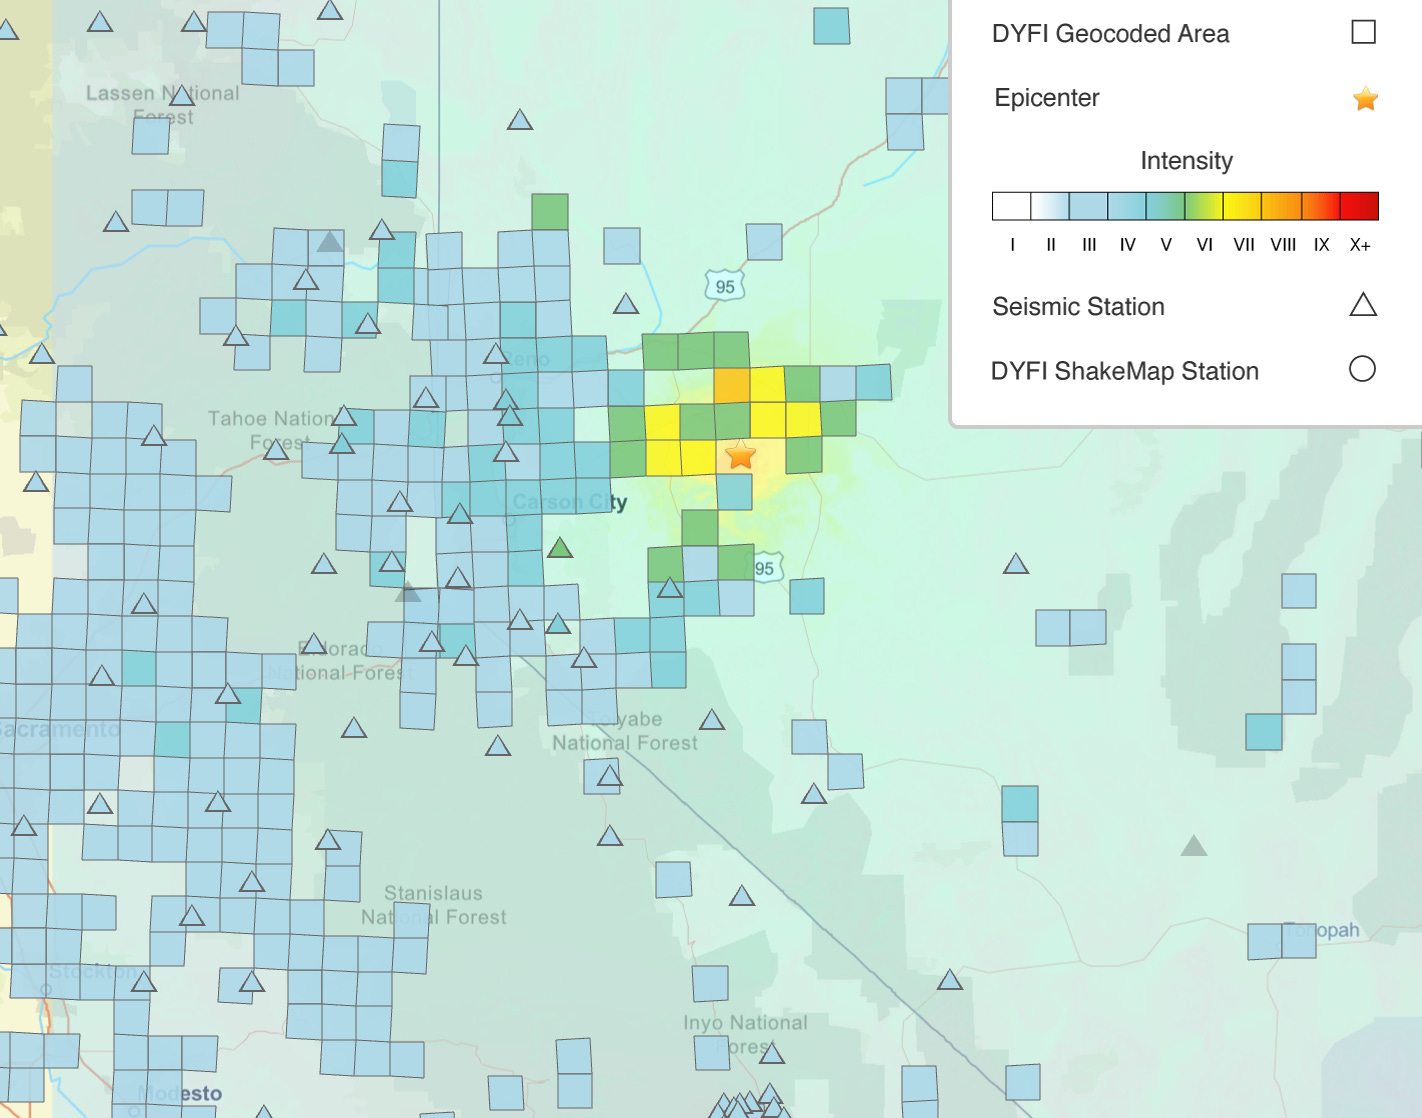
 Figure 2:
 Estimated shaking intensities from felt reports (squares) and recorded by seismometers (triangles). Source: USGS,
https://earthquake.usgs.gov/earthquakes/eventpage/nn00914068/dyfi/intensity
Testimonies to the EMSC provide a more in-depth view of the experience. None of the comments describe damage, but several note the duration of the shaking: “Lasted longer than expected.” “It was a long shaking quake.” “Shaking lasted at least 30-60 seconds - Reno, NV.” “Wasn’t sure it was going to stop.” “In Sparks, NV, I felt a series of back/forth shifting for maybe a minute.”
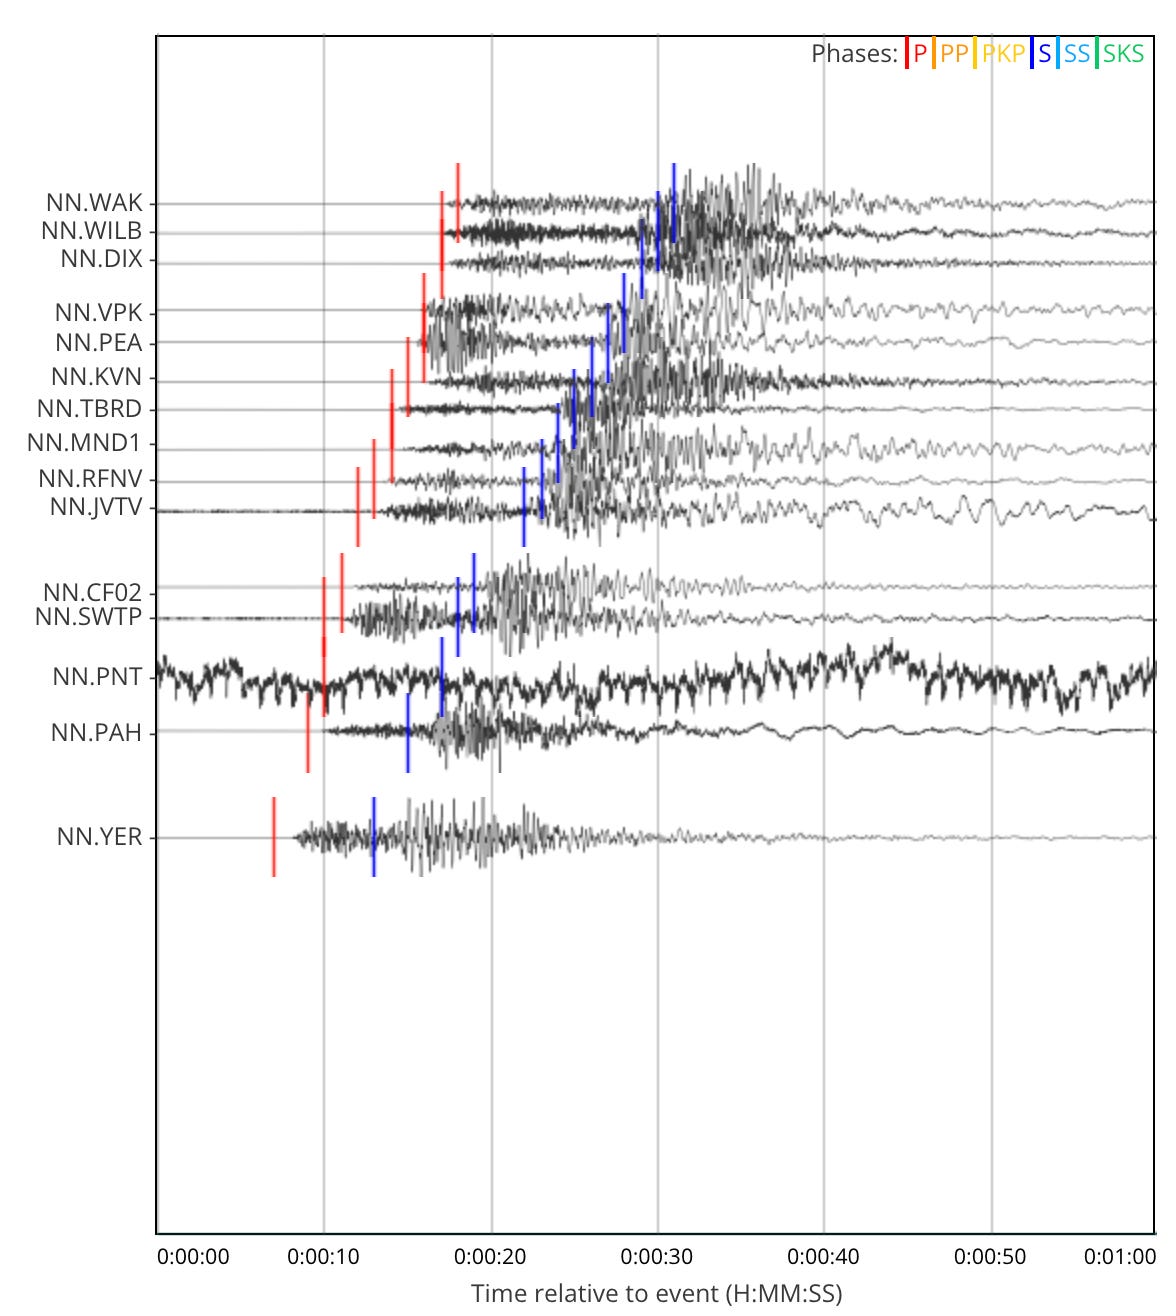
Here are some recordings of the shaking for the one minute after the earthquake started, within 1° (~110 kilometers) of the epicenter. The stations closest to the epicenter are at the bottom, and those further away are at the top. The red and blue lines mark the approximate arrival times of the P and S waves, respectively. In general, it looks like the stronger shaking lasted ~10-20 seconds, although it isn’t possible from this plot to know what level of shaking was detectable.
 Figure 3:
 Seismograms recorded by seismometers within 1° of the 2026-04-14 earthquake, sorted by distance (bottom to top), within one minute of the
earthquake. Source: https://ds.iris.edu/wilber3/find_stations/12095087
So far, more than sixty aftershocks of M≥2 have been detected by the USGS; the largest was a magnitude 3.9 earthquake about three hours after the mainshock.
Earthquake patterns
We last wrote about this part of Nevada in December 2024, when a
magnitude 5.7 earthquake struck ~15 kilometers to the south. Below, we have plotted all the earthquakes in the region since August 2024. The patterns of the two earthquake sequences immediately pop out.
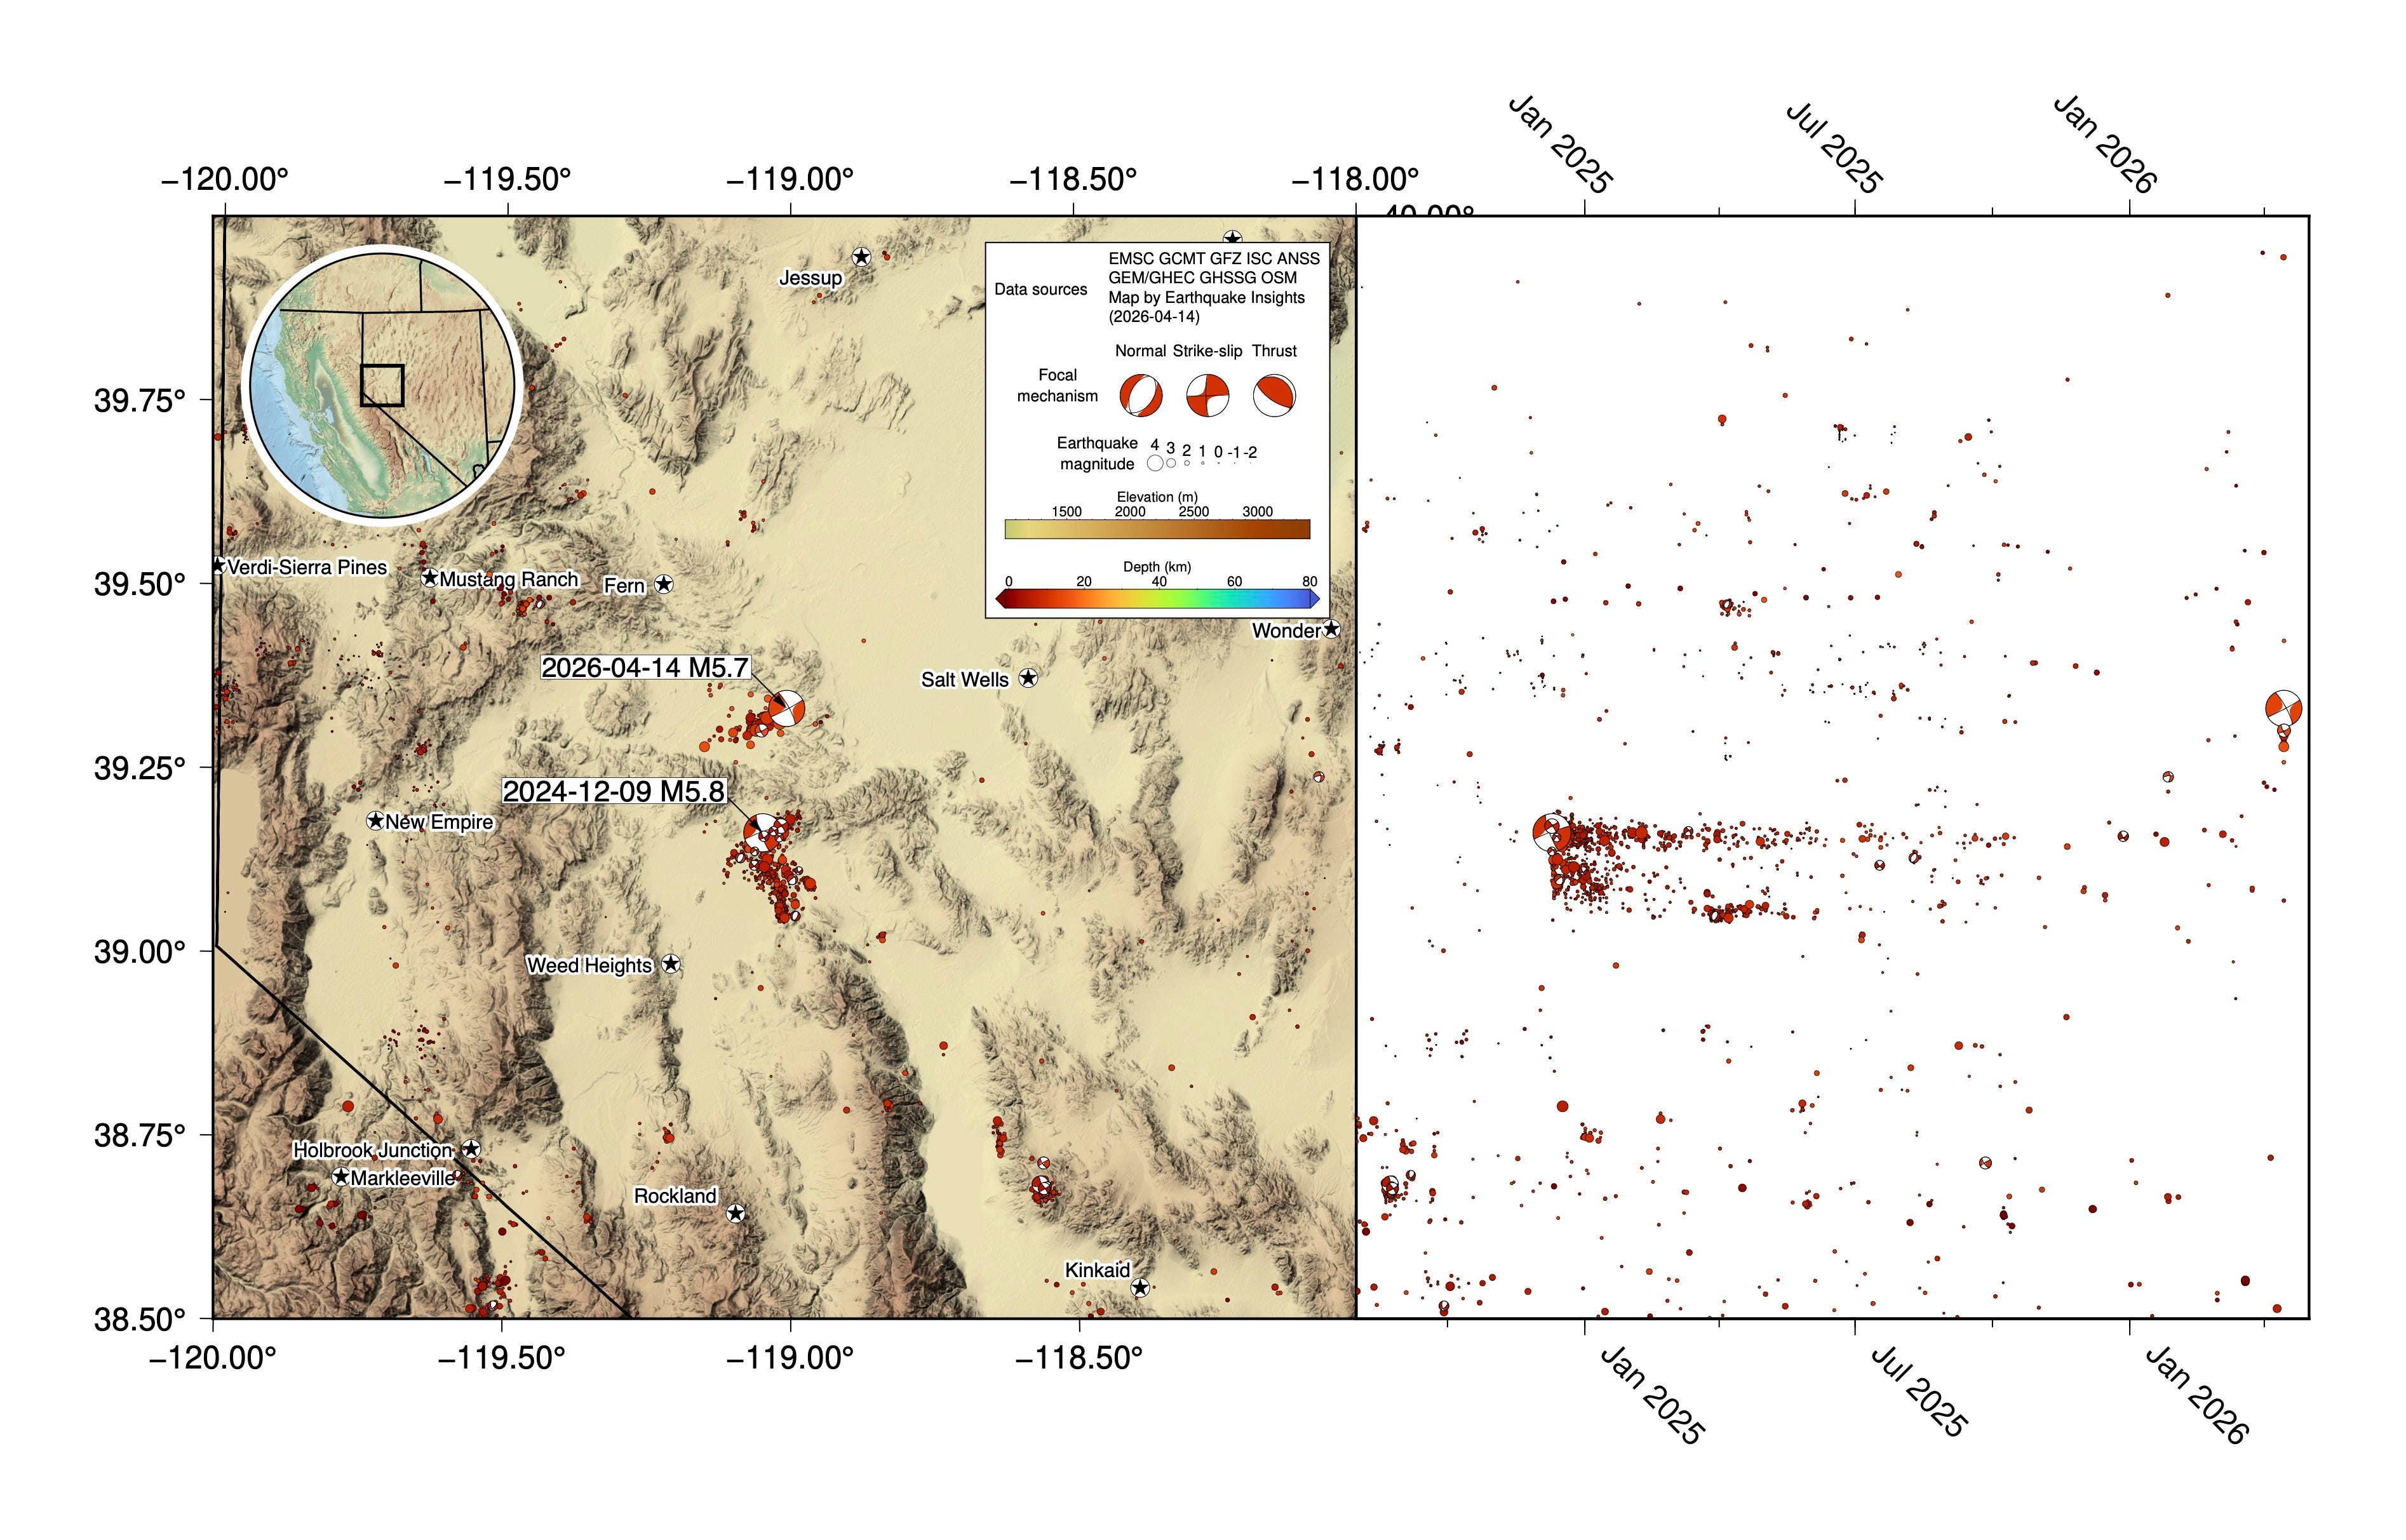
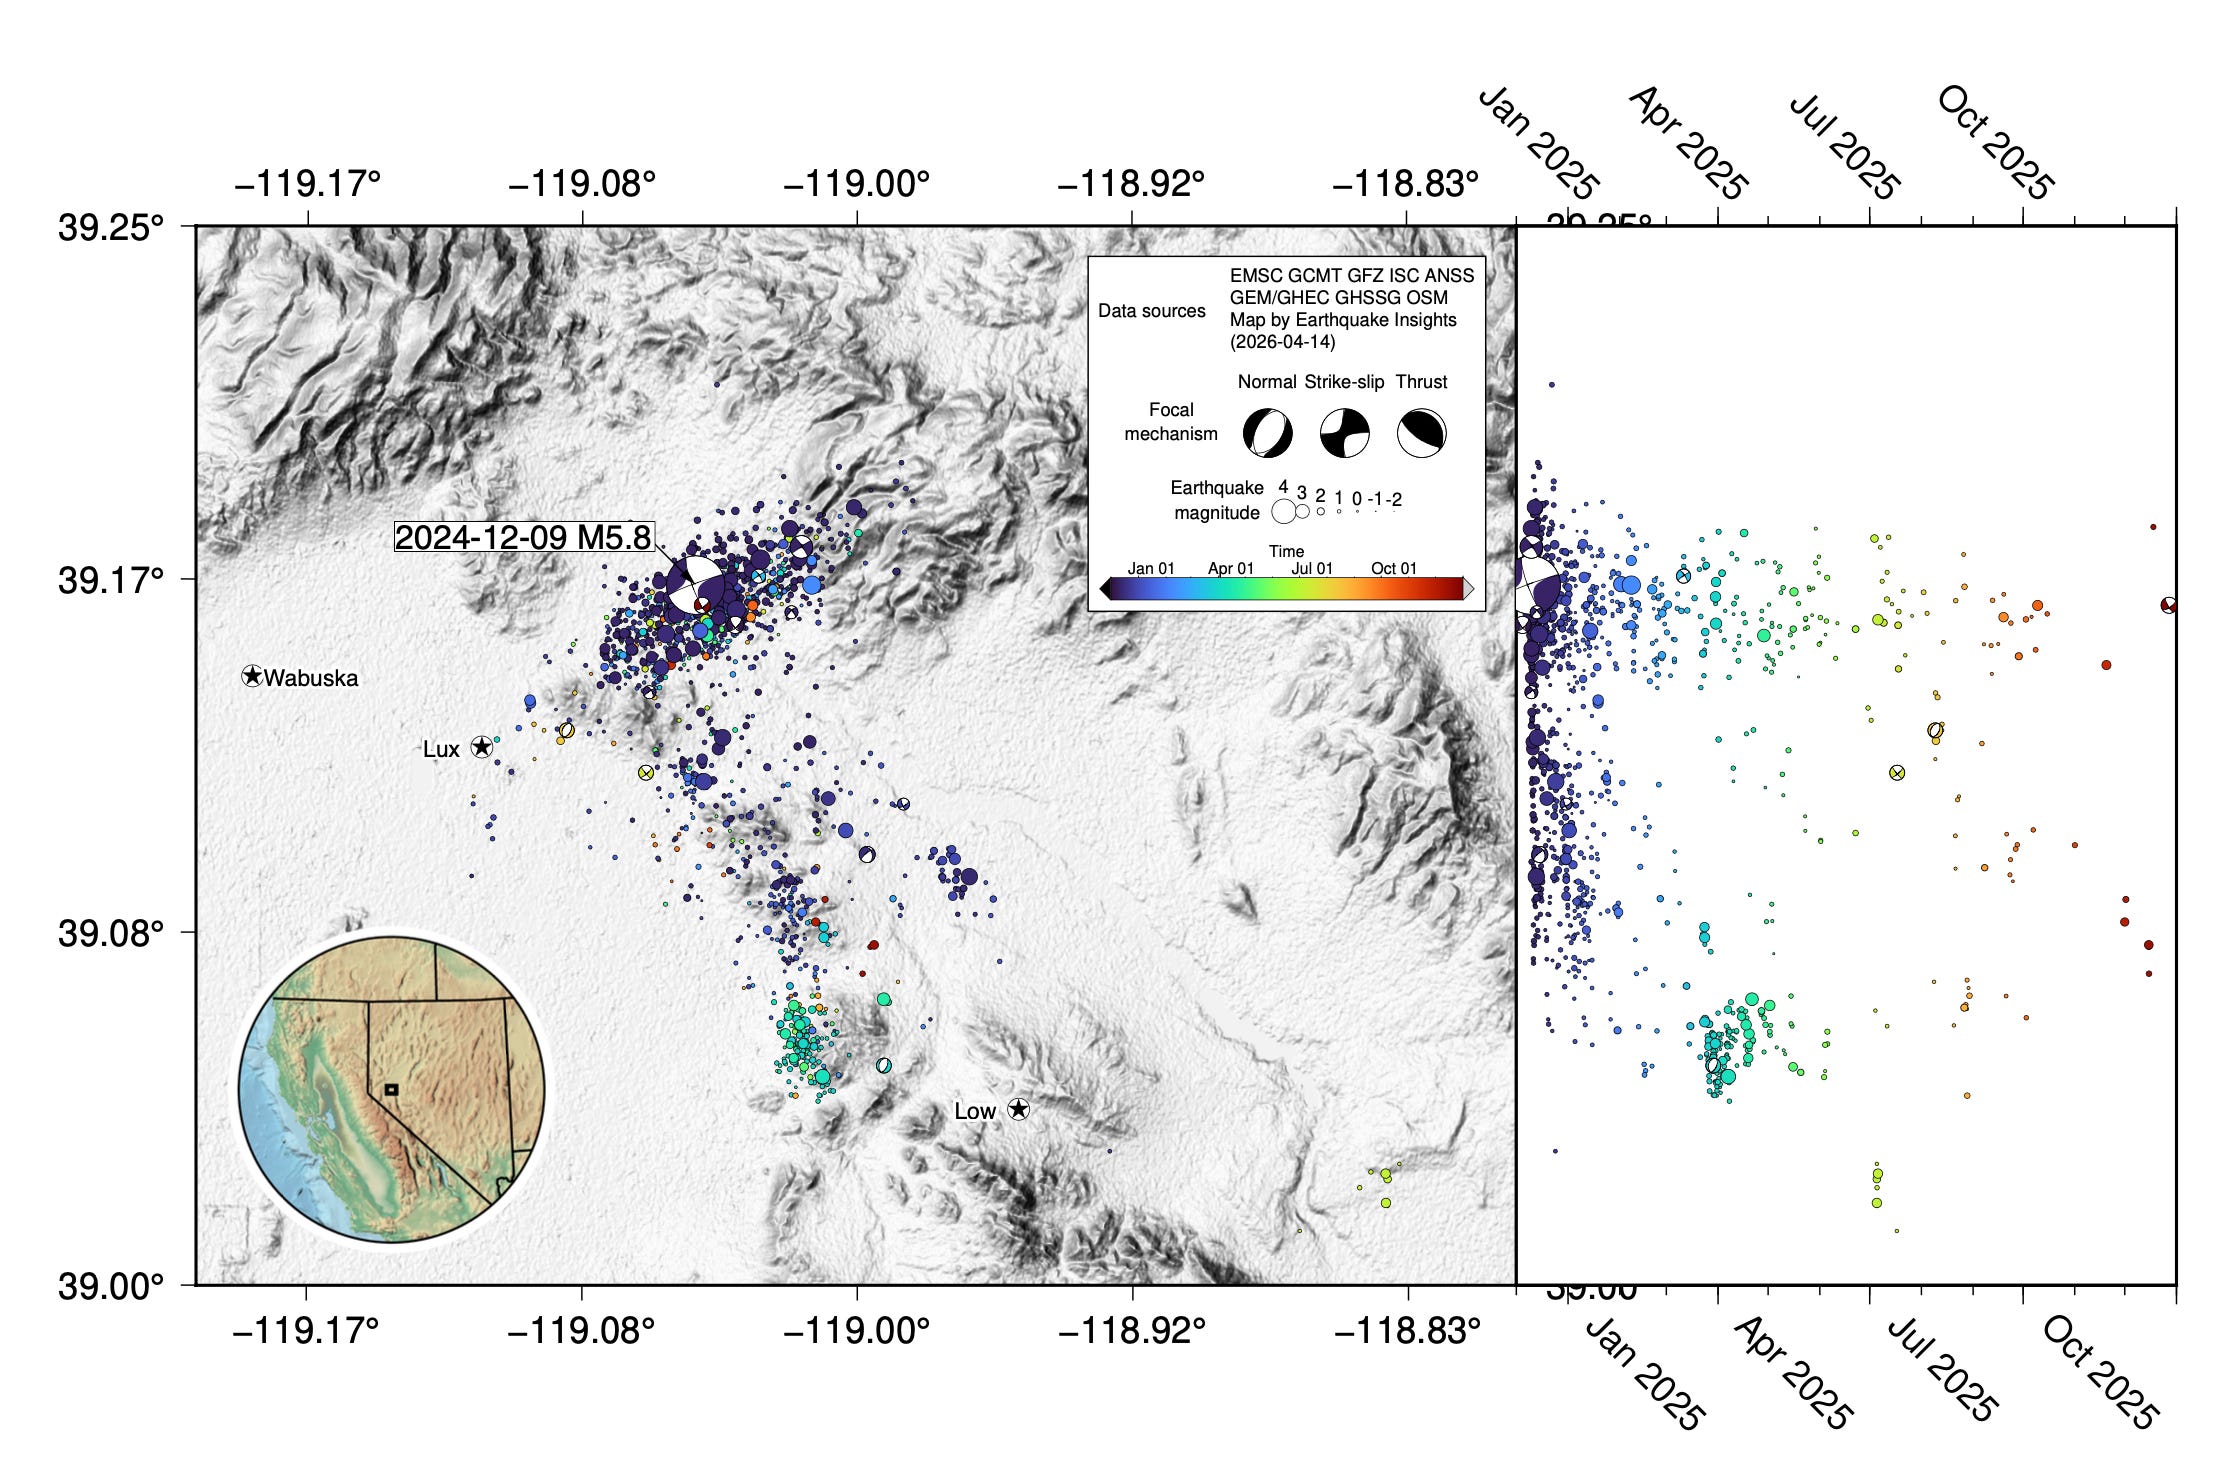
 Figure 4:
 Earthquakes since 2024-08-01. The earthquakes are shown on the map, and also projected to the right onto a timeline. Events above M5.5 are labelled.
Both earthquake focal mechanisms are quite similar: strike-slip, with nodal planes oriented northeast-southwest and northwest-southeast. When the 2024 earthquake occurred, we
spent some time discussing which of the two nodal planes might match the earthquake, ultimately preferring the northeast-southwest plane. We can look back at that event now with many more aftershocks in hand to evaluate that guess:
 Figure 5:
 Earthquakes from 2024-12-01 through 2026-01-01 around the December 2024 event. Earthquakes are colored by time, and also projected to the right onto a timeline.
Indeed, it does look like the 2024 earthquake primarily ruptured a northeast-southwest oriented fault, although there are also some messy earthquakes in the opposite orientation. A cluster of earthquakes in March and April to the south emphasize that northwest-southeast orientation (green on the map above). This complexity is unsurprising: strike-slip earthquakes regularly seem to rupture orthogonal faults, especially in areas where a main large fault has not become dominant.
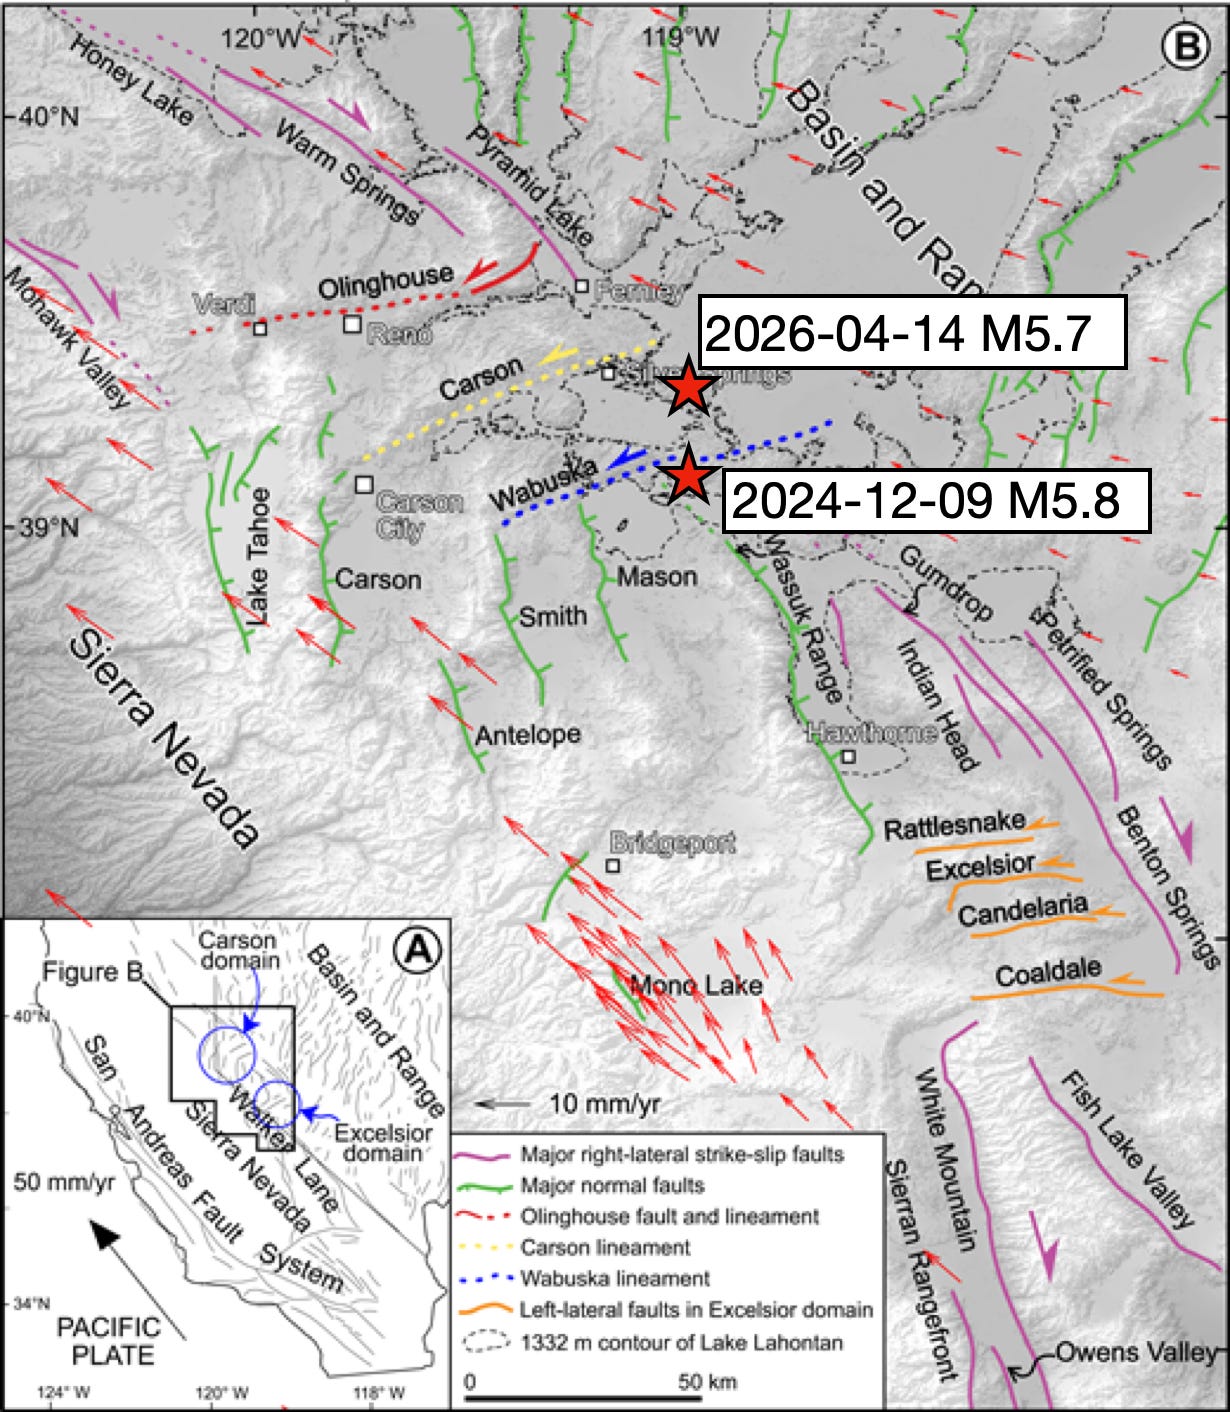
After the 2024-12-09 earthquake occurred, we interpreted that it probably occurred on the Wabuska lineament, which was identified and mapped by geologists. When we put this new earthquake on that same map, we see that although there is a parallel lineament to the north (the Carson lineament), this earthquake does not line up with it:
 Figure 6:
 Map of major faults in the central Walker Lane. Figure 1 of Li et al. (2017); red stars added to show the locations of the recent earthquakes.
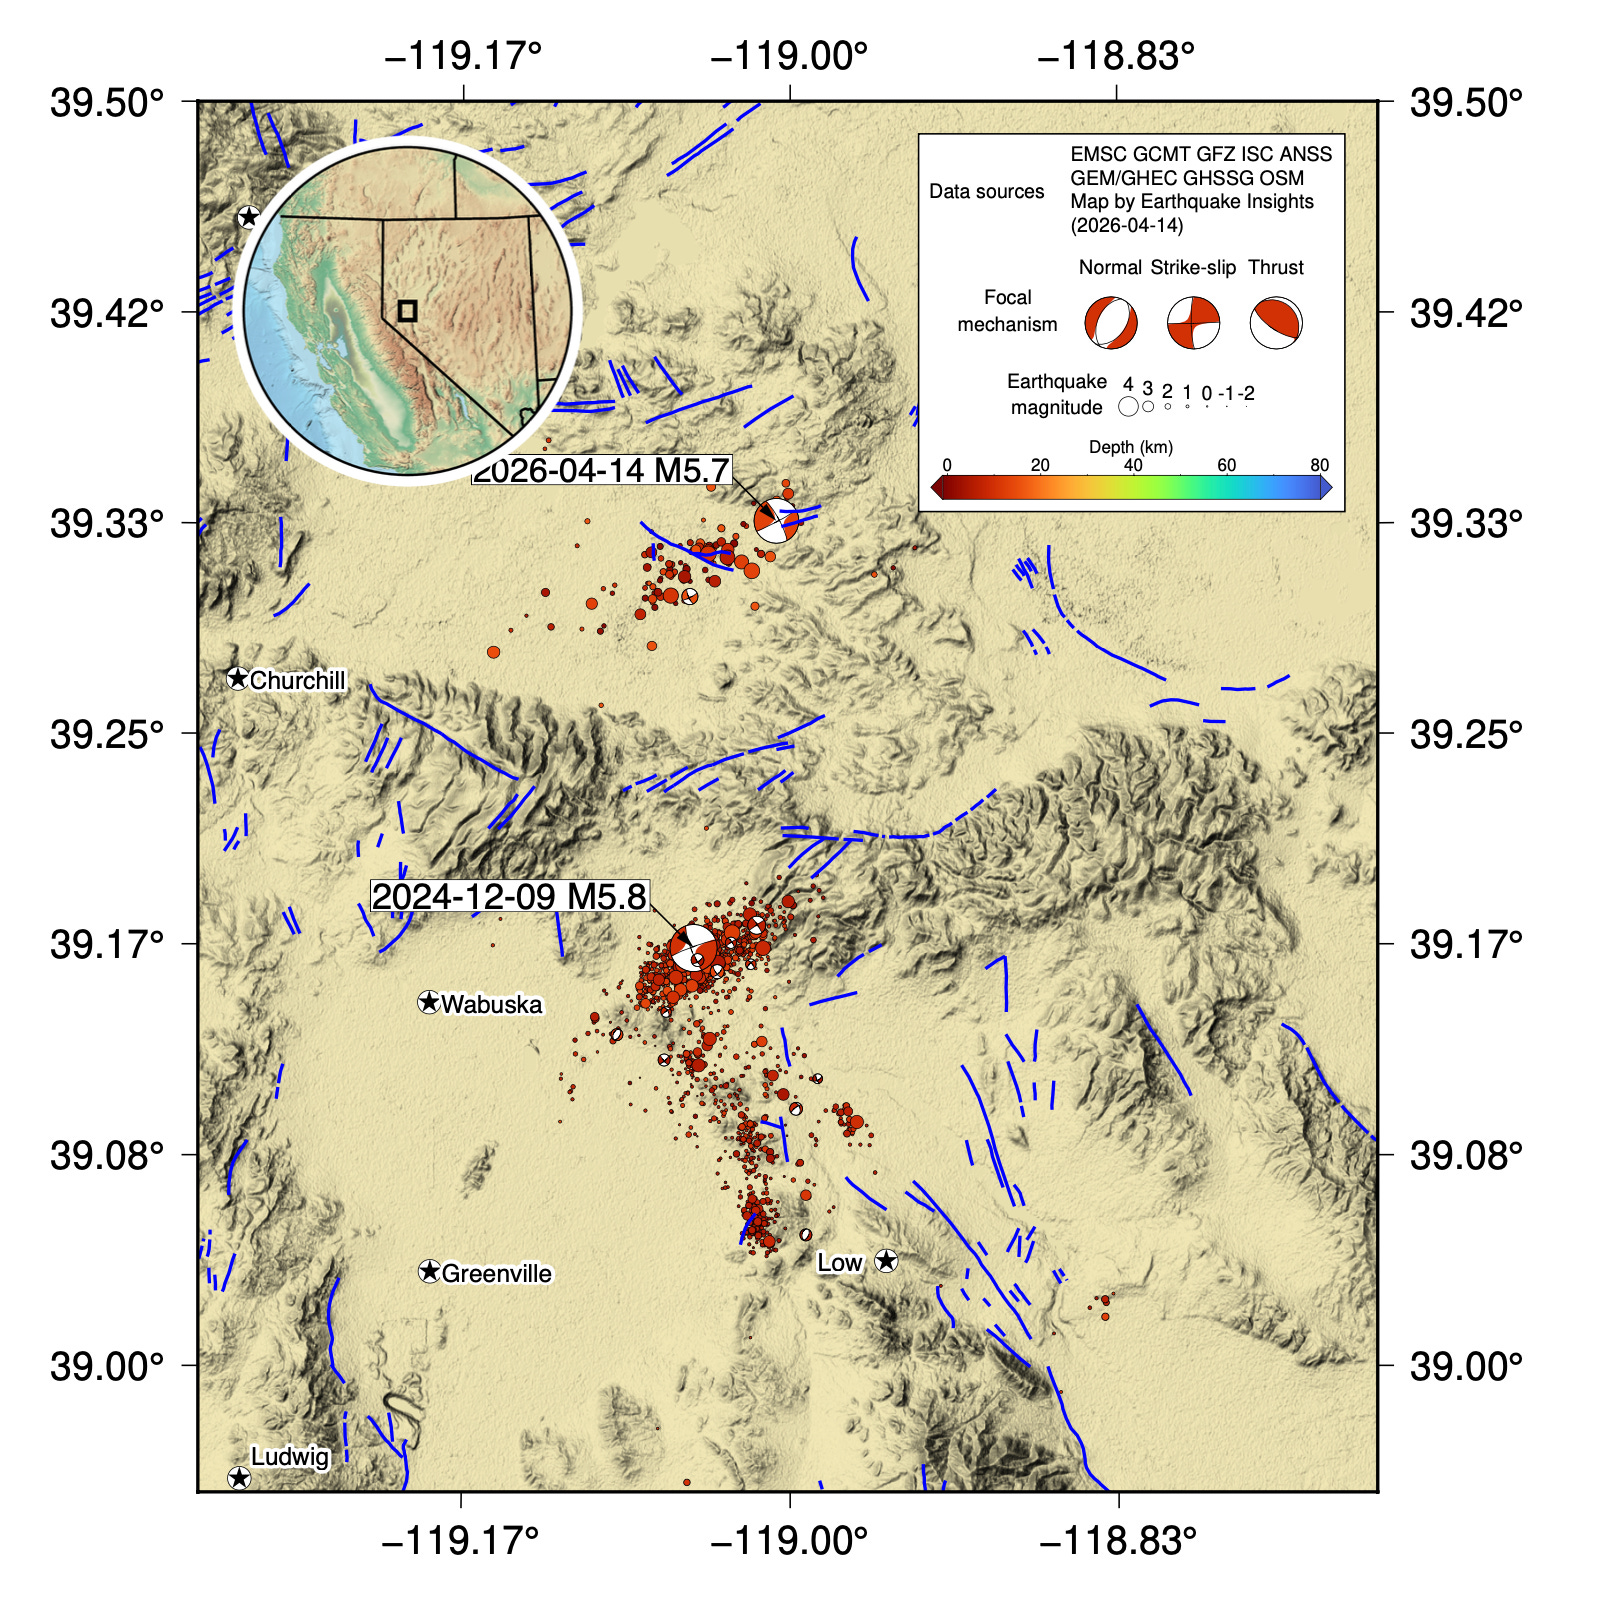
Of course, those lineaments are not the same as a real fault map. Many faults are mapped across this region, including a handful of short, scattered fault segments around the recent earthquake sequence. The USGS interactive fault map labels this an “unnamed fault zone in the Dead Camel Mountains.” These mapped faults seem to swoop rather haphazardly through the aftershocks rather than aligning in any clear way, so it remains unclear whether they bear much relation to the earthquakes that occurred.
 Figure 7:
 Earthquakes since August 2024, plotted against the USGS Quaternary Fault and Fold database (blue lines).
As an aside, the Dead Camel Mountains are apparently named for some camels that were imported by the U.S. Army during the mid-19th-century: the Camel Corps. Although the experiment was ultimately a failure, some of the camels escaped and roamed across the desert for before eventually dying out,
possibly some time in the 1940s.
Earthquake triggering?
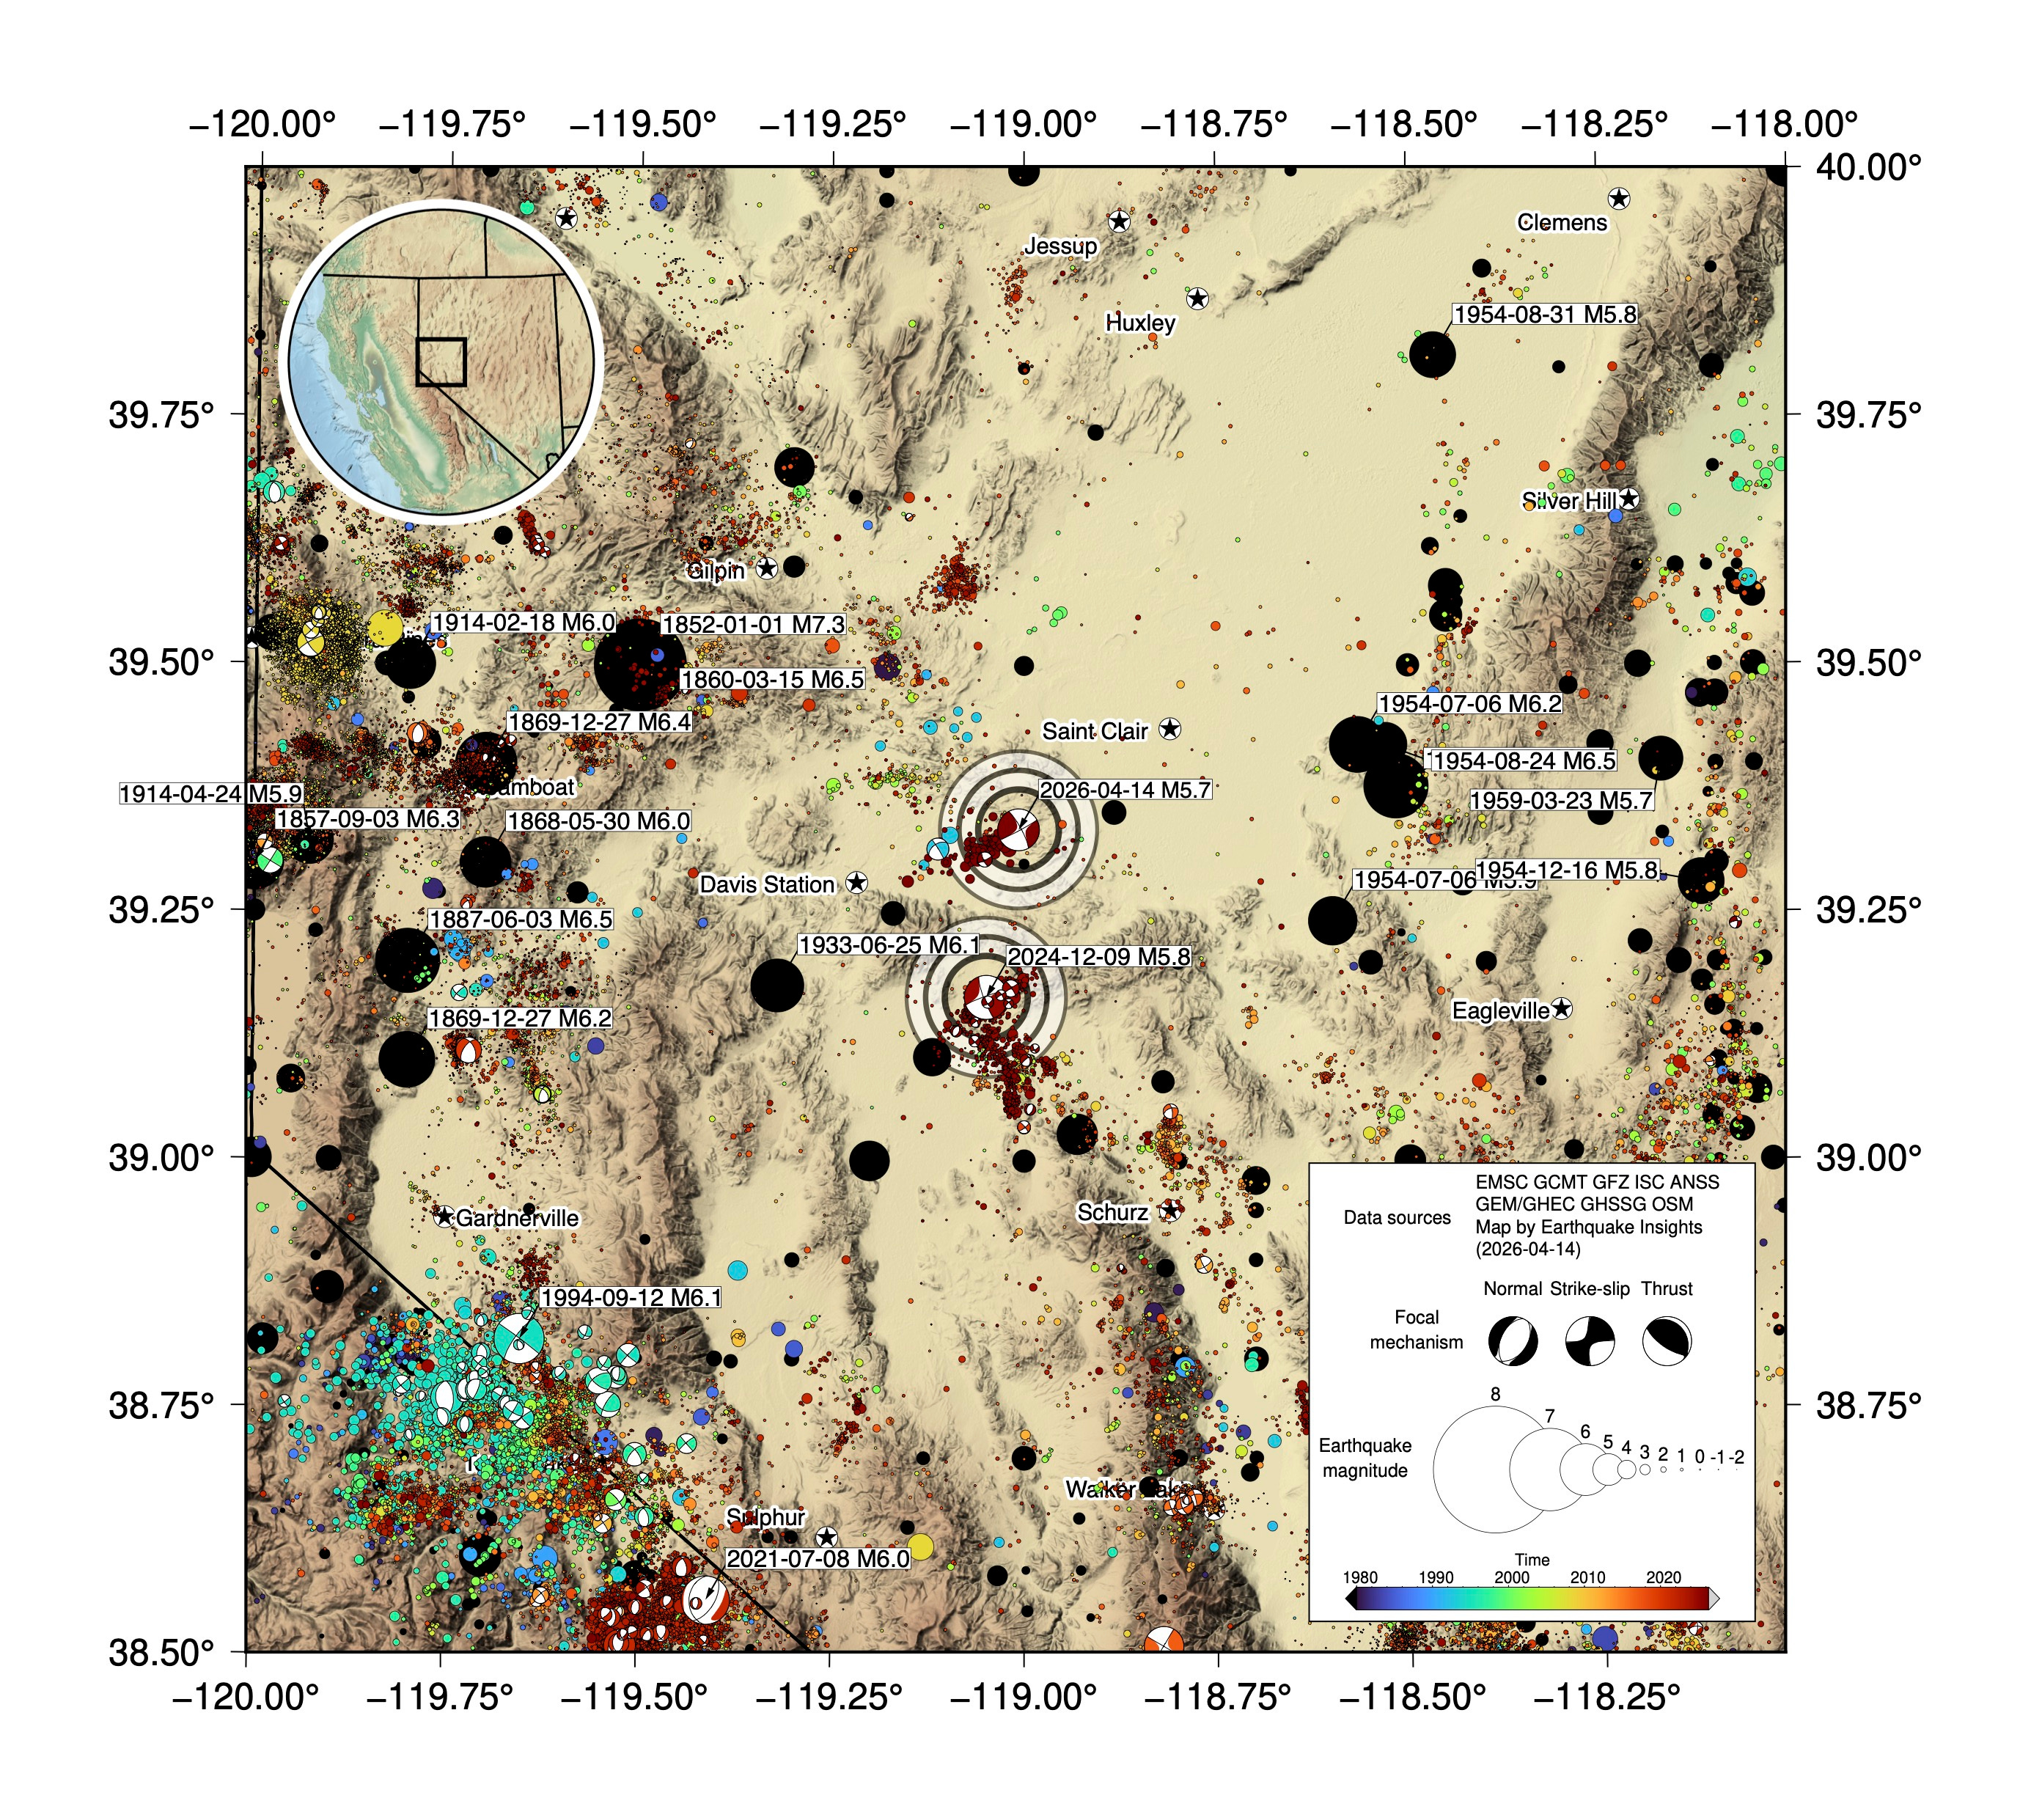
This recent magnitude M5.7 earthquake clearly occurred on a different fault than the earthquake about 16 months earlier. And yet, the proximity of the earthquakes in space and time is suggestive. M5+ earthquakes in this region are relatively rare. That suggests that the stress changes caused by the first earthquake sequence probably had something to do with the initiation of the second. On the map below, we have colored earthquakes by time (1980-2026), with pre-1980 events in black. The two dark red earthquakes and their aftershocks are among the most prominent earthquakes in recent decades.

Figure 8: Recorded earthquakes in west-central Nevada, colored by time. Earthquakes above M5.7 are labelled. Earthquakes before 1980 are in black.
If you look at the map above long enough, another thing will jump out: the year 1954. In the northeastern corner of the map, there were a half-dozen earthquakes above M5.7 during that year — in July, August, and December. What’s going on?
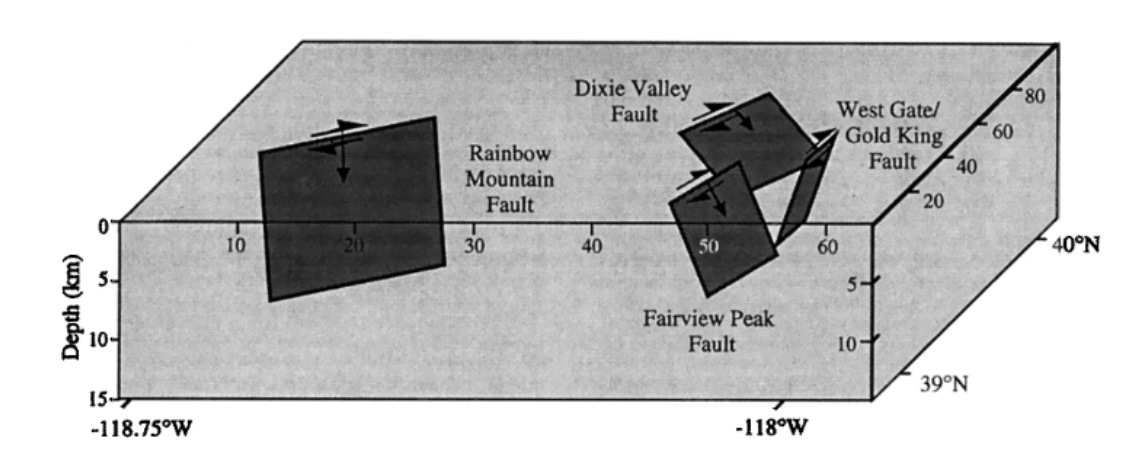
This is the Rainbow Mountain-Fairview Peak-Dixie Valley earthquake sequence — a series of mutually triggered normal-faulting events. These earthquakes in the Central Nevada Seismic Zone started with two events on the Rainbow Mountain fault (1954-07-06 M6.2 and 1954-08-24 M6.5). They were followed in December by a M7.2 earthquake on the Fairview Peak fault combined with the West Gate and Gold King faults, and then four minutes after that, a M6.7 earthquake on the Dixie Valley fault.
 Figure 9:
 Fault models used to evaluate the Rainbow Mountain-Fairview Peak-Dixie Valley earthquake sequence. Figure 4 of Hodgkinson et al. (1996).
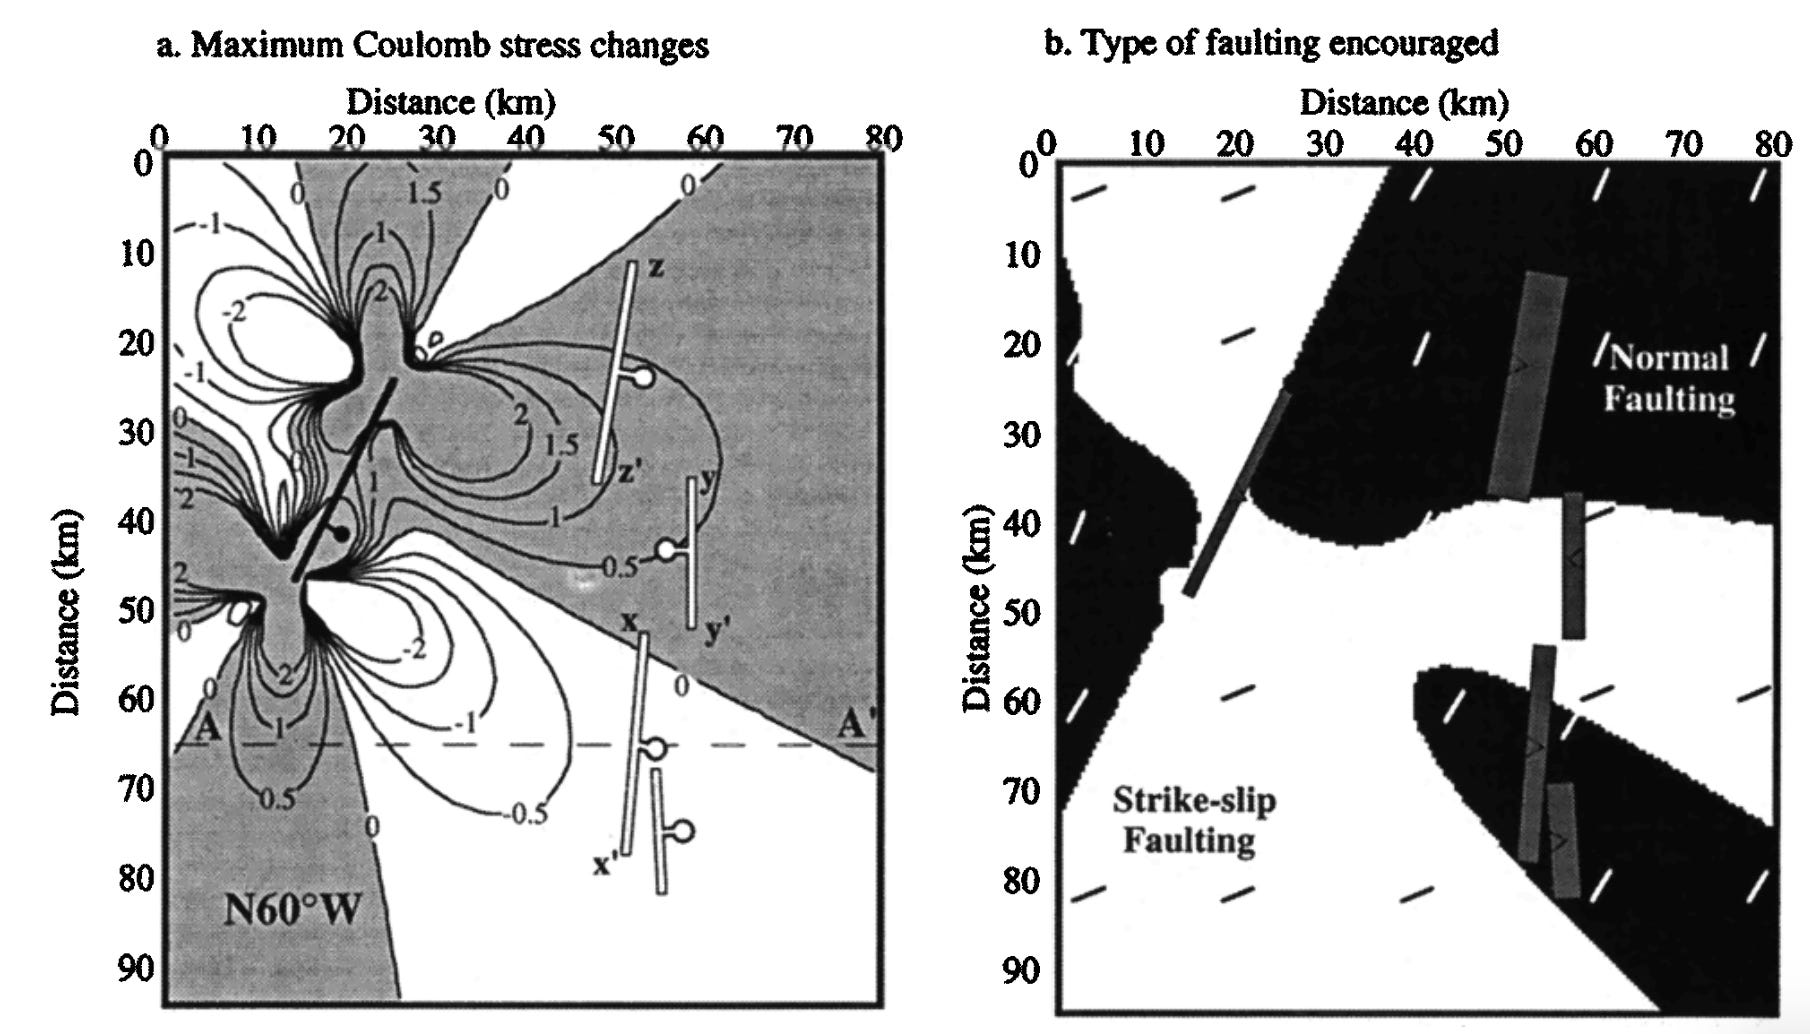
A study in 1996 looked at how each successive rupture might have changed the stress on the other faults in the area, and found that indeed, the stress changes in each case probably encouraged failure of the next fault. The map below shows the stress changes imposed by the slip on the Rainbow Mountain fault. This is a good example of how slip on one fault might trigger slip on another, completely separate fault. However, the mechanisms at play are still quite uncertain, and it is important to remember that there are also many counterexamples to this kind of analysis.
 Figure 10:
 Results from calculating stress changes caused by the Rainbow Mountain earthquake. Source: Figure 6 of Hodgkinson et al. (1996).
Is that similar to what we have just seen with the pair of M5.7s to the west? Maybe. We are just speculating: we don’t have any quantitative estimates of stress change to point to, and the time gap between the 2024 and 2026 earthquakes is longer. Fortunately, the earthquake magnitudes are also smaller. Still, the 1954 sequence is a good reminder that sometimes earthquakes do seem to trigger earthquakes on other, nearby fault systems.
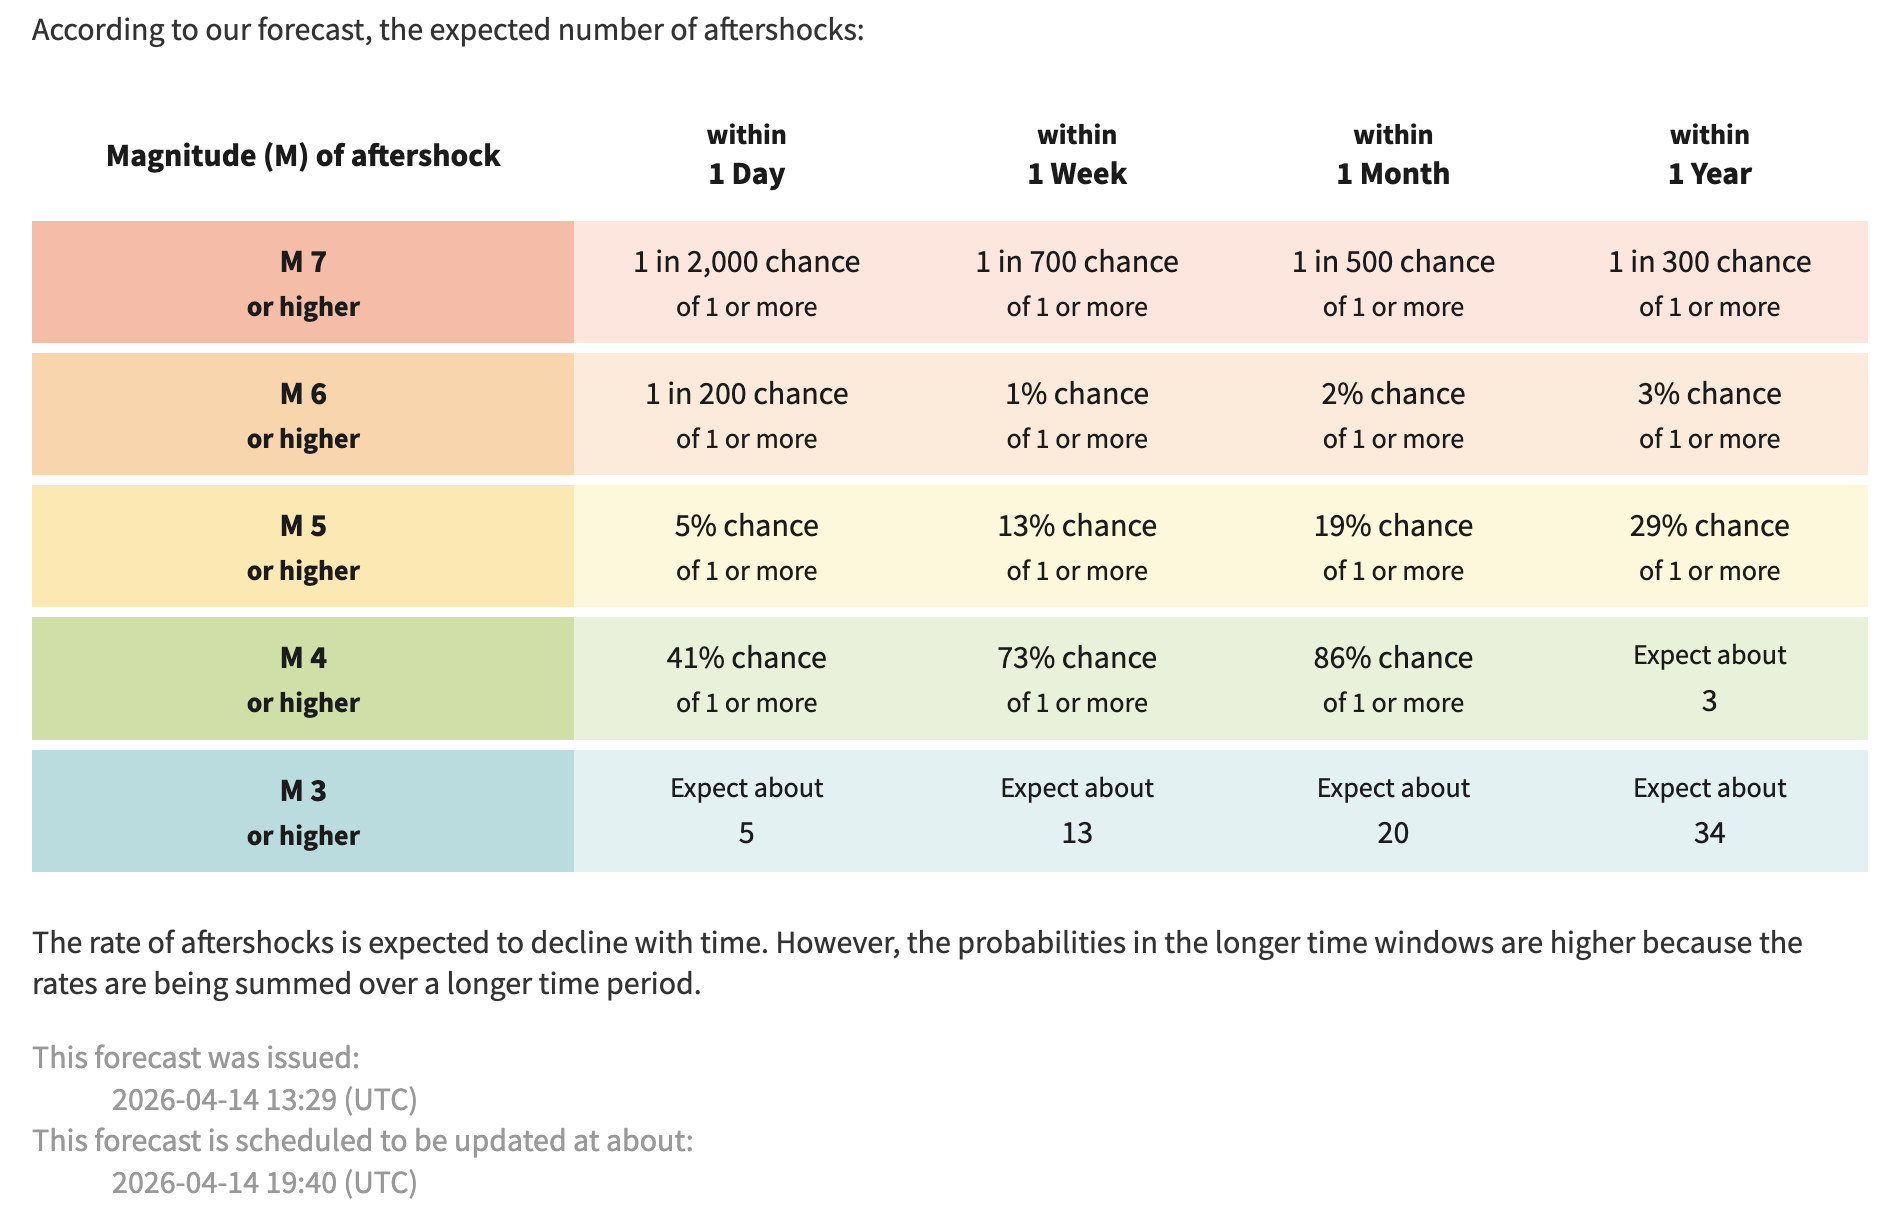
Does that mean that we should expect to see another large earthquake in the coming months? No, although that is always a (minor) possibility. The current USGS aftershock forecast gives a 3% probability that this recent M5.7 will be followed by a larger earthquake within the next week. More broadly, here is the
full forecast:
 Figure 11:
 USGS Aftershock Forecast for the 2026-04-14 M5.7 earthquake. Source:
https://earthquake.usgs.gov/earthquakes/eventpage/nn00914068/oaf/forecast
We note that the December 2024 earthquake also had an
aftershock forecast. The recent M5.7 earthquake actually falls outside of the forecast area from that event. That is unsurprising, because the map of aftershocks show that this M5.7 occurred well outside of the aftershock zone — even if it was triggered (which is still in question), it was not an aftershock.
If you have any additional insight into these earthquakes, or the 1954 sequence, or the U.S. Army’s adventures with camels, please tell us about it in the comments!