Saša said:The thing is the data are not perfect. The same is with the AMS data, people report seeing something and that is then checked. Somewhere and sometime, where and when there is less people, consequently there are less reports and the density of the meteors/fireballs is smaller.
We need to deal with what we have, not expecting something perfect that will be piece of cake to analyze.
For me, there is no problem with IMO data, using some cameras for some time, as long as there is not some systematical bias involved. If the cameras were used randomly, according to weather conditions or whatever, it would produce random effect on the overall statistics. The trend can't be faked if there is no systematical bias. The numbers can be affected, but so strong and apparent trend, no.
I think we should focus on that, the trend, not the exact numbers, and check if there is some bias present over the years that could result in the seen trend. For example, to check the overall observational time over years (like it's written in the article Kaigen posted about), not just nights like I did in that plot. And then the number of observed meteors can be plotted versus the observation time for given year. That (the resulting trend) would not be effected with which camera was used, only possible effect would be at what time of the year they were used since at some times there are expected meteor showers and at some other times there are not. I expect that effect on the overall trend would be rather small.
My question is, is there a way to extract the overall observational time for each year (or month; all cameras together), preferably in hours (h)?
If there is, the resulting data can be presented like a 3D plot (or density plot) obs.time - year - No.meteors, or even better option, IMO, would be to plot the density of observed meteors versus year, i.e. No.meteors/obs.time[h] vs. year. In that way the effect of number of used cameras would be accounted for.
I would suggest doing the same for SonotaCo Network as well, if there is a way to extract the information about observational time from their files.
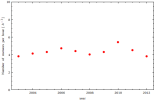
There is indeed a bias toward increase of observational time in IMO Network data.
It seems that the guys in IMO Network have been competing among themselves who would catch more meteors.
In the attached plot, it can be seen the density of observed meteors, which shows just fluctuations over years, which can maybe be attributed to weather conditions in particular year. No clear trend present.
After looking at the table Pashalis sent about SonotaCo data, especially at Tokio1 station data for which SonotaCo wrote it was operational every night, it can be seen that the numbers of observed meteors drastically increased in 2012 with respect to previous years for every camera of that station. Similar thing, that all cameras of a station observed an increase of meteors (although not so large as Tokio 1) happened only with 1 other station (Chiba 2, operated by Aba). It could be that there was really more meteors that year, but it could also be that they had increased their observational time (or some other reason like better weather). The IMO Network data also state that they were operational for every night of the year, but the observational time differed among years. Therefore, I wouldn't consider Japanese data reliable either, only on the basis of operating every night, in the sense of no bias being involved. IMO, proper way would be to check the observed meteor density, like for IMO Network, for all stations and all cameras, regardless when they were active.
As for the AMS data, it was said in another thread that the numbers of reports per confirmed fireball increased
http://cassiopaea.org/forum/index.php/topic,29604.msg471791.html#msg471791
making the straightforward conclusion that the number of fireballs increased, in absolute terms, a bit arguable, since there is no clear evidence what has been the effect of increase of number of reports on the increase of number of fireballs. In other words, it is not clear if there is a bias involved there as well.
Bottom line, as I see it, is that there are more meteors/fireballs observed/reported over the years. However, what is the exact reason for it, it's not so clear (except when the link between the observational time and number of observed meteors is evident). I would be careful with categorically claiming that there are really more and more fireballs in the skies, as not to fall into confirmation bias trap that is not so rare among scientists.
As a side note, I also checked the number of highest energy cosmic rays (reconstructed energy > 1019 eV) observed with 3000 km2 array in 2009-2013 period. No significant change/trend in that time period was observed.


