Pre "Younger Dryas" Map of Earth

Rhys

Jedi Master
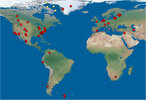
I had a go at creating a map of what the Earth would have looked like just before the Younger Dryas event. It's pretty much based on the information in @Pierre's "Cometary Encounters" book.

I'd love for someone to weigh in and point out anything I have missed. The North Pole has been moved to the Hudson Bay region, I got rid of all the ice around Greenland and Antarctica, and dropped the sea level 65m.

old earth.jpg


I added a grid so you can see the old latitudes (placed at 10 degree increments). It's strange to see the U.K at the same latitude as Honduras, Scandinavia and the northern coast of Siberia!

old earth grid.jpg
 
It's also interesting that parts of Antarctica would have been the same latitude as Australia and South Africa.

I think one thing that may be missing is the impact of isostatic and eustatic forces due to the melting of the Northern ice shields. According to Randall Carlson these forces may explain the sinking of the Azores plateau at the triple-plate-junction.
 
Interesting video! And one that sends me back to the drawing board! :huh: “Rebound of between 400-1000m” means, essentially, and old world map is anyone’s guess!

I used ETOPO1 bedrock data as a starting point. I’d like to edit the map but it would include a heck of a lot of guesswork as to how these isostatic and eustatic forces would affect the crust obviously. I wish I had more time!
 
Nice idea and project! I‘m wondering, have you taken cartographic science into account in how you approached this? I’m asking because from my very limited understanding of the subject there seem to be certain rules that apply to cartography and the different projection methods in order to represent a sphere into a 2 dimensional map. As far as I understand it, every projection method thus far invented has its drawbacks, including the standard one that is usually employed (including big drawbacks). Years ago some japanese people claimed to have „invented“ (or rather employed) are far more accurate projection method, which still has some drawbacks though. I wrote about it here:

Cartography Revolution: Most Accurate World Map: How The World Really Looks

 
@Cosmos thats a really elegant solution! I like how he tessellates the map and can then "dissect" a projection that suits his purposes!

I have taken cartographic science into account as much as I am able to. The dataset I used to build the map is just binary data that you can play with. I found a visual basic program that was able to "rotate" the coordinates of the data. I picked the Mercator projection because it's the most familiar to people, but it distorts both shape and area around the poles which is frustrating.

I have just made a "Hammer" projection of Eurasia and the Americas. I'm having trouble uploading the image at present through! Its an equal area projection and it reduces distortion in many areas compared to other projections (it looks nice, too!).

Watch this space :lol:
 
Wondering about Lemuria, supposedly West of South America. Nice to see Doggerland. Interesting that the Andaman Islands were isolated even then. Native legend apparently correct about Tasmania being joined to Australia long ago.
 
Hey @Rhys

I stumbled upon your thread, which is of interest to me right now! Thank you for your research!

I was looking for an illustration of the planet before the big comets hit.

May I ask, please: your post is from 2022; since then, did you find additional/different data? Can we stick with this map, today, or have there been new inputs? Thank you :thup:
 

Attachments

  • map.jpg
    map.jpg
    100.2 KB · Views: 7
Hi @palestine 🙂 as fun as it was to make, it was ultimately a best-guess and unfortunately, it wasn’t as straightforward as I’d have hoped!

If you watch the video that axj refers to (about isostatic and eustatic forces), there were likely to be massive crustal rebounds of hundreds of metres, which would completely redraw the map… it’s almost impossible to assess, because a change of 10 metres would change the boundaries quite a bit, and 100 metres? You are pretty much remaking the continents.

…These same forces would probably have their part to play if the crust slips.
I understand this. But I think that your approach is good.

You know - before you there was nothing. Except for the pictures in the book cometary encounters, there is no reference (or at least trust-able ones)!

When you gather the elements, according to what the book says, and that you try to lay down something, it's a starting point. It produces something and this constitutes a huge step. To formulate what I am saying better: Pierre provides a couple of hints > you take those in consideration > you built a model. I believe that even if this is a gross representation, it's not flawed. Well - it "may not be that flawed"... You know best. But I believe that the big parameters have been taken in consideration.

I greatly appreciated to see a map. I am studying the whole Odyssey topic, which says that it depicts the world, when the map changed. I do believe that one day or another, we (or somebody else) will walk the road that you did, and that "the map" will be built. I believe that this is a pre-requisite for knowing who we are and where we come from, simply put.

For instance, I see that Richard Firestone is currently mapping the locations of cometary impacts. And what he needs is in fact "the old map", because the current map of the world, with his red points, relate to a different mass scattering. The points that he shows are locations where residues of comets are found. So, he must locate his points on the ancient map. I would start with your map, and place the dots on it.

Thank you!
 
Back
Top Bottom