Schumann Resonance

There was a huge spike in the Schumann Resonance today, apparently peaking at a new record high:


The line on top is today:

last-marconi-multistrip-slow.jpg

last-geomar.jpg


I don't know about others, but I feel surprisingly peaceful today - especially after last week. Don't know if this could be related.
 
That signal does not resemble the Schumann resonance or seem to be related to it. The Schumann resonance is like a bell ringing at multiple tones related to the earth's geometry. The spike does not show any signs of such geometry.

The webpage the chart comes from states:

As the receiving station is placed not too far from an industrial area, sometimes strong tones are detected by geophone sensor, caused by mechanical machine (1 km far from here).
 
As the receiving station is placed not too far from an industrial area, sometimes strong tones are detected by geophone sensor, caused by mechanical machine (1 km far from here).

The spike is not just in the geophone data, but also in the electric field measurements with other instruments.

The upper band is the geophone data and the lower band is the electric field data:

last-geomar.jpg


This overview shows that the massive spike was measured by all instruments and the biggest change was detected by the electric field instruments (ELF/ULF) and not by the geophone which spiked just a little:

last-plotted.jpg
 
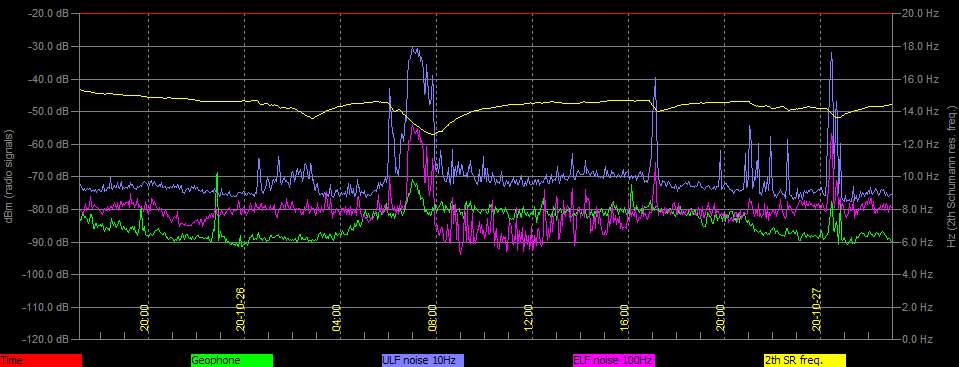
So then there was an EM disturbance, which is interesting, but I wouldn't be so eager to connect it with the Schumann resonance just because it appears on the same chart.

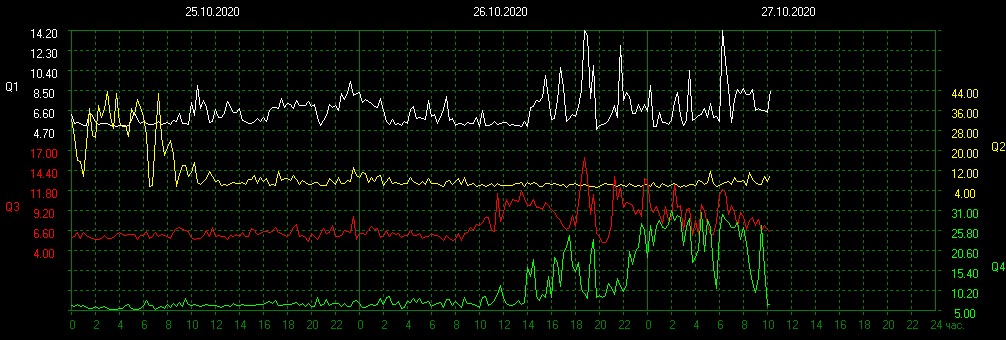
Can we take the Q chart reading to mean that the spike actually had energy concentrated around the Schumann frequencies and that the same readings could not have just been a result of a wideband disturbance?
 
I don't know. What is a good place to look up wideband disturbances of the last few days?
 
Back
Top Bottom