Sol (Sun) and its phenomena

According to this update, the last storm was one of the longest one of the current SC25:


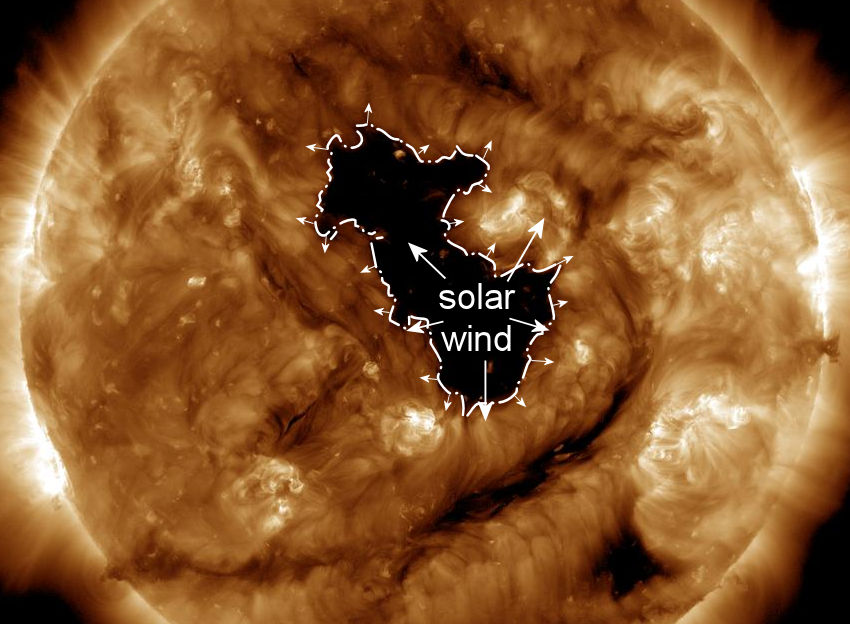
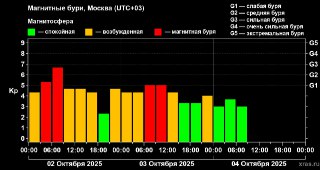
The last storm became one of the longest in the current 25th solar cycle. The magnetic field was thrown out of balance on the evening of September 29, Monday, as a result of a significant increase in solar activity. On the morning of September 30, the event passed through peak values above the G3 level. The average storm level over the past days was G1-G2 (moderate level). In total, the Earth's magnetic field was in a disturbed state for about 4 days. On the night of September 29-30 and from September 30 to October 01, intense auroras were observed, including over the European part of the country. The main part of the reports came from the north-western regions (St. Petersburg, Leningrad Region, Karelia, Murmansk, Arkhangelsk). In general, the lower boundary of the polar oval descended to latitudes of 54-56 degrees. On the last day of autumn, the polar oval was also observed in the Moscow region. Currently, there is a decrease in activity on the Sun, which, in fact, eliminates the possibility of a systemic return of the Earth's magnetic field to an outraged state, although for another 2-3 days there are small probabilities of individual strong flares and one-time impacts on the Earth. The last such event, a large plasma outburst that occurred yesterday, is estimated to have very low velocities and does not have sufficient energy to bring the magnetosphere out of balance. Its arrival to Earth is expected on October 8 without geomagnetic consequences. It should be noted that the long-term forecast for October remains significantly tense. The overall activity of the Sun has noticeably increased compared to the summer period, and long breaks of 2-3 weeks, which were observed, for example, in July and August, are unlikely to be possible now. However, at the moment, the current reserves of Solar flare energy look almost completely exhausted. It should take some time to replenish them.
 
According to this update, the last storm was one of the longest one of the current SC25:

Here is the latest from Stepan Burn. It look like more are coming

Three waves of plasma are racing towards Earth and will hit Earth during the Full Moon, a period of time when there is already greater energy flux here on Earth. Meanwhile earthquakes keep rumbling near high-risk zones, the latest being a magnitude 6.0 earthquake off the eastern coast of Japan. Geophysicist Stefan Burns reports.


''Unfortunately"" because of the shut down in the US, mars satellite could not be accessed during the closest approach of 3I/Atlas to Mars. Hum, I smell a fish. Hopefully European satellites may provide some info.
 
''Unfortunately"" because of the shut down in the US, mars satellite could not be accessed during the closest approach of 3I/Atlas to Mars. Hum, I smell a fish. Hopefully European satellites may provide some info.
ESA promised to keep a close look, but they didn't do a live update.


This is the update link, which of course, hasn't been updated:

 
Here is the latest from Stepan Burn. It look like more are coming

Three waves of plasma are racing towards Earth and will hit Earth during the Full Moon, a period of time when there is already greater energy flux here on Earth. Meanwhile earthquakes keep rumbling near high-risk zones, the latest being a magnitude 6.0 earthquake off the eastern coast of Japan. Geophysicist Stefan Burns reports.


''Unfortunately"" because of the shut down in the US, mars satellite could not be accessed during the closest approach of 3I/Atlas to Mars. Hum, I smell a fish. Hopefully European satellites may provide some info.
might be a reason for my headache and ringing in ears- the comments below this video are interesting regarding peoples reactions to this ;)
 
Here is the summary of Stefan Burns video "Comet C/2025 R2 (SWAN)" posted September 30.

Geophysicist Stefan Burns details a significant celestial event involving Comet C2025 R2-Swan and solar activity. Here are the most enlightening essentials:

## Key Events & Connections
- Comet C2025 R2-Swan experienced a dramatic outburst on September 26th, making it significantly brighter than expected
- Just days later (September 28th), a powerful 6.4 M-class solar flare occurred (the strongest in months since June 19th)
- The timing is notable: the comet's outburst followed two nova explosions that produced intense X-ray and gamma radiation

## Critical Geometry
- The comet will reach its closest approach to Earth on October 21st at 0.25 astronomical units
- On this same date, interstellar object 3I Atlas will be in "superior conjunction" with the Sun (behind the Sun from Earth's perspective)
- Both objects are closely aligned with the ecliptic plane (the plane of the solar system), where most solar activity occurs

1759701397742.png

## Scientific Significance
- The comet has an unusually large tail (over 2.5 degrees across in the night sky - about 5 times larger than the full moon)
- When comets interact with coronal mass ejections (CMEs), their tails can ripple or disconnect
- This event follows a pattern observed with interstellar object Oumuamua (2017), where perihelion coincided with strong solar flares

## Potential Impacts
- The CME launched by the September 28th flare is expected to hit the comet in the coming days
- October 21st represents a critical period where increased solar activity could trigger significant space weather effects
- The comet's brightness is already increasing (apparent magnitude dropped from 6.5 to 5.7-5.8), potentially becoming visible to the naked eye in October

This scenario demonstrates how celestial objects in the inner solar system can trigger and interact with solar activity, creating a complex electrodynamic circuit that could have significant implications for Earth's space weather environment. The unusual alignment of these objects creates a potentially dynamic period for solar activity through October.
 
There's a study by Arlt and Vaquero on historical sunspots reported in the literature before the telescope was invented. Presumably, they're still going through databases to at least give an idea of the sun's activity throughout known history. Here are some images and excerpts from the study:

brave_screenshot_www.researchgate.net.png
Fig. 2 Early sunspot drawings from naked-eye observations. Left panel: drawing by John of Worcester,
observed in 1128 CE (adapted from Vaquero and Vázquez 2009). Right panel: undated drawing from
Ti¯anyuán Yùlì Xiángyìfù, manuscript 305-257 at Naikaku Bunko, Books of Shoheizaka Gakumonjo, in the
National Archives of Japan [in Chinese], involved in an imperial manual of Chinese astro-omenological
divination compiled in 1424–1425 (adapted from Hayakawa et al. 2017b

The Maunder minimum

As the 17th century progressed, a period of very rare occurrences of sunspots occurred
and lasted into the early 18th century (e.g., Spörer 1889; Maunder 1894; Eddy 1976;
Usoskin et al. 2015). The lowest activity was encountered in the period of 1645–1700
(Vaquero and Trigo 2015) when on average definitely less than one sunspot group per
year was observed
. We need to keep in mind though, that many of the nil reports in the
sunspot group number database by Hoyt and Schatten (1998) are either deduced from
generic statements about long periods or from observations with instruments that
did not allow the detection of sunspots
(cross-staff, quadrant, sextant; see previous
Section). As we will see below, however, there is ample evidence that the Maunder
minimum did not result from a lack of solar observation.
brave_screenshot_www.researchgate.net 2.png
Fig. 12 Time–latitude diagram inferred from sunspot observations during the Maunder minimum. Red
dots were taken from the analysis by Ribes and Nesme-Ribes (1993) based on the manuscripts at Paris
observatory, blue dots are from Neuhäuser et al. (2018), based on letters written and received by Gottfried
Kirch, and yellow dots are from Neuhäuser et al. (2015), based on observations by Peter Becker. Confidence
intervals are not available for the first source. Among Kirch’s spots, two spots allowed for two solutions
each, indicated by broken lines for their confidence intervals. Two open symbols denote latitudes from
Kirch’s manuscripts which were highly uncertain and are given without error margins
brave_screenshot_www.researchgate.net3.png
Fig. 13 Coverage of decades by days with observations, adapted from Vaquero et al. (2016). The numbers
include all sunspot observations, also the ones without drawings, and zero-spot detections
This one is particularly interesting, depicting how bizarre was the Maunder Minimum:

FireShot Capture 254 - (PDF) Historical sunspot records - www.researchgate.net.png
Fig. 27 Composite time-latitude diagram (butterfly diagram) of sunspot positions from Harriot
(Vokhmyanin et al., submitted), Galileo (Vokhmyanin and Zolotova 2018b), Gassendi (Vokhmyanin and
Zolotova 2018a), Scheiner (Arlt et al. 2016), Marcgraf (Vaquero et al. 2011), Hevelius (Carrasco et al.
2019a), observations at Paris Observatory (Vaquero et al. 2015), Kirch (Neuhäuser et al. 2018), Becker
(Neuhäuser et al. 2015), Wargentin (Arlt 2018), Staudacher (Arlt 2009a), Horrebow (Karoff et al. 2019),
Hamilton (Arlt 2009b), Schwabe (Arlt et al. 2013), Spörer (Diercke et al. 2015), and the Royal Greenwich
Observatory (RGO) data set, continued by USAF/NOAA (https://solarscience.msfc.nasa.gov/greenwch.
shtml). In order to be compatible with the RGO data set, sunspot positions were averaged into sunspot
groups for all datasets. Since the quality of sunspots is areas is highly diverse, area information was
neglected for this plot. Groups are counted in time bins of three synodic solar rotations and latitude bins of
1◦. Cycle numbers are given at the top of each panel
 
The geomagnetic field has been at quiet levels for the past 24 hours. Solar wind speed reached a peak of 1124 km/s at 08/2325Z. Total IMF reached 14 nT at 09/0821Z. The maximum southward component of Bz reached -6 nT at 09/1845Z. Electrons greater than 2 MeV at geosynchronous orbit reached a peak level of 5051 pfu.
Spaceweatherlive

The intensity of the interplanetary magnetic field on October 8 exceeded 10 nT, and in the following days, significant climatic and geological phenomena were recorded on Earth. The speed of the solar wind should also be taken into account. The average speed of the solar wind is approximately 400 km/s (kilometers per second). On October 9, it exceeded 1000 km/s, which also tends to influence phenomena such as earthquakes, severe weather, and volcanic eruptions. A solar wind speed exceeding 1000 km/s is considered extremely high.

● Between October 9 and 10, high levels of seismic activity were recorded.​

M 6.0 - 119 km E of Ozernovskiy, Russia
2025-10-09 13:28:44 (UTC)
51.626°N 158.209°E. 57.0 km depth
USGS earthquake alert

M 7.4 - 20 km E of Santiago, Philippines
Time 2025-10-09 19:43:59 (UTC-06:00)
Location 7.265°N 126.755°E
Depth 58.1 km

M 6.0 - 144 km SSE of Lorengau, Papua New Guinea
2025-10-10 02:08:10 (UTC)
3.119°S 147.989°E. 10.0 km depth
USGS earthquake alert

M 6.7 - 23 km ESE of Santiago, Philippines
2025-10-10 11:12:07 (UTC)
7.172°N 126.755°E. 61.2 km depth
USGS earthquake alert

M 7.6 - Drake Passage
2025-10-10 20:29:20 (UTC)
60.174°S 61.967°W. 10.5 km depth
USGS earthquake alert

● Floods, torrential rains Spain, China, Vietnam, Mexico


A STREAM OF SOLAR WIND IS APPROACHING EARTH: A hole has opened in the sun's atmosphere, and it is venting a stream of solar wind directly toward Earth. NASA's Solar Dynamics Observatory photographed the dark chasm on Oct. 9th SpaceWeather

Solar wind flowing from this equatorial coronal hole should reach Earth on Oct. 11-12. Credit: NASA/SDO | more data
 
You all keep this one in mind. Research coming out from South Korea, the U.S. and Russia shows a correlation with geomagnetic storms and the risk of strokes and heart attacks.


The results of a study of the influence of geomagnetic activity on overall mortality in South Korea based on data for 19 years have been published.

A large-scale study of the impact of geomagnetic activity on overall mortality in South Korea has been published and is available. Four researchers, two from Seoul National University and two from the Harvard School of Public Health at Harvard University, published on October 1, 2025 in the journal Science of the Total Environment (https://www.sciencedirect.com/science/article/abs/pii/S0048969725018418 ) (included in the top quartile of Q1 journals) results of the study of the relationship between the Kp geomagnetic index and overall mortality in South Korea, by seasons and causes of death (cardiovascular diseases — CVD, strokes and myocardial infarctions — MI).

More than 4 million deaths were investigated between 2001 and 2019 with a total duration of 19 years
. Data was collected among all ages and genders in 237 administrative districts of South Korea. According to the authors' own estimates, the results showed a significant relationship between an increase in the Cd index and an increase in overall mortality in all seasons, with the greatest effect observed in spring and autumn. Based on the daily values of the Cd index, mortality from cardiovascular diseases increased significantly in all seasons except summer, mortality from stroke - in all seasons except winter, and mortality from MI — only in winter.

The relationship between geomagnetic disturbances and mortality, according to the published data, remained significant even when the daily values of the Cd index were replaced by moving averages and even after adjusting for atmospheric pollution (the PM10 index corresponding to particles suspended in the air up to 10 microns was used to account for it). Seasonal patterns, according to the conclusions made in the work, may be the result of positional changes of the Sun and the Earth during the year. The latter corresponds to modern physical concepts of the solar-terrestrial relationship system, according to which geomagnetic activity increases in spring and autumn near the equinox points (the Russell–Mcferron effect), which coincides with the spring and autumn correlation maxima identified in the work.

The authors called for considering bursts of geomagnetic disturbances as short-term factors of increased mortality risks.The results of the South Korean and American researchers coincide with the conclusions previously announced at a recent joint conference of representatives of the ICI RAS and the Federal State Budgetary Institution "United Hospital with Polyclinic" of the Office of the President of the Russian Federation (ПРЕСС-РЕЛИЗ: итоги конференции "Влияние факторов земной и космической погоды на здоровье человека: наукометрический подход" ), where the same three types were named as the main diseases correlating with geomagnetic activity: cardiovascular diseases, strokes and myocardial infarctions, and as the main agent transmitting the effects of solar activity on the biosphere level., The fluctuations of the Earth's magnetic field and the eddy currents created by them were called.

Last Thursday, September 25, 2025, an extraordinary scientific event of «space» scale took place at the Federal State Budgetary Institution «United Hospital with Clinic» of the Administration of the President of the Russian Federation (FGBU OBP) scientific and practical conference «The influence of terrestrial and space weather factors on human health: a scientometric approach», which brought together within the walls of the OBP leading Russian specialists from the field of solar-terrestrial physics, biophysics, heliobiology, space and traditional medicine, studying this issue.
The topics of the conference touched upon the problems of solar-terrestrial connections, the influence of geomagnetic storms, factors of terrestrial and space weather on human health, their impact on the cardiovascular system, the risks of developing myocardial infarction and stroke, and other relevant topics of interest to practicing doctors.

1-s2.0-S0048969725018418-ga1_lrg.jpg

Even though Earth's magnetosphere offers protection against harmful charged particles in solar wind, it remains highly sensitive to magnetic field fluctuations in the near-Earth space environment (Maghrabi and Kudela, 2019). In particular, the interaction between solar wind and Earth's magnetosphere leads to energy exchanges that are modulated by an approximately 11-year solar cycle, resulting in short-term geomagnetic disturbances (GMD) (Dorman et al., 2008), which are characterized by rapid fluctuations in the geomagnetic field intensity at the surface of Earth, and these GMD are quantified at a global scale using the Kp index (Kauristie et al., 2017; NOAA, 2019).

GMD exhibits a seasonal pattern that is influenced by Earth's orbital position and axial tilt. Notably, during the equinox period of spring (March–April) and autumn (September–October), the Russell-McPherron effect enhances the coupling efficiency between solar wind and Earth's magnetosphere (Russell and McPherron, 1973; Lyatsky et al., 2001), leading to more frequent and intense GMD. It has also been reported that GMD are not confined to high-latitude regions; they can also extend to mid-latitude regions, including East Asian countries, such as South Korea (Mengist, 2019).

Recently, there has been growing interest in the potential health impacts of GMD, particularly its association with cardiovascular disease (CVD) (Gurfinkel' et al., 1998; Dimitrova et al., 2009; Zilli Vieira et al., 2019). The cardiovascular system, which comprises conductive tissues and electrically active cardiac cells, is vulnerable to external electromagnetic fields (Jeong et al., 2005; Wu et al., 2016). It has also been suggested that the autonomic nervous system, melatonin secretion from the pineal gland, and heart rate variability (HRV) are sensitive to external changes in electromagnetic field intensity (Palmer et al., 2006; Anand et al., 2022; Zilli Vieira et al., 2022; Zilli Vieira et al., 2023).

Epidemiological studies have identified significant associations between GMD and increased risks of total and cardiovascular mortality, with some studies suggesting correlations with specific outcomes, such as stroke and myocardial infarction (MI), particularly in Western countries (Stoupel et al., 2011; Feigin et al., 2014; Caswell et al., 2016; Zilli Vieira et al., 2019). Additionally, GMD-related health outcomes are not only influenced by the magnitude of the GMD. They are also influenced by the duration of exposure and the moving averages (MAs) of GMD (Anand et al., 2022; Schiff et al., 2022). These previous studies suggest that the health impacts of GMD may appear immediately after GMD exposure or may be delayed owing to differences in cumulative exposure duration or physiological lag effects. Therefore, there is a need for analytical approaches that incorporate such temporal dimensions.
 
Back
Top Bottom