The Ice Age Cometh! Forget Global Warming!

A look to the Farmer's Almanac - U.S. long range 2025/2026 winter:


The Farmer's Almanac has issued its long-range forecast for the upcoming Western Hemispheric winter, calling for cold and snowy conditions across large swaths of the Lower 48. While the two-century-old publication touts an 80% accuracy rate, independent analysis places that figure around 55%.

The forecast, which dates back to 1818 and accounts for environmental fluctuations on Earth, solar activity (sunspots), the motion of the Moon, and other proprietary factors, calls for "widespread wintry weather" in the 2025–26 winter season.

Here's a breakdown of the forecast:

Cold Zones:

  • Coldest: Northern Plains to New England, plus Northwest (Idaho, Washington).
  • Major cold snaps expected mid-January and mid-February.
Snow Outlook:

  • New England: Frequent snowstorms.
  • Atlantic Coast: Significant rain, occasional snow mix.
  • Mid-Atlantic Mountains: Decent snow events.
  • Great Lakes, Ohio Valley, North Central: Classic snow-heavy winter.
  • Pacific Northwest Mountains: Impressive snow totals.
Regional Highlights:

  • Southeast: Average temps, wet;
  • Appalachians see occasional snow.
  • Texas/Southern Plains: Wetter than average, periodic cold snaps, limited snow but freezing rain possible.
  • Southwest: Wet winter, near-average temps.


For North of the 39th based on what can be seen in the south, thought it would be a certain thing, yet this is from the 'Old' Farmers Almanac:


1756269858471.png

This winter’s forecast? Mostly wet and mild, but Canadians should still brace for snowy stretches, chilly snaps, and the occasional polar surprise.

The 2026 Long-Range Predictions for Canada​

A Wet​

Winter 2026 promises a season of contrasts. While much of Canada will see milder-than-average temperatures and frequent precipitation, some regions will still experience classic Canadian snowfalls and cold snaps. Here’s the big-picture outlook:

  • Mild Temperatures: Winter will be milder than average across most of Canada, though southeastern Ontario may experience below-normal temperatures. Remember, “mild” is relative—plan and dress accordingly.
  • A Wet Winter: Above-normal precipitation is expected from Atlantic Canada through Nunavut, southern Quebec and western Ontario, the southern Prairies, southern Yukon, and extreme southern British Columbia. Other regions should expect near- to below-normal precipitation.
  • Snowfall: Above-normal snow is forecast from Atlantic Canada through northern Quebec and Nunavut, western Ontario, and the northwestern Prairies into southern Yukon.
  • Mixed Weather: In areas like southern Quebec, precipitation will be above normal—but much of it may fall as rain or mixed events, keeping snow totals lower than usual.
Bottom line: Even a “mild” Canadian winter brings snowy stretches and cold snaps. Layer up, plan ahead, and keep your shovel handy!

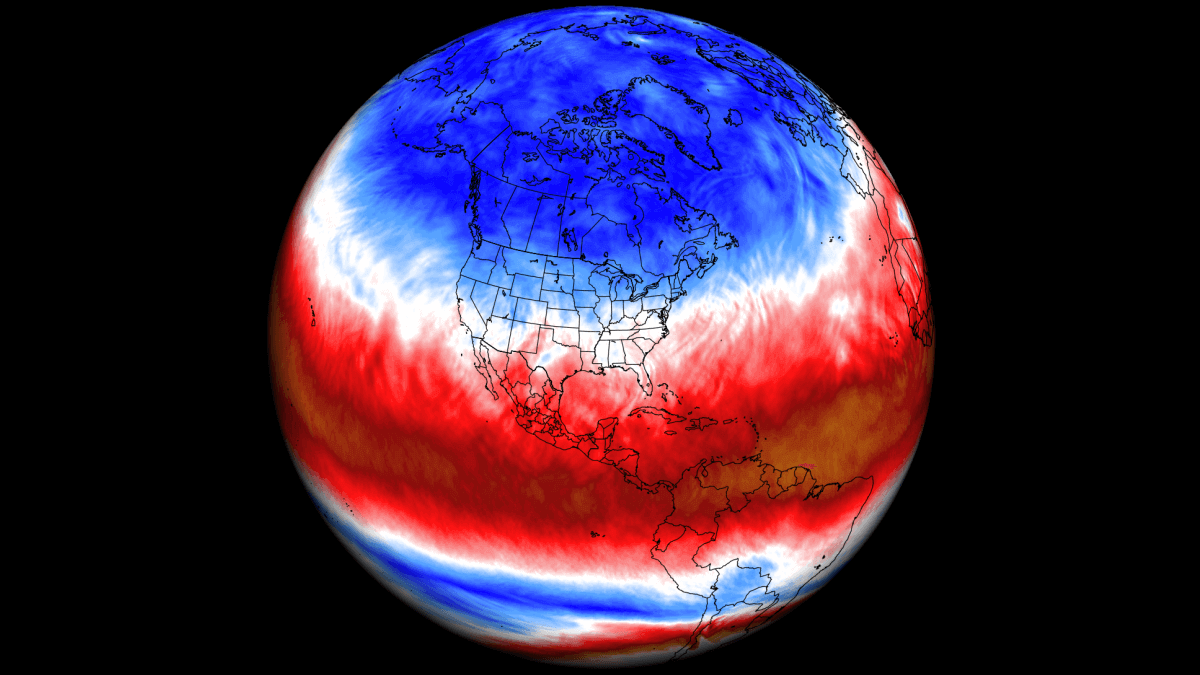
There is also a more modern science version that looks to the influence of Quasi-Biannial Oscillation (HIGH ATMOSPHERIC WIND ANOMALY) for the U.S., Canada and Europe:
...The QBO is a regular variation of the winds high above the tropical Stratosphere, shifting between easterly and westerly (zonal) winds. Strong winds in the stratosphere travel in a belt around the planet at the equator. And around every 17 months, these winds completely change direction.

Below is a graph that shows the zonal wind anomalies for the past 50 years at around 24km/15mi altitude over the Equator. It nicely shows just how regularly this wind shift really is. It is like watching the heart pulse of the atmosphere, which is an often-used analogy for the QBO due to how regular it is.

qbo-winter-phase-50-year-anomaly-graph-atmospheric-circulation-polar-vortex-stratosphere


The wind reversal of the Quasi-Biennial Oscillation (QBO) happens because of how atmospheric waves (energy and momentum) from the tropics interact with the stratosphere above. You could say that the QBO is a self-regulating system, but each phase interacts with the whole global weather system...

Europe seems to have its own almanac form - country by country, like this for the Netherlands:

 
Last Sunday, 24th August, exceptional early frost in the Netherlands was measured well over a month earlier than usual! In the southern city of Eindhoven the weather station measured -0.3C. One mainstream media outlet (NOS) reports it as coincidental, though admits it is exceptional.

The comments under the X-post of NOS make it absolutely clear no one is buying this global warming scaremongering anymore. And it seems Holland is not well prepared for a cold winter, with gas storage only at barely 63% (presently, 95% of Dutch households use gas to cook, for central heating and to shower):

 
Greenland Ice Sheet update, 2024-2025
Just as year ago, there was on page 172:
Greenland ice sheet update, 2023-2024 season:
Here we go again with the usual good news for the Polar Bears:

The first image shows several events that dumped liberal amounts of snow. These are indicated by the upper spikes:
Greenland Surface Mass Balance 2024-09-01 155113.png

Areas closer to the ice sheet have in many area, except parts of Eastern Greenland, received more compared to the last season:
SMB_combine_SM_acc_EN.png

As you can read from the chart above, the develpment of the gains and losses have been close to normal., though April to May were on the dry side.

This year has seen a melt season, where large areas were above zero at the same time, but the season began and ended very abruptly, compare early June with late August. This graph, like the following, follows the calendar year:

Greenland melt extent 2024-09-01 155302.png

The sea ice has followed other recent year being on the low side of the average, indicating overall warm water. The ice sheet mass balance is closer to normal, than the extent of the sea ice.
SICE_curve_extent_LA_EN_20240825.png

The sea ice extent reaches its minimum around the middle of September. If one looks to the following map of the current ice conditions, notice the ice above Eastern Siberia. I don't know if this will affect the passage of ships in September-October. They might need a Russian icebreaker to make sure they will get through, but this is probably quite normal.

SICE_map_extent_LA_EN_20240825.png
Since last year, Polare Portal renewed their website, and there are minor changes. The following information about the the Ice Sheet in Greenland is from their page about Surface Conditions.

First we have the Surface Mass Balance, SMB, which is the difference between snowfall and runoff. During June, July, August it is negative and the rest of the year positive, taken together there is more gain than loss. This graph does however not include all losses:
The surface mass balance is not identical to the total mass balance (i.e. overall gain or loss of the ice cap), which also includes the mass that is lost when glaciers calve off icebergs, the melting of glacier tongues as they come into contact with warm seawater and frictional and other effects at the bottom of the ice sheet.
surface (2).png
The second SMB chart above shows the overall changes over the year. The first six months from Sep 2024- February 2025 contributed less to the overall gains this year than the last six months.

Compare the recent season (left), with the map from last year, (right).
surface (1).pngSMB_combine_SM_acc_EN.png
This year there have been above average gains. The largest change is in northern Greenland, whereas southern Greenland had fewer gains. On the whole, the areas with gains are less patchy than last year.

Arctic Sea Ice​

Polar portal had to make some changes in there sea ice reporting.
PLEASE NOTE: Data source for sea ice concentration and extent has changed.

Until 1 July 2025, data for sea ice concentration and sea ice extent data on the Polar Portal was derived from the Special Sensor Microwave Imager/Sounder (SSMIS).

After the US Department of Defense (DoD) announced that the Defense Meteorological Satellite Program (DMSP) will cease processing of all of their data products on 31 July 2025, including the SSMIS sounders, which have provided continuous data since July 1987, we have worked on replacing the data source for our sea ice concentration and extent products.

Beginning 1 July 2025, data from the Japanese AMSR2 instrument is providing the input to our sea ice concentration and sea ice extent products on the Polar Portal.

The microwave sounders are not identical. Generally, SSMIS and AMSR2 differ by ±0.1 million km² or less. Differences are largest in summer because of melt and rapidly changing ice edge locations.
The map of the Arctic shows less sea ice above northeastern Siberia, compared to last year. There is a little more sea ice close to northern Greenland
sea (2).png
The Arctic Sea Ice Extent varies a little from year to year. At the moment it does not appear the sea ice extent will be quite as low as it was last year.
sea (1).png
Polar Portal writes about their data representation:
The map shows the sea ice extent in the Northern Hemisphere. It is updated on a daily basis.

In order to get a true picture of the state of the sea ice, it is necessary to determine its extent, thickness and volume.

The graph shows the annual variation in the extent of the sea ice in the Northern Hemisphere. The extent of the sea ice is defined by areas that have an ice concentration of at least 15%, i.e. 15% of the surface is covered by ice.

The grey band around the climatological mean value corresponds to plus/minus one standard deviation.

The extent of the ice is based on satellite data and are from the Ocean and Sea Ice, Satellite Application Facility project (OSISAF).
To put the above report in perspective, ten years ago the Science News Explores wrote: Arctic Sea could be ice-free by 2050
Summer sea ice could soon be gone due to humanity’s large carbon dioxide output
And Calandar-canada.ca referring to a report from 2021.
How much ice will melt by 2050?
Sea ice changes are a mechanism for polar amplification. The IPCC Sixth Assessment Report (2021) stated that Arctic sea ice area will likely drop below 1 million km2 in at least some Septembers before 2050.
Maybe a consolation for those waiting for the ice to disappear by 2050, is that although that did not happen, something even more hard to imagine will have happened, as it usually does. Were not the people living in 1925 surprised by what had happened when they came to 1950?
 
Back
Top Bottom