For months, meteorologists have been observing
significant changes in the upper atmosphere. At the center of attention is the polar vortex, a key element of winter stability. Normally, it keeps the coldest air concentrated over the Arctic.
But current large-scale atmospheric patterns suggest a marked weakening.
"An unstable polar vortex is always a warning sign," meteorologists emphasize. February is considered a particularly sensitive period, as disturbances then more frequently influence weather conditions near the ground. If the balance shifts,
a normal end to winter can very quickly turn into a period of extreme cold.
The possible tipping point
The situation becomes particularly critical
in the event of sudden stratospheric warming. Within a few days, temperatures rise sharply at altitude, destabilizing the polar vortex, or even splitting it. "The jet stream then loses its organization," warn meteorologists.
The normally dominant westerly flow collapses, while blocking high-pressure systems take over. These blocking patterns act like an atmospheric dam, preventing mild Atlantic air from reaching Europe. Instead, a direct transport corridor for cold Arctic air opens.
Germany in the heart of the cold
When Central Europe comes under the influence of such weather patterns, Germany quickly finds itself at the heart of the cold. North to easterly flows bring dry, very cold continental air.
Temperatures can remain below zero for several days, with nights reaching double negative temperatures quite possible.
The snow would barely melt and would only intensify the cold. Cities, transport systems, and energy supplies would then quickly reach their limits, while the weather situation would change very little for weeks.
Lessons from meteorological history
A look at the past shows that extreme Februarys are not anomalies. Episodes like those of 1956, 1985, and 2012 followed similar patterns.
There too, a weakened polar vortex and blocked westerly circulations played a key role.
Ice age in February 2026? The signs are becoming more pronounced.
The difference with today lies in the greater vulnerability of modern societies. A prolonged and persistent freeze clashes with high energy demand, sensitive infrastructure, and global supply chains with very little room for maneuver.
What is the probability of a nightmarish winter?
Despite all the warning signs, meteorologists are urging caution.
A collapse of the polar vortex does not guarantee a record-breaking February. Slight shifts in the jet stream are enough to determine whether the coldest air reaches Germany or remains further east. More likely than a single extreme record is a succession of intense cold waves, following one another over several weeks and offering little respite.
A February with strong symbolic significance
February 2026 has the potential to be remembered as a nightmarish winter month. If the polar vortex were to shift, exceptional cold, snow, and prolonged frost would threaten. Nothing is certain yet, but the conditions are ripe.
"The atmosphere is tense," explain meteorologists. For Germany, this means one thing:
winter is far from over.


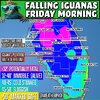
 I’m also starting to get very concerned about LIFE THREATENING Cold later this week.
 With fresh snow on the ground, clear skies, and a strong High Pressure system crashing into the U.S., I could see this happening. All of those factors above will help aid in dropping temperatures BIG TIME.
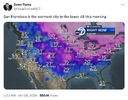
 Over the next week, many locations across the US will fall into the teens, single digits, and even below zero, with the cold lingerie for days, not hours.
 Wind chills will be even worse, potentially plunging to -30°F, with the coldest period likely Friday into Saturday, when wind chills near -40°F are possible.
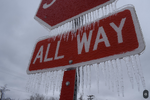
 This kind of Cold can be dangerous or even Life threatening if you are exposed too long. Protect people, pets, pipes, and property. Open cabinets, let faucets drip, and limit time outside.