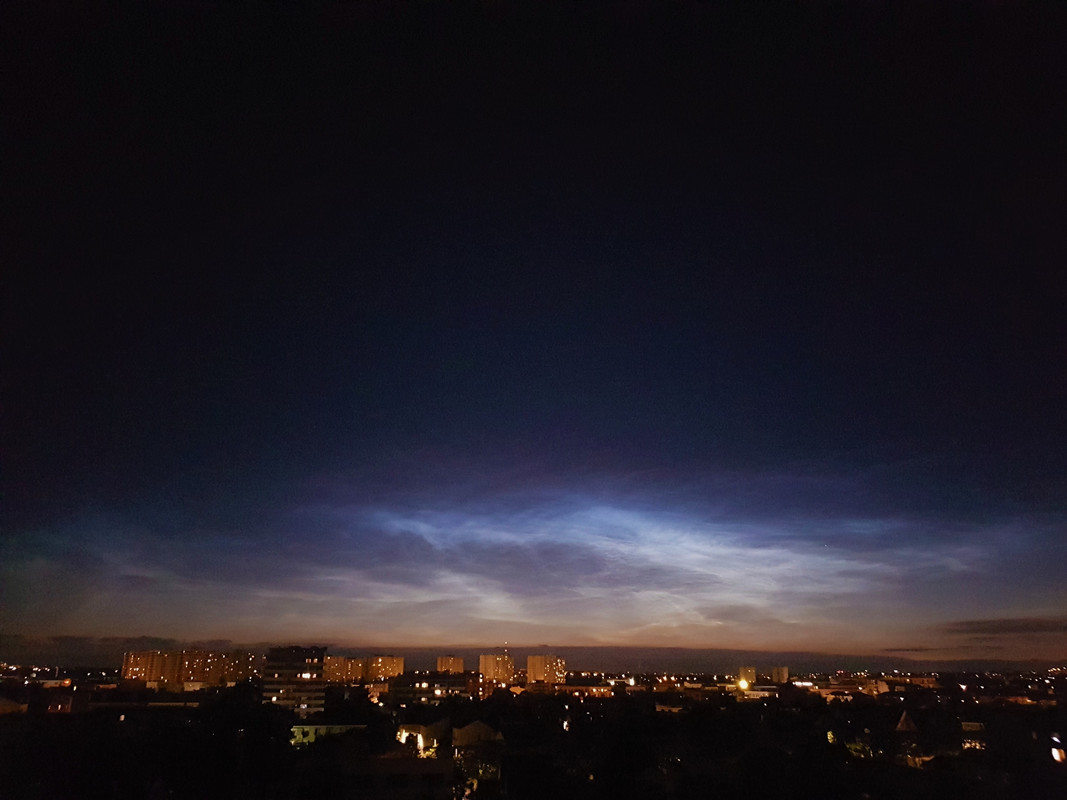
Rare mid-June snow in Iceland, so heavy in places that tourists had to be rescued after finding themselves trapped, and of which “The origin can be traced to the
inflow of freezing Arctic air from Canada east to the Atlantic Ocean.”
Normally, June is the month with least precipitation in Iceland,
and snow is rare, says Sveinbjörnsson, meteorologist. He continued, writing on his
daily weather blog: “One has been able to observe the
formation of a more severe type of Arctic depression, but what also makes it special is its location, i.e. how southern it is.
And looking further ahead, Sveinbjörnsson has said the
following week (so from 28 June–5 July) will be cold across Iceland, Scandinavia and also mainland Europe.
This appears to be backed up by the latest GFS 2m Temperature Anomaly run (shown below), which sees an Arctic trough riding anomalously-far south on the back of a weak and wavy ‘meridional’ jet stream flow:
Much of Europe is set to suffer a late-June chill [
tropicaltidbits.com].

In Portugal,
temperature departures 16C below the seasonal average are predicted for June 17 (although the
local paper indicates only 10 degrees C and has given weather warnings for hail, thunderstorms, rain and sharp temp drops):

GFS 2m Temp Anomalies for June 17 [
tropicaltidbits.com]
"What makes this Arctic depression so special is how southern it is" -- meteorologist Einar Sveinbjörnsson.

electroverse.net
Laurs
how and where can I find those charts you showed ? I went to [
tropicaltidbits.com] but I can't find these
GFS 2m Temp anomalies charts you show in your entry with two illustrations. I often go to wetterzentrale.de - which has almost everything, but not GFS 2m Temp anomalies, only for the 850 hPa level (which is a map, showing temperatures at around 1.5 km up in the atmosphere)
I also couldn't find substance in the claim (whomever made it) of 16°
C lower than normal temperatures over Portugal... because that is far too extreme I already thought of yesterday, when i read it... Perhaps in an ice age that would likely happen, yes.
Lisbon maybe has a normal Max of 24-25°C (I am guessing here) this time of the year. But going 16°C below that - would result into a temperature of only 8-10°C. That doesn't feel realistic.
As of now, 17 June 2021 15.00, it is
• 20°C. in Lisbon
• 17°C. in Porto
• 23°C in the south of Portugal
• It is a bit chilly in North Portugal as well North Spain (16-20°C), there are plenty of clouds in the area, due to a shallow but thunderstorm active cyclone. The airmass there is maritime chilly (but not 'cold' in any way). So, that extreme temperature anomaly chart over Spain/Portugal (17 Jun) really feels off to me.
And please don't get me wrong Laurs, I mean it humble.
I do like to be observant when it comes to weather - as well when it comes to the occasional traps and blindspots connected to weather projections and claims. Sometimes it happens that predictions are too good (or too bad) to be true. Generally they are doing a good job dependent how you look at it - but sometimes, it is really over the top. To reach 16°C lower than normal temperatures - is not so common during summer (more common in winter, and dependent where you live) Otherwise, it still requires many unusual factors coming together in order to accomplish such extreme anomalies.
Different Example: Canaries 
I remember one time when the main stream media claimed that temperatures up to 50°C would be reached in the Canaries, due to that African hot air sometimes flows over the water reaching the islands (Such flow patterns do happen there, a few times every year)
I immediately felt "but...50°C (122°F)... that's nonsense, is it not ? (My ego of course loved the extreme headlines, the "emotional kick of excitement" from extreme weather events. You know ... boyz and their toyz!

So, I went on and checked things out - how much was real ? I found that the temperatures in the Canaries went up to generally 30-34°C - which for them is pretty hot (normal max is often just 25°). One station reported the highest of all - which was 39°C in Fuerteventura or Landzarote I don't remember which, bit being closer to the African continent than the others.
Well 39°C (102°F) ain't 50°C (122°F) ... So, most other places had even lower temperatures than !
GFS longer prognosis
When it comes to the GFS
longer prognosis - oh boy, those are notoriously unreliable, as soon you go beyond day 5. The longer, the worse it get's. But hey - they are both interesting and pretty.
As you arrive at day 8 to 15 - they are utterly useless. On top, the predictions change every 6 hours, when you compare at the end of period - the are radically different. I have absolutely no confidence in medium range "weather" prognosis beyond day 5 or 6 (or so). They
may indicate a possible change in large scale patterns - but nothing more at best. As soon you go into the finer details - it all get's thrown off, making it unreliable.
It is of course mesmerizing, all those beautiful detailed charts... I can easily caught in it, I have to be honest ! But they remain in essence, just pretty illustrations if I look at the prognosis on day 10. Sometimes I get annoyed that i spend too much time on 'weather', that does not even exist other than in colorful illustrations, while studying all those charts (Ah, expectations !)
Some areas in Europe easier to predict than others. Local weather patterns and typical geographic characteristics are a huge factor ! I find it for example very difficult to predict the weather in Sicily. I still haven't gotten the hang of it after 6 years. Much more complicated and differentiated than in Stockholm.
In Scandinavia, we sometimes get cyclones form unusual directions - and dependend of where you live within an area of let's say 400 km - and where exactly the front or cyclone is "expected" to go - but then decides to be off 100 km - it can be the difference between sunny warm weather - or dull cold and rainy. Apparently certain cyclone types, are more difficult and erratic to make predictions on. The ones that start spinning up, coming in from Poland going northwards towards to Sweden, are notoriously unreliable to pinpoint. Cyclones that comes in from the Atlantic, are much easier.
When I write about weather predictions on my homepage -
I always add to the reader - after day 5 - always
take it with grain of salt. Or two.
Yesterday's brainwash
We just had a headline at DN.se yesterday saying "
Extreme heat coming to Sweden 30°C" [86°F] Only that 15-20 years ago, we would never write "extreme" to a heatware with 30°C. We would write "Heat (wave) coming to Sweden, up to 30°C) Not more. No less. Summer is 25°C. Heat is 30°C, but it isn't
extreme in any way.
Happens every year in summer somewhere in Sweden. 35°C [95°F] on the other hand - would likely be considered extreme in our country - because it is a very rare event. We were once close in the past 40 years. I believe you have to go back to Aug 1975, the summer that crushed many older records.
The highest temperature ever measured in Sweden is 38°C. (100.4°F) registered in Ultuna on 9 Juli 1933, and in Målilla on 29 June 1947.
Mobile Phone Weather apps...
I am also sceptical about all those lovely
weather apps in mobile phones. Most of them do not rely on real observations, but on calculated,
projected predictions. People however believe it is all real weather. Well it isn't. Gradually without realizing, we slip into a pseudo world of make-belief.... but that's not weather
observation.
For general use, sure - they are pretty neat. I just don't like how it gradually, silently allures me to think, it is all real.


 Laurs
Laurs