Near-Earth objects and close calls

The data in Folder "A = Solar System (Moons outer Planets)" hasn't changed since last year. Having said that, scientist announced in 2020 that they possibly have found up 600 New Moons around Jupiter (!) [however: in actuality they have found 45 new moons, with the possibility of up to 600 new moons hiding around Jupiter], all of which are not accounted for (as of yet) in the official government databases on which the graphs and data are based in Folder A. Therefore it could very well be that the data below should/could/will be adjusted somewhere down the line to reflect that. I'm guessing that it needs quite some time to make new moons official parts of the solar system. It could also be that the sheer number of new moons makes them hesitate to even include them officially (because it maybe focuses too much attention to a possible influx of comets/asteroids?).

So keep that in mind. Anyway, here we go.

2020: All Data and Graphs (Moons, NEOs, NEAs, NECs, PHAs, Fireballs etc)

A = Solar System (Moons outer Planets)

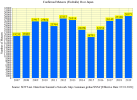
Graph "1 = Moons (10 Year Periods)":

1 = Moons (10 Year Periods).png

Notice how many years are excluded from the graph. In the time span between 1610 and 2019 (410 years), 361 years are not included in the graph above, since in those years no new moon discoveries were being made. See the list after the next Graph for the exact timing of those gabs and in what sequence they occurred.

Now we zoom into the graph above for a yearly breakdown (years with no discoveries excluded here as well). We can see a clearer pattern there.

Graph "1.1 = All known Moons...":

1.1 = All known Moons (Saturn, Uranus, Neptune, Pluto combined).png

Notice that the sharpest increase of new moons started around the year 2000. In the next list the time gabs of no discoveries and the increases are more visible and noticeable. The last graph above is based on that following list.

List "2 = New Moon Discoveries":

Unbenannt.png
 
Short note here: if you compare the following data/graphs with last years database, you will find that there was quite a big upwards jump (or outlier) in the year 2010, that is not present below anymore. One reason for that is that I found out that I grabbed out all the data last year in this folder not at the right point (to best reflect the actual situation in each year). Now that has all been corrected. In addition to that, I'm strongly suspecting (but I'm not sure) that I put in the wrong number for that 2010 year (looked at the wrong column in the data sheet). Shortly though I thought if it would be possible that they smoothed out that spike artificially now in their database (aka: I didn't make that mistake) in order to counteract the "it is because of improved technology" argument. Thinking it through though, I think it is far more likely that I made a mistake there, and they didn't change anything.

2020: All Data and Graphs (Moons, NEOs, NEAs, NECs, PHAs, Fireballs etc)

B = Near Earth Environment: All Near Earth Objects [NEOs = Near Earth Asteroids (NEAs), Near Earth Comets (NECs), Potentially Hazardous Asteroids (PHAs)]

Graph "4 = Total of All NEOs Cumulative":

4 = Total of All NEOs Cumulative.png

The Cumulative Nature of the Graph above (and the official graph "7" below), the high numbers at the end as well as the decade count until 1999 make it harder to see how sharp the increase really was and when it started. It basically hides what is going on since a cumulative graph is always increasing or staying the same but never decreases among other factors!

That's why we focus on just the number of new NEO discoveries for every year/decade in the next graph. In other words: We are not cumulating the numbers like in the last graph above and thus make what happened better visible. Thereby things appear which we can't see in cumulative graphs. We can see a clearer pattern there. And low and behold: 2020 is again an all-time record year with almost 3000 new NEO discoveries! And again, around the year 2000, it started to increase dramatically: As everything in this folder B is!

Notice
that until 1999 they counted all new discoveries in decades! That applies to all data and graphs in this Folder B! For example: From 1979 till 1989 (10 years period) they discovered 87 new NEO's. In the year 1999 alone (one year period!) they discovered 753 new NEOs! 2020 they discovered 2949 new NEOs!

Graph "6 = All New NEO Discoveries per Year or Decade":

6 = All New NEO Discoveries per Year or Decade (NEAs and NECs) + in separate Bars = All Discov...png

Next comes a list (with sub lists available in the database) on which all the data in Folder B and in this post are based. Since it is also Cumulative you can pretty much ignore the percentage increases in that list since they don't represent a reliable way to show the real increase (especially from year to year).

List "5 = Sum of All New Discovered Near Earth Objects (NEOs), per Year":

Unbenannt.png

Next comes a graph taken from the NEO website itself. It is also a cumulative graph and thus also hides what is going on and is basically the same as graph "4" above.

Graph "7 = Total of All NEAs Cumulative":


7 = Total of All NEAs Cumulative (Red = bigger 1km, Orange = bigger 140m, Blue means  =Rest).png

Now we again extract the actual new discoveries from the last cumulative graph above to get a clearer better picture. In other words: no cumulating.

Graph "8 = Discovered Near Earth Asteroids (NEAs) bigger 140m or 1km...":

8 = Discovered Near Earth Asteroids (NEAs) bigger 140m or 1km respectively and  Discovered Pot...png

Now we come closer to earth. Last but not least in this section, here comes the graph of the Potentially Hazardous Asteroids (PHAs) alone.

Graph "9 = Total Number of Discovered Potentially Hazardous Asteroids (PHAs)":


9 = Total Number of Discovered Potentially Hazardous Asteroids (PHAs) per Year or Decade.png
 
Now we are coming really close to home. The next main list in this Folder (on which all the info and graphs are based here) gives us fascinating data that can't be found anywhere else: see list "10"below. You can order each column in that list from A -Z or from Z - A. In that way you can discover a lot of interesting stuff, like for example: The first ever discovered Near Earth Object that made a close approach to earth nearer than the moon was discovered in 1991! All close approach dates before that point are theoretical back calculations! In other words: The first ever Near Earth Object that came closer than the moon was discovered in 1991! The total number of those objects is 690 by now (zero in 1990!). In the column "Days Notice" (Column D) you can see at a glance if the object was discovered too late, or before it made the close approach to earth. And much, much more.

All Data and Graphs (Moons, NEOs, NEAs, NECs, PHAs, Fireballs etc)

C = Close Calls nearer than Moon: NEOs approaching Earth less than 1.01 LD (Lunar Distances) = Past, Present, Future

List "10 = ALL Neo Objects closer than Moon":

Short Snapshot of the list, ordered by Date of Discovery:

Unbenannt.png

How to read the above snapshot of list "10" on the example NEO Object "1991 BA" (Column A):

Notice that you can see at one glance to the right on what Date the object was discovered (Column B), on what date the close approach to earth happened or will happen (Column C), at what time that close approach happened or will happen (Column D), that it was discovered on the same day as it was approaching nearest to earth (Column E) [marked in orange: see below], how far away it was at its close approach (Column F) [in this case about 0.44 Lunar distances; or less than half the distance between earth and moon], how big it was in the lowest estimate (Column G) and how big it was in the highest estimate (Column H).

Notice also that everything that is marked in orange in Column E means that all those objects in that column were discovered on the same day as the close approach, or any given number of days after the close approach already happened. So the number 0 in that column means the same day for example and is thus marked orange (0 days warning). Same applies for "-4" (days) for example and every other minus number = it is marked in orange. Conversely, everything not marked orange in that column was discovered before the object made the close approach. So every positive number from "1" (day) upwards is unmarked.

Column A: Every Object that is marked green in this column has a double (or multiple entries) for close approaches: See Object "2003 SW130" in the above screenshot as an example.

Column C: Everything marked with the color green in this Column is a close approach that will happen in the future. Conversely, everything unmarked in that column happened in the past.

Column F has a colour scale = the color deep red marks the closest approaches to earth on one end of the scale while the color white (or rather not marked) is the "farthest away" but still closer than the moon (as everything is in this table and folder).

Column G and H also have a colour scale = the color deep red marks the biggest objects on one end of the scale while the color white (or rather not marked) marks the smallest objects.

Next, another Snapshot of the list, this time ordered by close approach date, so we can take a peek at the future!

Unbenannt.png

Notice the huge chunks coming dangerously close 2028 and 2029. And most important: Notice that we pretty much established by that list now that there is a very good likelihood that a huge amount of big and small objects will slip by earth in the near future that are not on this list yet. Even massive ones. Also notice how many of those objects have come dangerously close to earth out of the blue (no forewarning or very little at the most) especially in 2020. At some future point I'll dive into the data that can be gathered out of this list in more detail. It is all pretty interesting.

Next the graphs based on this list "10".

List/Graph "11 = All NEOs Closer than the Moon:...":

Unbenannt.png


As you can see above, 2020 is another all-time record year with a big spike from last years all-time record! Never have there been so much close approaches. Also notice when it started to increase and compare it with the other data...

2020 is also another all-time record year in terms of newly discovered objects of that kind! See here:


Unbenannt.png

Next: More fun with the data in list "10", and a similar picture! 2020 is another all-time record year also in this department: It sort of represents the total mass of stuff coming each year close to earth, closer than the moon (the overwhelming majority of it out of the blue)! See here:

Unbenannt.png
 
Last edited:
Now we are on earth itself! Note: The 2020 Data for Japan is not published yet (when we are lucky in will be available in March/April). So those two charts/graphs haven't been updated yet (but will be, as soon as the data is available). Other than that: 2020 is another all-time record year! This time in all departments except the number of reports!

All Data and Graphs (Moons, NEOs, NEAs, NECs, PHAs, Fireballs etc)

D = Earth Impact: Fireballs

Graph "12 = USA: Reported vs. Confirmed Fireballs from the American Meteor Society":

12 = USA_ Reported vs. Confirmed Fireballs from the American Meteor Society.png

Next, the same graph without the number of reports. 2020 is an all-time record year in all departments.

Graph "
13 = USA: Confirmed Fireballs from the American Meteor Society":

13 = USA_ Confirmed Fireballs from the American Meteor Society.png

Also compare the sequence of events with all the other graphs father away from earth in the other post above! If that pattern doesn't look similar in all of them I don't know what is.

Next, the data arranged in a table:

List "14 = USA: Current AMS Fireball Data...":

Unbenannt.png

Next; Data from Japan! Notice that a reliable record only starts in 2007 in this case and as said above, the 2020 data is not published yet. [Update from 02.04.2021 = Data is published now and Graph 15 and List 16 updated accordingly below]

Graph "15 = Japan: Confirmed Meteors (Fireballs)":

15 = Japan Confirmed Meteors (Fireballs).jpg

2019 was all-time record year, also in Japan. We will see how 2020 looks like in a couple of months. Update 02.04.2021: 2020 was the all-time record year, also in Japan. Also compare the pattern here with the other data above!

Next; the same numbers in table form.

List "16 = Japan: Confirmed Meteors (Fireballs)":

16 = Japan Current Confirmed Fireballs (02.04.2021).jpg

END (for now!)

PS: The Japan data above was updated on 02.04.2021
 

Attachments

  • 15 = Japan_ Confirmed Meteors (Fireballs).png
    15 = Japan_ Confirmed Meteors (Fireballs).png
    146.1 KB · Views: 301
  • Unbenannt.png
    Unbenannt.png
    47.7 KB · Views: 305
Last edited:
I haven't said it before, but will say it now: If all the above isn't the closest thing we can probably ever come to in terms of evaluating/confirming the C's prediction of a "comet cluster" coming in, I don't know what is. I think by now we can pretty much say it is likely a hit for the C's. It might even be a good idea to open up a thread about this hit (and reference the data above, in Pierre's book and other sources) in that thread.

Also of note is: despite the fact that practically the whole world has been (in one form or another) in lockdown since the fake pandemic started (almost two-thirds of the year 2020!), we still have all-time record numbers in 2020! Just think about how many observatories worldwide (and people working there) have probably been negatively effected by the "pandemic" (in terms of observing and such), and despite that, it still is a record year almost everywhere in the solar system, including earth. One could also ask: Would the numbers have been even higher if the "pandemic" wouldn't have started and observatories would have worked properly? Also, the lower number of fireball reports in the US in 2020 could at least partly be a result of people being forced to stay at home and indoors because of the "pandemic". Despite that though the US has never seen more (confirmed) fireballs!
 
Last edited:
GREAT BOLIDO IS EARLY MORNING OVER GALICIA #SPMN180121 at 1h19m local time (0h19m TU). We ask for maximum cooperation from eyewitnesses. We have an online form in which you can report what you are well able to remember:http://spmn.uji.e
/ESP/reporte.html
@AstroAficion


Posted by Paul Roggemans | Oct 27, 2020 | Meteor Library, News |
Roberto Gorelli points our attention at a recently published meteor related paper:

Satellite observation of the dust trail of a major bolide event over the Bering Sea on December 18, 2018

This article has been submitted and accepted for publication in Astronomy & Astrophysics by J. Borovička, M. Setvák, H. Roesli, and J. K. Kerkmann.

Abstract: Context. One of the most energetic bolide events in recent decades was detected by the US Government sensors (USGS) over remote areas of the Bering Sea on December 18, 2018, 23:48 UT. No ground-based optical observations exist.
Aims. Using the satellite imagery of the dust trail left behind by the bolide, we tried to reconstruct the bolide trajectory. In combination with the bolide speed reported by the USGS, we computed the pre-atmospheric orbit. Observations in various spectral bands from 0.4 µm to 13.3 µm enabled us to study the dust properties.

Methods. Images of the dust trail and its shadow obtained from various angles by the Multi-angle Imaging SpectroRadiometer (MISR) on board the Terra polar satellite and geostationary satellites Himawari-8 and Geostationary Operational Environmental Satellite 17 (GOES-17) were used. The initial position and orientation of the trail was varied, and its projections into the geoid coordinate grid were computed and compared with real data. Trail motion due to atmospheric wind was taken into account. Radiances and reflectances of selected parts of the dust trail were taken from the Moderate-resolution Imaging Spectroradiometer (MODIS) on board Terra. Reflectance spectra were compared with asteroid spectra.

Results. The bolide radiant was found to be 13° ± 9° from that reported by the USGS, at azimuth 130° (from south to west) and zenith distance 14°. The bolide position was confirmed, including the height of maximum dust deposition around 25 km. The incoming asteroid had to be quite strong to maintain a high speed down to this height. The speed of 32 km/s, reported by the USGS, was found to be plausible. The orbit had a high inclination of about 50° and a perihelion distance between 0.95–1 AU. The semimajor axis could not be restricted well but was most probably between 1–3 AU. The dust reflectance was much lower in the blue than in the red, consistent with the material of A- or
L-type asteroid. The absorption at 11 µm confirms the presence of crystalline silicates in the dust. You can download this paper for free: https://arxiv.org/pdf/2010.13597.pdf (15 pages).

 
Two asteroids made a close approach to Earth on January 18, 2021.

Posted by Teo Blašković on January 18, 2021


NASA has identified six asteroids that will fly past Earth on January 20, 2021.

19 Jan, 2021
 
AMS camera system recorded the fall of seven meteorites simultaneously

ams-camera-system-detects-meteor-burst-from-unknow.jpg


The American Meteor Society (AMS) camera system captured a swarm of seven bright meteorites of unknown origin falling just three seconds apart at 11:50 UTC on January 18, 2021.

Robert Lunsford of AMS reported that five of the seven meteor tracks crossed in the area east of the 3rd magnitude star Zubenelgenubi (Alpha Libra).

Four meteors also crossed in the area south of the famous double star Akrab (Beta Scorpio). Finally, four meteors also crossed near the third-magnitude star Pi Hydra at 213-24.

Scientists checked the data and did not find any of the known meteor streams corresponding to at least one of the above positions.


Source:Система камер AMS зафиксировала падение 7 метеоритов одновременно


The US has many secret weapons - one is Scalar Weapons - they make things disappear (unknown where they go but they don't come back). The Russians got it first from aliens and that was what stopped the "cold war" because they tested
it and when the US saw that their country could be "disappeared" they surrendered to Russia (since they had no defense). Anyway, if they really thought some object would hit Earth they would eliminate it with a Scalar weapon and you would probably never hear about it since they don't want to admit such a weapon exists. So, there is no chance of an asteroid hitting Earth.


Since NASA announced recently that Near-Earth objects (NEOs) are on the rise since 20 years, it could be worth to keep some of the new discoveries on the record. It feels like if every week a new and unknown object crossed closely the earth and was discovered just some hours before.


The newest discovery for this week (10. August) was asteroid 2018 PD20 a 15 m tall asteroid that came as close as 33.210 km (20,636 miles).


Asteroid seen after it makes the closest flyby of the year
many
 
The US has many secret weapons - one is Scalar Weapons - they make things disappear (unknown where they go but they don't come back). The Russians got it first from aliens and that was what stopped the "cold war" because they tested
it and when the US saw that their country could be "disappeared" they surrendered to Russia (since they had no defense). Anyway, if they really thought some object would hit Earth they would eliminate it with a Scalar weapon and you would probably never hear about it since they don't want to admit such a weapon exists. So, there is no chance of an asteroid hitting Earth.

Do you have a source for those claims? I think it is highly unlikely that they can do much of anything against comets/asteroids coming in, even if they should have "secret highly effective weapons". For example; If we assume that what the C's said about Atlantis is more or less what happened: even that "highly advanced" global empire/civilization was apparently completely powerless against the forces of the cosmos (comet cluster). And mind you that they were MUCH more advanced than us (according to the C's), so much so that the C's compared us to Neanderthals in comparison (if I remember correctly). Despite this "high development" though, Atlantis was wiped from earth (apparently by a comet cluster). If even the Atlantis people couldn't see or do anything about it, I highly doubt that we could do absolutely anything against it. The only thing I can think of that could maybe "calm the skies" is Pierre's idea of the collective of humanity vibrating differently, which then might not attract destruction.
 
Last edited:
The Russians got it first from aliens and that was what stopped the "cold war" because they tested
it and when the US saw that their country could be "disappeared" they surrendered to Russia (since they had no defense). Anyway, if they really thought some object would hit Earth they would eliminate it with a Scalar weapon and you would probably never hear about it since they don't want to admit such a weapon exists. So, there is no chance of an asteroid hitting Earth.
First thought when I read your statement went to the fairly recent Meteor strike in 2013, in Russia.
Do you think the Russians missed this one with the "scalar weapon"?


This recent fireball over (Granada Spain) has also been experiencing a fair number of recent quakes.

The fireball that appears in this video flew over the province of Granada on January 29 at 1:19 a.m.

This phenomenon occurred when a rock from an asteroid entered the Earth's atmosphere at a speed of about 83,000 kilometers per hour.

The event has been analyzed by the researcher responsible for the SMART project, astrophysicist José María Madiedo, from the Instituto de Astrofísica de Andalucía. This analysis has made it possible to determine that the fireball started at an altitude of about 98 km over the north of the province of Granada, almost above the vertical of the town of Benamaurel.

From there it advanced in a northwesterly direction, traveling about 40 miles in the atmosphere to finish at an altitude of about 21 miles. This event has been recorded by the SMART project detectors operating in the astronomical observatories of La Hita (Toledo), Calar Alto (Almería), Sierra Nevada (Granada), La Sagra (Granada) and Seville.

Apologies if this article has been posted already.

17-year-old discovers planet 6.9 times larger than Earth on third day of internship with NASA
Published Fri, Jan 10 20201:58 PM EST
During his junior year at Scarsdale High School in New York, Wolf Cukier landed a two-month internship with NASA. So during the summer of 2019, he traveled down to NASA’s Goddard Space Flight Center in Greenbelt, Maryland.

His first assignment was to examine variations in star brightness captured by NASA’s Transiting Exoplanet Survey Satellite, known as TESS, as a part of the Planet Hunters TESS citizen science project. (The citizen science project allows people who don’t work for NASA to help with finding new planets.)

Just three days into his internship, Cukier discovered a new planet.

NASA announced the news on their website this week, after confirming the teenager’s work, submitting a paper that Cukier co-authored for scientific review and announcing the discovery of the planet, now named “TOI 1338 b,” at the 235th American Astronomical Society meeting.

“I was looking through the data for everything the volunteers had flagged as an eclipsing binary, a system where two stars circle around each other, and from our view eclipse each other every orbit,” 17-year-old Cukier tells NASA. “About three days into my internship, I saw a signal from a system called TOI 1338. At first I thought it was a stellar eclipse, but the timing was wrong. It turned out to be a planet.”

“I noticed a dip, or a transit, from the TOI 1338 system, and that was the first signal of a planet,” Cukier explains to NBC 4 New York. “I first saw the initial dip and thought, ‘Oh that looked cool,’ but then when I looked at the full data from the telescope at that star, I, and my mentor also noticed, three different dips in the system.”

TESS Satellite Discovered Its 1st World Orbiting 2 Stars (Video)

According to NASA, TOI 1338 b is 6.9 times larger than Earth (in between the size of Neptune and Saturn) and is located in the constellation Pictor, about 1,300 light-years away from Earth. For context, the Earth’s sun is between seven and nine light-minutes away.

TOI 1338 b is the first planet captured by the TESS system that is considered a circumbinary planet, meaning it orbits two stars. The two stars orbit each other every 15 days, and one is 10% larger than the Sun.

Together, TOI 1338 b and its two stars make up what is called an “eclipsing binary.”

In an interview with News 12, Cukier compared his discovery to “Star Wars.” “I discovered a planet. It has two stars which it orbits around,” he said. “So, if you think to Luke’s homeworld, Tatooine, from ‘Star Wars,’ it’s like that. Every sunset, there’s gonna be two stars setting.”

Cukier has several framed “Star Wars” posters and a telescope in his bedroom.

This Teen Just Discovered a WHOLE NEW PLANET! | News 4 Now (Video)

NASA states that circumbinary planets like TOI 1338 b are difficult to detect because typical software can confuse them for eclipses, which is why the help from interns like Cukier is valuable.

“These are the types of signals that algorithms really struggle with,” Veselin Kostov, a research scientist at Goddard tells NASA. “The human eye is extremely good at finding patterns in data, especially non-periodic patterns like those we see in transits from these systems.”

After making history, the high school senior is now thinking about his future in college, telling News 12 “my top three choices are Princeton, MIT and Stanford.”


Back
Top Bottom