Near-Earth objects and close calls

All Data and Graphs (Moons, NEOs, NEAs, NECs, PHAs, Fireballs etc)

B = Near Earth Environment: All Near Earth Objects [NEOs = Near Earth Asteroids (NEAs), Near Earth Comets (NECs), Potentially Hazardous Asteroids (PHAs)]

Graph "4 = Total of All NEOs Cumulative" in Folder "B = Near Earth Environment: All Near Earth Objects":

4 = Total of All NEOs Cumulative.png

The Cumulative Nature of the Graph above, the high numbers at the end as well as the decade count until 2000 make it harder to see how sharp the increase really was and when it started.

That's why we focus on just the number of new NEOs discoveries for every year/decade in the next graph. In other words: We are not culminating the numbers like in the last graphs above and thus make what happened better visible. We can see a clearer pattern there.

Graph "6 = All New NEO Discoveries per Year or Decade" in Folder "B = Near Earth Environment: All Near Earth Objects":

6 = All New NEO Discoveries per Year or Decade (NEAs and NECs) + in separate Bars = All Discov...png

Next comes the list (with sub lists available in the database) on which all the data in Folder B and in this post are based. Since it is also Cumulative you can pretty much ignore the percentage increases in that list from one year to the next since they don't represent a reliable way of measure in this specific case. The numbers are important in that list not the percentages... The percentages are misleading in this case.

List "5 = Sum of All New Discovered Near Earth Objects (NEOs), per Year" in Folder "B = Near Earth Environment: All Near Earth Objects":

NEOs.jpg

Next a graph taken from the NEO website itself. It is also cumulative and thus also rather hard to read out specifics.

Graph "7 = Total of All NEAs Cumulative" in Folder "B = Near Earth Environment: All Near Earth Objects":

7 = Total of All NEAs Cumulative (Red = bigger 1km, Orange = bigger 140m, Blue means  =Rest).png

Now we again extract the actual new discoveries from the last cumulative graph above to get a clearer better picture. In other words: no Culmination.

Graph "8 = Discovered Near Earth Asteroids (NEAs) bigger 140m or 1km..." in Folder "B = Near Earth Environment: All Near Earth Objects":

8 = Discovered Near Earth Asteroids (NEAs) bigger 140m or 1km respectively and  Discovered Pot...png


Now we come closer to earth. Last but not least in this section, here comes the graph of the Potentially Hazardous Asteroids (PHAs) alone.

Graph "9 = Total Number of Discovered Potentially Hazardous Asteroids (PHAs)" in Folder "B = Near Earth Environment: All Near Earth Objects":


9 = Total Number of Discovered Potentially Hazardous Asteroids (PHAs) per Year or Decade.png
 
Last edited:
Now we are coming really close to home. The next main list in this section on which all the info and graphs are based gives us fascinating data that you can't find anywhere else. See first list below. You can order each column in that list from A -Z or from Z - A. In that way you can discover a lot of interesting stuff, like for example: The first ever discovered Near Earth Object that made a close approach to earth nearer than the moon was discovered in 1991! All close approach dates before that point are theoretical back calculations! In other words: The first ever Near Earth Object that came closer than the moon was discovered in 1991! The total number of those objects is 631 by now (zero in 1990!). In the column "Days Notice" (Column D) you can see at a glance if the object was discovered too late or before it made the close approach to earth. And much, much more.

All Data and Graphs (Moons, NEOs, NEAs, NECs, PHAs, Fireballs etc)

C = Close Calls nearer than Moon: NEOs approaching Earth less than 1.01 LD (Lunar Distances) = Past, Present, Future

List "10 = ALL Neo Objects closer than Moon" in Folder "C = Close Calls nearer than Moon:...":

Short Snapshot of the list, ordered by Date of Discovery:

NEOs closer Moon.jpg

How to read the above the list-snapshot on the example NEO Object "1991 BA" (Column A):

Notice that you can see at one glance to the right on what Date the object was discovered (Column B), on what date the close approach to earth happened (Column C), at what time that close approach happened (Column D), that it was discovered on the same day as it was approaching nearest to earth (Column E), how far away it was at its close approach (Column F) [in this case about 0.44 Lunar distances or less than half the distance between earth and moon], how big it was in the lowest estimate (Column G) and how big it was in the highest estimate (Column H).

Notice also that everything that is marked in orange in Column E means that all those objects that are marked that way in that column were discovered on the same day as the close approach, or any given number of days after the close approach already happened. So the number 0 in that column means the same day for example and is thus marked orange, same as "-4" and every other minus number. Conversely, everything not marked in that column was discovered before the object made the close approach. So every positive number from "1" upwards is unmarked.

Column F has a colour scale = the color deep red marks the closest approaches to earth on one end of the scale while the color white (or rather not marked) is farthest away.

Column G and H also have a colour scale = the color deep red marks the biggest objects on one end of the scale while the color white (or rather not marked) marks the smallest objects.

Everything marked with the color green in Column C is a close approaches that will happen in the future. Conversely, everything unmarked in that column happened in the past.

Next, another Snapshot of the list, this time ordered by close approach date, so we can take a peek at the future!

NEOs closer Moon.jpg

Notice the huge chunks coming dangerously close 2028 and 2029. And most important: Notice that we pretty much established by that list now that there is a very good likelihood that a huge amount of big and small objects will slip by earth in the near future that are not on this list yet. I'm guessing from the list that about 98 percent of those 631 NEOs that were discovered so far, were discovered on a very short notice (a couple of days at most) and most (over 60% probably) were discovered after the fact of the close approach.

Next the graphs based on the list.

List/Graph "11 = All NEOs Closer than the Moon:..." in Folder "C = Close Calls nearer than Moon:...":

NEOs closer Moon.jpg

2019 is the record year! Also notice when it started to increase...

NEOs closer Moon.jpg

Next: More fun with the data in the table, and a similar picture! It sort of represents the total mass of stuff coming each year close to earth, closer than the moon!

NEOs closer Moon.jpg
 
Last edited:
Now we are on earth itself!

All Data and Graphs (Moons, NEOs, NEAs, NECs, PHAs, Fireballs etc)

D = Earth Impact: Fireballs

Graph "12 = USA: Reported vs. Confirmed Fireballs from the American Meteor Society" in Folder "D = Earth Impact: Fireballs":

12 = Reported vs. Confirmed Fireballs, within the USA, from the American Meteor Society.png


Next, the same graph without the number of reports.

Graph "13 = USA: Confirmed Fireballs from the American Meteor Society" in Folder "D = Earth Impact: Fireballs"

13 = Confirmed Fireballs, within the USA, from the American Meteor Society.png

2019 is a record year! Also compare the sequence of events with all the other graphs father away from earth in my other post above! If that pattern doesn't look similar I don't know what is.

Next, the data arranged in a table:

List "14 = USA: Current AMS Fireball Data..." in Folder "D = Earth Impact: Fireballs":

USA Fireballs.jpg

Next; Data from Japan! Notice that a reliable record only starts in 2007 in this case:

Graph "15 = Japan: Confirmed Meteors (Fireballs)" in Folder "D = Earth Impact: Fireballs":

15 = Confirmed Meteors (Fireballs) Over Japan.png

2019 is another all-time record year, also in this department! Also compare pattern here with the other data above!

Next; the same numbers in table form.

List "16 = Japan: Confirmed Meteors (Fireballs)" in Folder "D = Earth Impact: Fireballs":

Japan Fireballs.jpg

END (for now!)
 
Last edited:
Thanks for all that hard work @Pashalis. The graphs and charts really paint a clear picture I think. It is amazing what you can do by using data/knowledge that is available but not being utilized in the way you have done. It is the utilization that makes the difference I think.

Session 17 August 2003:
Q: (L) I could cry! The whole situation has been so stressful!

A: Help is on the way!

Q: (Perceval) Seems like the process is that we get ourselves in trouble by doing what we have to do and then help arrives. (Galahad) Is there any potential danger from J___?.

A: Now, that's another one of those interesting questions that carries awareness in the very asking. Eh? Knowledge protects if utilized.
 

And most important: Notice that we pretty much established by that list now that there is a very good likelihood that a huge amount of big and small objects will slip by earth in the near future that are not on this list yet. I'm guessing from the list that about 98 percent of those 631 NEOs that were discovered so far, were discovered on a very short notice (a couple of days at most) and most (over 60% probably) were discovered after the fact of the close approach.

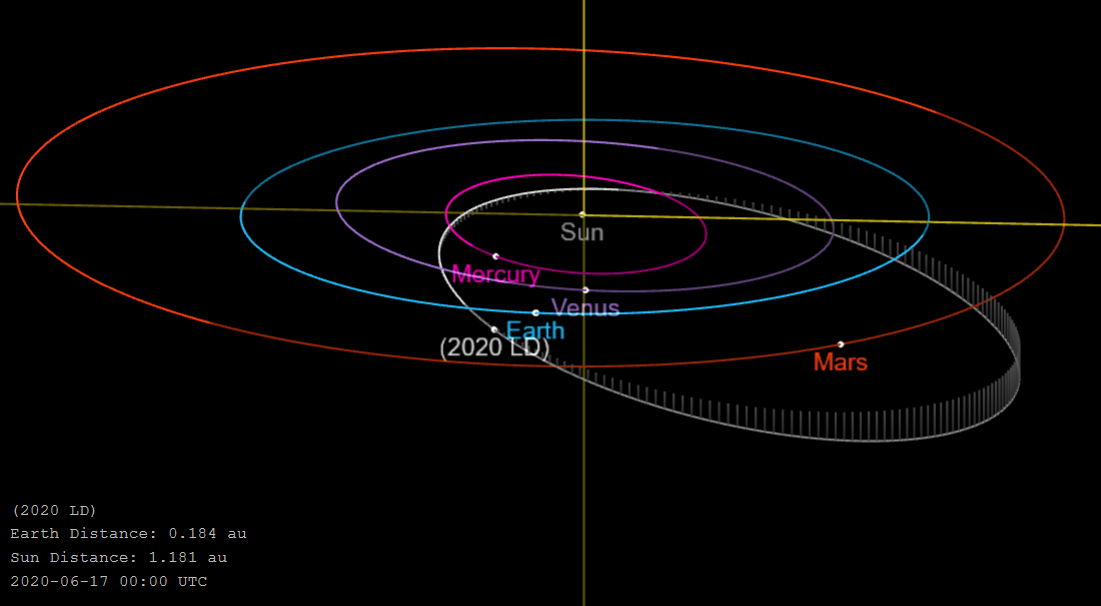
Just to illustrate and give you'll a better idea/perspective on what is actually going on right now above our heads, I'll give a short example. The last NEO object that was discovered so far and that came closer to earth than the moon was Object "2020 LD". It is listed in List 10 here:


Here is a screenshot of that object and its characteristics from that list. I highlighted the relevant part:

(2020 LD) example.jpg

As you can see, "2020 LD" was first discovered last Sunday (2020-06-07), two days after it already made its close approach to earth (2020-06-05), as you can see in Column E. In other words: It was discovered two days too late. In still other words: There isn't a darn thing anybody could have done to foresee, let alone prevent it hitting the earth. It was 0.80 Lunar distances away from earth when it got closest, as you can see in Column F. So, quite a bit closer than the moon. It was quite a big chunk too with an estimated diameter between 89 and 200 Meters, as you can see in Column G and H!

Now, we had an all-time record year for such objects last year (2019), as you can see here:

List/Graph "11 = All NEOs Closer than the Moon:..." in Folder "C = Close Calls nearer than Moon:...":

NEOs closer Moon.jpg


2019 is the record year! Also notice when it started to increase...

As you can see above, in 2019 we had 82 close encounters with such objects (the ones we didn't detect, not even mentioned here!). That means that in the year 2019 an object like that flung very close by earth on average about every 4.5 days! Now, compare this number for example with the year 1991, which was the year in which the first ever object of this kind was discovered/detected. In 1991 only 2 objects of that kind flung very close by earth. Which means that in 1991 an object like that flung by earth on average "only" about every 182.5 days. Or take a look even just at the year 2006 for comparison above; there were still "only" 6 such objects discovered/detected.

Now, how many of those 82 objects in 2019 were discovered ahead of time and how many after the close approach already happened? If you arrange/order the list accordingly, you will see:

54 Objects were discovered on the same day or too late, which gives us roughly 65.85%.
28 Objects were discovered ahead of time either one day before or earlier, which gives us roughly 34.15%.

However, out of those 28 Objects 12 Objects have been discovered just 1 day before, 4 Objects two days before, 6 Objects 3 days before, 1 Object 4 days before, 1 Object 6 days before, 1 Object 9 days before, 1 Object 10 days before, 1 Object 11 days before and finally, 1 Object 13 days before. And that's it.

So, if we are in a really generous mood and say that we could have done something to protect or prevent the earth from being hit by those Objects in 2019, that we detected a week earlier and above (7 - 13 days), then we have to say that in actuality we couldn't have done anything about the remaining 24 Objects out of those 28. Which would mean that we couldn't have done anything against 24+54 Objects out of those 82 Objects, which gives us roughly a sum of 95.12%.

But, I would dare say, that we, realistically speaking (with the capabilities at our disposal nowadays) couldn't have done even a darn thing against that object that was discovered 13 days before. So that means, sobering enough, that 100% of those 82 Objects in 2019 would have hit earth without us having the slightest chance to do anything about it, since they all, without any exception, were discovered much too late and thus that we are basically screwed against the power of the cosmos!

And in case you are wondering if 2019 was an exception in that regard or if we have been improving (detecting things well ahead of time) since 1991, I'm afraid to have to disappoint you'll with "bad news" here too. 2019 was not exception and it pretty much looks that this sobering ratio doesn't improve at all over time, in any shape, form or fashion.
 
Last edited:
Just to illustrate and give you'll a better idea/perspective on what is actually going on right now above our heads, I'll give a short example. The last NEO object that was discovered so far and that came closer to earth than the moon was Object "2020 LD".

Could find only two news stories on the web covering this close approach and I actually only found out about it myself through the list in the database:


And a Wikipedia page:


If something like this isn’t news worthy, I don’t know what is.
 
Next; Data from Japan! Notice that a reliable record only starts in 2007 in this case:

Graph "15 = Japan: Confirmed Meteors (Fireballs)" in Folder "D = Earth Impact: Fireballs":

View attachment 36932

2019 is another all-time record year, also in this department! Also compare pattern here with the other data above!

Next; the same numbers in table form.

List "16 = Japan: Confirmed Meteors (Fireballs)" in Folder "D = Earth Impact: Fireballs":

View attachment 36933

END (for now!)

Great compilation of data Pashalis, thank you for putting this together.

Japanese data would suggest that there is an increasing number of these events, as opposed to the number of events being flat and now we're just noticing them more.

Has anyone dived into the historical evidence across periods to observe the frequency by which modern historians report fireball events of any kind? I've seen multiple fireballs myself, and multiple people I know now have as well. There was a large overhead explosion over Vancouver recently that woke everyone up with a sonic boom, reported to me recently. I'm wondering how strong the case is for this being a definitely new phenomena.

If the historical records over 1900-2000 show fireball sightings to be extreme rarities, that would be very strong evidence in support of increasing frequency of the event. I'm not certain on how to go about validating this thesis though, so any suggestions would be welcome.

Mind you, it seems like the case for an increase in event frequency is reasonably strong already, but this matter is of such importance that making it airtight would be valuable. To make it airtight would force re-assessment of many historical ideas.
 
@Pashalis your skills are invaluable to understand also the fact that I can easily turn around and in the shadows and eventually see what's going on... !
I appreciate so much

@Pashalis vos compétences sont inestimables pour comprendre aussi le fait que je peux tourner facilement autour et dans l'ombre et voir éventuellement ce qui se passe... !
J'apprécie tellement
 
Has anyone dived into the historical evidence across periods to observe the frequency by which modern historians report fireball events of any kind? I've seen multiple fireballs myself, and multiple people I know now have as well. There was a large overhead explosion over Vancouver recently that woke everyone up with a sonic boom, reported to me recently. I'm wondering how strong the case is for this being a definitely new phenomena.

If the historical records over 1900-2000 show fireball sightings to be extreme rarities, that would be very strong evidence in support of increasing frequency of the event. I'm not certain on how to go about validating this thesis though, so any suggestions would be welcome.

I think it would be rather hard, even if there were such records, to come to more or less sound conclusions only based on such reports in terms of the question if there is an increase/intensification or not. The presented data is the best we got at this point IMO, in order to maybe come to an approximation, and even that is hard to proof or disprove. I think it is simply impossible at our level (not only in terms of technology) to really fully grasp/understand what is going on. There is a huge amount of uncertainties and variables to consider. And space is incredibly huge, even just the space involved in our solar system.

Mind you, it seems like the case for an increase in event frequency is reasonably strong already, but this matter is of such importance that making it airtight would be valuable. To make it airtight would force re-assessment of many historical ideas.

I think it is pretty much impossible to come to any kind of airtight conclusion in this subject matter. The "due to improved technology" idea always lingers around and can easily be invoked as "explanation". However, considering the pretty similar pattern in all the data; from the outskirts of our solar system (A), to the near earth environment (B), to the close to earth environment less than a moon distance away (C), to earth itself in terms of fireballs and impacts (D): I think it is pretty reasonable to think that there might be a correlation there and that this isn't just coincidence or "improved technology".

We also know that the C's predicted that a comet cluster is coming exactly around the time frame the data above now shows itself to increase quite dramatically, in all the 4 categories (A-D). Since the C's have a pretty good track record, I definitively tend to think that much of what we can see in the data is exactly what they predicted there and quite little is due to "improved technology". If we take the situation on earth to account on top of that in terms of social chaos and earth changes, the case becomes even stronger, especially if you take a look at history.

I personally think that what we are witnessing is quite likely the inflow of the comet cluster the C's talked about. We also have to remember again that the spaces involved in our solar system are incredibly big. We also don't really know how dense that cluster is supposed to be and if it is even uniformly the same density everywhere within the cluster. Maybe the cluster is something like a rather huge cloud of objects from dust sized particles up to huge objects. We don't know how far away each object is from the other on average. Probably it varies a lot. We also don't know if what we are seeing are just the beginning stages of the cloud "moving in" and how long that cloud will effect earth this time around. For all we know, the whole episode could go on for hundreds of years or even longer and what we have seen so far is literally "nothing yet".
 
Five more on there way this week,


Sure looks like the Cs were right about interesting cosmic events this year.

And yes, if such things are not newsworthy, I don't know what is. But obviously, the PTB feel that such news should be suppressed and they should keep everyone focused on hating each other - a sure recipe for disaster.
 
As Spaceweather says: "here we go again?". As detailed in the article below, one astronomer predicts there's a 70% chance Comet NEOWISE will go naked-eye beginning July 3rd.

Also of note, particularly because another researcher sees June as having earthquake potential, is the brief report that Earth is due to cross the heliospheric current sheet boundary and this could mess with Earth's magnetic field.

Comet NEOWISE could become naked-eye by July, Earth crossing heliospheric current sheet boundary


Space Weather
Tue, 16 Jun 2020 22:32 UTC


NEOWISE
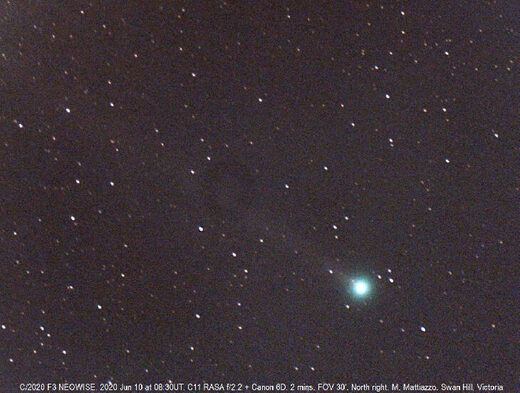
© Michael Mattiazzo on June 10, 2020 @ Swan Hill, Australia

This image of comet C/2020 F3 (NEOWISE) was taken on 2020 June 10 at 08:30UT Using a Celestron C11 RASA f/2.2 on a Skywatcher AZEQ6 mount and Canon 6D camera, 4x30sec combined exposure. The comets solar elongation was a mere 21 degrees! The comets altitude above local horizon was 5 degrees. My approximate visual estimate was 6.8 using 15x70mm binoculars. The well condensed coma was 4' wide. Tail length on image = >40' in PA 149. Heliocentric distance = 0.72AU Earth distance = 1.56AU Hopefully the comet will survive perihelion and be a case of third time lucky for northern hemisphere observers.

NAKED-EYE COMET NEOWISE?

Here we go again. A comet is falling toward the sun, and it could become a naked-eye object after it skims past the orbit of Mercury on July 3rd. Michael Mattiazzo photographed Comet NEOWISE (C/2020 F3) on June 10th from Swan Hill, Australia.

"Pushing the limits of comet observing, I had to leave home to find a clear horizon," says Mattiazzo. "When I took the picture, Comet NEOWISE was very close to the sun and only 5 degrees above the local horizon. Its visual magnitude was near +7.0, below the threshold for naked-eye visibility."

It might not look like much now, but this comet could blossom in the weeks after perihelion (closest approach to the sun). Forecasters say Comet NEOWISE might become as bright as a 2nd or 3rd magnitude star. Northern hemisphere observers would be able to easily see it in the evening sky in mid-July.

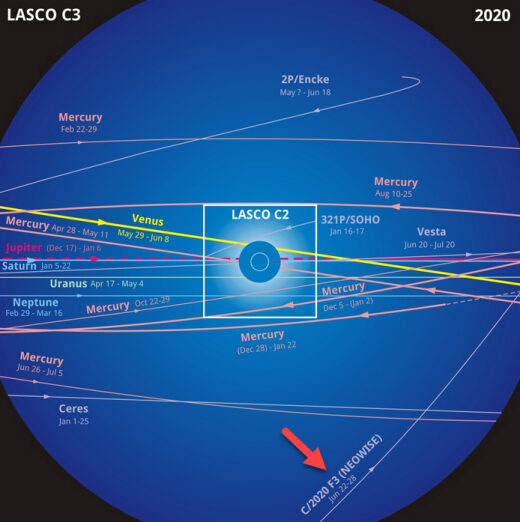
comets map 2020

At this point, readers may be experiencing a feeling of déjà vu. Almost the exact same forecast was issued for Comet ATLAS (C/2019 Y4) in March and Comet SWAN (C/2020 F8) in May. Both comets dived toward the sun and ... instead of blossoming, died. Intense solar heat can do that to a fragile ball of ice.

Mattiazzo, who is one of the world's most experienced amateur comet observers, thinks Comet NEOWISE could turn out better. "I'd say there's a 70% chance this comet will survive perihelion," he says, basing his guess on the stability of the comet's light curve, which sets it apart from Comets ATLAS and SWAN. "Hopefully, Comet NEOWISE could be a case of 'third time lucky' for northern hemisphere observers."

We'll know soon enough. On June 22nd, the comet will enter the field of view of SOHO's C3 coronagraph-a space-based instrument that blocks the glare of the sun to reveal nearby stars, planets and comets. For a whole week, astronomers will be able to monitor Comet NEOWISE as it approaches the orbit of Mercury. If it falls apart, the event may be visible in the images. Ditto if it survives.

SOLAR SECTOR BOUNDARY CROSSING

Earth is about to cross a fold in the heliospheric current sheet--a vast wavy structure in interplanetary space separating regions of opposite magnetic polarity. The crossing, called a "solar sector boundary crossing," is expected on June 16th and could trigger minor geomagnetic activity around Earth's poles.
 
Back
Top Bottom