tohuwabohu
Jedi Master
So I finished the 3D simulation which was done in the same manner as the 2D one posted above. I was facing few problems with the patch shrinking in the direction normal to the plane of ecliptic which caused that the prescribed spatial density of the patch changed over time. This was solved by enlarging the patch in the normal direction so that when it meets the companion the size of the patch is decreased to the desired one and the spatial density at the moment is known. I also introduced random deviations so that the distribution is closer to the reality where the objects have different inclination and eccentricity of the orbit.
After the initial issues were resolved the tests were performed exactly as before - there were ten patches with heliocentric distances ranging from 50 AU to 150 AU with thickness of each patch being 10 AU in the radial direction. Other dimensions of the patches were chosen in such way that the formed primary wake and the destabilized tails covered the inner solar system. Thus the influx into the solar system can be accurately estimated.
The initial density of the asteroid cloud was 1e6 AU-3 (i.e. there is million bodies in a cube with dimensions 1x1x1 AU). This is the density when the patch came into the interaction with the companion. It was already shown that the influx into the inner solar system is linearly dependent on the initial density thus the results can be scaled to any other initial density or even to density that is variable with the heliocentric distance.
For this simulation also the destabilized tails were captured for distances 90 AU and less because they kicked in early enough. If also the destabilized tails for regions beyond 90 AU were captured then the influx would continue to increase. Nevertheless in this simulation the influx decays after the patches pass through the solar system. All in all a time window of 150 years was captured with 50 years for after the companion passed the perihelion. But due to the above mentioned reasons the results are valid to approximately 30 years after perihelion.
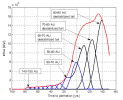
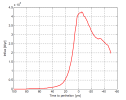
The results are shown in Fig. 17. The curves are color coded - blue is the primary wave, black are the destabilized tails and red is the overall influx obtained by superposition of all patches (the curves were simply added together). The curve is read from left to right with negative values on the x-axis corresponding to period after the companion passes perihelion.
One can clearly see that the influx is fairly constant until approx. 30 to 40 years before perihelion and is very low. Perhaps this influx can be compared to the background influx which is permanently ongoing due to the collisions and planetary interactions.
For example the influx at 30 years to perihelion is 102,400 bodies per year. The influx for 40 years to perihelion is 81,500 bodies per year.
Afterward there is steep increase in the influx and during the perihelion the influx is 1,114,200 bodies per year. This is rougly 10 times more compared to the 30-40 years to perihelion period!
The question is where on the curve are we now?


 Indeed !!