Signs of global crop failures or just normal fluctuations

Aeneas

Ambassador
Ambassador
FOTCM Member
I am starting this new thread to see if we can discern if there are real global crop failures and if not yet, then to record them in this thread as they happen.

There are a lot of articles and videos that talk of imminent food shortages due to frost in some wine districts or flooding in corn areas or bad wheat harvests. One of those is David Dubyne from Adapt 2030 and sometimes there is something to it, such as the devastating flooding in America this year. Other times they appear to be small devastations that does not affect the global output and that David is crying wolf a little too much in order to fit his theme of Grand Solar minimum and an imminent ice age. Or at least that is how it appears after having looked at a number of statistical sites.

Then there is another camp, which tries to counteract the global warming crowd by saying that everything is really just normal and that there is nothing to worry about. They could however be in for a surprise as we do appear to enter unknown territory.

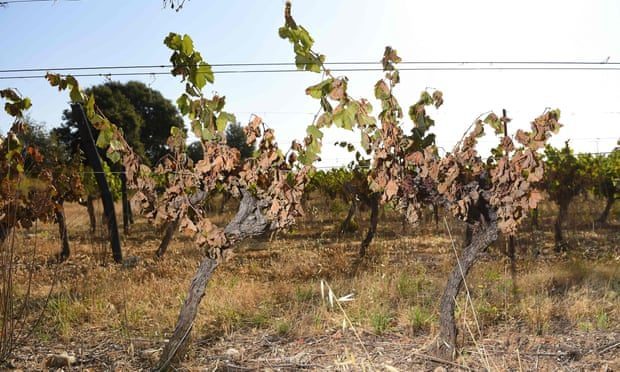
Looking at the following headline, one could think that French wine production is about to collapse:

Reuters
Tue, 27 Aug 2019 11:40 UTC

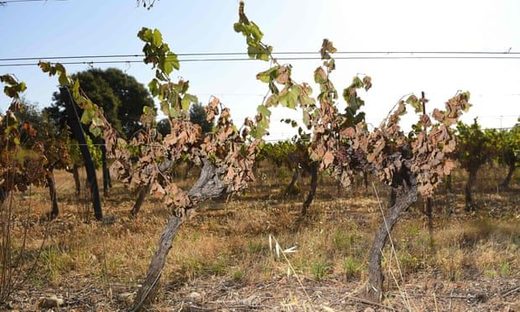
Vines badly burnt by the sun and heat in a vineyard in Sussargues, southern France
© Sylvain Thomas/AFP/Getty Images
Vines badly burnt by the sun and heat in a vineyard in Sussargues, southern France, at the end of June.
French wine production will fall 12% this year after vines were damaged by spring frosts, drought and hail, but quality will remain generally good, the agriculture ministry said on Tuesday.

In its second estimate for 2019, the ministry forecast production of 43.4 million hectolitres, down from 49.4 million in 2018 when output had benefited from good weather condition.

Last month the farm ministry put French output in 2019 in a range of 42.8 million to 46.4 million hectolitres.

A hectolitre (100 litres) is the equivalent of about 133 standard wine bottles.

In many vineyards, flowering occurred in rainy and cold weather, while heat and hail have also contributed to a decline in production potential, the ministry said in a note.
2018 was from what I gather an exceptional year so to be a bit down would not be unusual. In trying to find the figures for the last years to find out what is an average year, I discovered that the average from 2013-2017 was 43.5 million hectoliters, so 43.4 for the year 2019 does not sound alarming.

Here are the production figures for France for the last few years:
2018: 49.1 MHL (million hectoliters)
2017: 36.4 MHL
2016: 45.4 MHL
2015: 47.0 MHL
2014: 45.0 MHL
2013: 41.0 MHL

Sources to the above:

So considering that agriculture always experiences ups and down, as it is dependent on the weather this is only what one would expect.

In the above, one should also keep in mind that agricultural production including the wine industry is subject to market forces, so the average can fluctuate over time. If it is hard to sell the French wine over a number of years due to loss of market share to other wine producing regions, then it would not be surprising to see drops in wine production. The opposite also takes place if French wine in this example find new markets or capture more of the market share. No surprises there, but just to point out that one can not compare so easily to wine production figures from say 20 years ago without making a more complex analysis.


In a follow up post I will look at global wheat production figures (which are open in tabs on my browser, but it will have to wait).
 
The top three crops are 1) corn, 2)rice and 3) wheat. Wheat and rice are competing with between second and third rank. This post will look at global production for the last few years to give an idea of the trend and also as a basis to compare with future years production.

A quick overview can be seen from USDA which has figures that vary slightly from other sources. Perhaps because of not going by the calendar year, but from what is suspect is July to July.

World production (million tonnes):
Wheat:
2017/2018: 762
2018/2019: 731
2019/2020: 768

Rice (milled):
2017/2018: 495
2018/2019: 499
2019/2020: 498

Corn:
2017/2018: 1078
2018/2019: 1123
2019/2020: 1108

This article was from August 2019 and I suspect that the figures for 2019/2020 is forecast figures only.
 
continued from previous post:

Wheat is the third most produced crop in the world and the second most important one in the US. The top ten producing countries are:


Top wheat producers in 2016

Country
millions of tonnes
European Union157.3
China131.7
India93.5
Russia73.3
United States62.9
Canada30.5
France29.5
Ukraine26.1
Pakistan26.0
Germany24.5
Australia22.3
World730


Before the year 2013, world wheat production had never been above 700 million tonnes, but has ever since been above 700 million tonnes. Several factors can be involved, such as favouring wheat instead of other crops, better varieties and/or better farming practices.


The amount of wheat grown since 2012 (In million tonnes):

2012: 672

2013: 711

2014: 734

2015: 737

2016: 750

2017: 772

2018: Still not available but well below 772 and perhaps closer to 730 million tonnes from what I gather.


Rice is the second most important crop grown in the world. The top rice producers were in 2016:

Country
Production (millions of tonnes)
Rice production – 2016
China209.5
India158.8
Indonesia77.3
Bangladesh52.6
Vietnam43.4
Myanmar25.7
Thailand25.3
World741.0


The above figures are for paddy rice, which is for the unprocessed rice kernels in their natural state. After milling there remains about 70%, which is now known as milled rice.


The USDA yearbook on rice gives more historical data. Both paddy rice and millet rice is mentioned.

Below are a few figures taken from there for global production of paddy rice in million tonnes:

2011/2012: 701 (470)

2012/2013: 710 (476)

2013/2014: 718 (481)

2014/2015: 719 (482)

2015/2016: 710 (476)

2016/2017: 733 (491)

2017/2018: 740 (495)

2018/2019: 749 (502)

As can be seen above, the trend in global production is growing and a lot might be due to better farming practices. On ricepedia, one can read that the yields per hectare varies from less than 1tons/hectares to over 10tons/hectares. The average yield in 2010 was 4.3tonnes per hectares according to wikipedia.
 
Last edited:
Continued from previous post:

Corn is the most produced crop in the world. The top corn/maize producers in 2014 were:

Country
Production (millions of tonnes)
Maize production – 2014[88]
United States
361.1​
China
215.6​
Brazil
79.9​
European Union
77.6​
Argentina
33.1​
Ukraine
28.5​
India
23.7​
Mexico
23.3​
World
1037.8


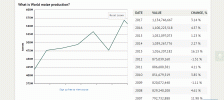
Below are some stats from the last 10 years of the worlds corn/maize production:

Worlds maize production.gif


On a last note in this post, David Dubyne on Adapt 2030 talks about food shortages everywhere. If that is really the case and not isolated incidents, then how to square that with what appears to be a rising food production? Just last week I read that the French revolution was manufactured by making a free trade deal with England. This meant a total collapse of French industry ( such as cotton and mining) and England bought massive amounts of the French wheat production, a lot more than they needed. This lead to food shortages and when folks are hungry riots are easy to get going and the result was the French revolution.

So if there are food shortages everywhere, is food being hoarded or directed to other purposes such as bioethanol on a scale that will result in shortages and eventually lead to revolutions?

The pathocratic elite has no qualms with creating a famine if it serves their interests as the Bengal famine in 1943 is another example of. Like with the French situation in the 1780ies, free trade deals can result in countries not being allowed to keep their own food and feed their own populations. A globalised world is even more vulnerable and a manipulated supply and demand can crush farmers, create shortages and cause 'color revolutions'. A global cooling event would reduce the areas where food can be grown and strain a highly vulnerable system.
 
Last edited:
Just watched a movie about the 1847 Irish famine. It showed the famine was caused by the English land Barons in an effort to wipe out a whole race of people. There was no shortage of food for most, just the Pictish people. This forced an exodus to America.
 
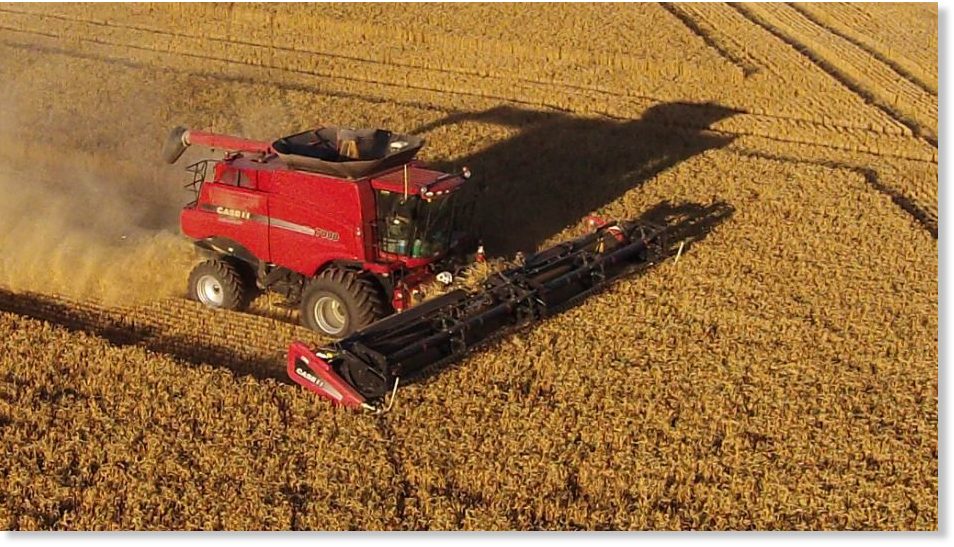
THE ANNUAL migration of contract harvesters following the grain from Queensland down to Victoria as harvest extends from north to south will be cut short this year due to the drought in northern and central NSW and Queensland.
Contractors have said there is not sufficient grain in the northern run, barring geographically remote Central Queensland, to make it worth the expense of moving equipment north.
 
Today Adapt 2030 had a new youtube out which was spelling doom and gloom:
The intro says:
Australia becomes a wheat importer looking to Canada for supply but Canadian wheat output slashed this year as well. Now other countries that used to rely on Australian exports need to find supply elsewhere. Australian government warning people to brace for huge food price rises, which we see unfold as an example of what the planet will experience in a massive economic contraction as food becomes super expensive and buying habits shift.

In a previous post I showed how wheat production has been increasing overall in the last 5 years, which actually is the case for the last decade, so is an imminent food crises on the door steps as Adapt 2030 says.

Looking at the figures, I discovered that Australia overall is having a bad year again, but how bad?
According to figures from Graincentral, then the average for the last 5 years has been 23,17 MT and this year it is projected at 19.05MT. So yes, it is 18% below the 5 year average and 22% below the 10 year average. One can see the averages for Australia for the last 20 years here.

When looking at Canada, then the picture looks very different what Adapt 2030 painted, almost 180 degree. :-O

In the presentation David shows how Canada's wheat production is down 39%. Yes, winter wheat is down 39% BUT the most common wheat that Canada grows is spring wheat, as a matter of fact 10 times more than winter wheat and here the crops are looking good based on the latest report out yesterday. Overall Canada is looking to be above average for the yields of wheat this year as the following diagram shows:

statistics-canada-september-harvest-2019-data-model-crop-production-estimates.png


The line to look for is Total Wheat. As a matter of fact so are most crops grown in Canada for this year, with a few exceptions. Compared to the 5 year average, Barley is up 23%, Wheat by 7% and even corn by 5%. Most of the estimates have been adjusted upwards compared to August, when things didn't look so rosy, but growing conditions must have been excellent since then.

Are they being over optimistic? Well according to the article, then in the past 4 years then have erred on the low side, so the writer expects the yields to be even better come December when all is harvested:

...this significant bump in the Harvest 2019 estimates from StatsCan was somewhat expected. That said, if history is any benchmark, it’s likely that Statistics Canada will increase its expectation of this year’s harvest yet again, something that they’ve done consistently since they started their model-based estimates back in 2015. For some of the major Canadian Prairies crops, this means that barley production could, theoretically, climb above 10 MMT while spring wheat could top 27 MMT.
Harvest-2019-StatsCan-Final-Crop-Production-Estimate-Deviation.png

The article also shows the forecast for the US, which by all counts is looking to be a year with lower yields.

As for Canada not being able to export to Australia as Adapt 2030 says, then that doesn't hold water from what I see. A shell game is not happening this year unlike what David predicts.

While I agree that the global climate shows signs of cooling as Adapt 2030 highlights, then I think it is a little dangerous to get too alarmist and emotional about it, which just discredit those who question the global warming narrative. A narrative that is driven by alarmism, fear, emotionality and the use of children with plaited hair. :-P

Europe as far as I know have also had a good harvest, with above average for France, but I will get to that in another post.
 
Thanks for opening this topic, Aeneas. I too have been wondering how serious the crop losses around the world might be when watching D. Dubyne's videos. There are certainly many variables at play here.

On a last note in this post, David Dubyne on Adapt 2030 talks about food shortages everywhere. If that is really the case and not isolated incidents, then how to square that with what appears to be a rising food production?
As can be seen above, the trend in global production is growing and a lot might be due to better farming practices.
I am not sure about this one. It's complicated. Better farming practices could also mean using more GMO fertilizers or new crop varieties which gives short-term rise in production. Also, the population is growing and so must the demand. Hard to say if the rising numbers in crop production in some instances could be a result of more previously unused land being turned to crop fields. I.e. China buys and rents hundreds of thousands square kms of agricultural land in other countries and I would say they start making use of it. Planting on new land might eliminate losses from traditional regions. But when it comes to numbers from places like Canada, you might be right that the numbers are no reason to panic. Yet.


So if there are food shortages everywhere, is food being hoarded or directed to other purposes such as bioethanol on a scale that will result in shortages and eventually lead to revolutions?
Both could be true. Some people in power know what's coming and could be storing the food.

A globalised world is even more vulnerable and a manipulated supply and demand can crush farmers, create shortages and cause 'color revolutions'. A global cooling event would reduce the areas where food can be grown and strain a highly vulnerable system.
Good point, imo. All parties involved in trade and bankers on top of that are likely playing a very stupid game, not being able to predict its outcome.
 
I am not sure about this one. It's complicated. Better farming practices could also mean using more GMO fertilizers or new crop varieties which gives short-term rise in production.
Yes, it is complicated. There is the issue of more land coming into production. Russia is one country where this is happening. When the Soviet Union collapsed, 56000 hectares were left unused in Russia, Ukraine and Kazakhstan. These are now slowly coming into production along with areas in the far East of Russia. Russia has been very focused since 2005 on their agriculture and hence the big increases from their.

Another thing in these figures is that the land used for the different varieties changes year for year depending on demand and thus prices from the market. This has a big influence and causes dips or increases in production. As an example in the year 2000 the US produced about 4,5 MT of soybeans. In 2018 the US produced 123 MT.

Use of fertiliser can be an issue which it was for Australia this year, where a lack of fertiliser meant that fields suffered and so did yields.

The much talked about army worm in China was last time I calculated the figures some weeks ago, only going to impact the yields by 0.5%. This might have changed since, but let's see when the harvest is in.

Global population is increasing and with that comes the need for more food. This might also be a reason why Russia under Putin has put agriculture as a top priority so as to become an agricultural superpower. Exporting to nations who need help to feed their populations can be a good way to build relations apart from being a sign of humanitarian spirit. From what I gather, then the world do not have much in terms of food reserves, so a crisis can quickly arise if harvests fail for a number of years in a row.
 
Corn produce in the US was 366MT and due to massive rains, flooding, frost and delayed planting that figures is going to be quite a bit lower. How low remains to be seen. Bear in mind that around 40% of US corn goes to the ethanol industry so as to cut dependence on crude oil. 36% is used for feed (to animals), so if hunger was knocking on the door in the US, then US corn would be diverted towards food rather than running cars. Cars can after all run quite well without, though there is more virtue signalling to be gained from using corn.

Here is a chart as reference regarding corn production.
world-corn-production-metric_19.svg


Corn is harvested in the Northern hemisphere mostly in October, November, so there are just industry forecasts available.

In looking at China, there is this update from mid August:


ReutersAugust 12, 2019
BEIJING (Reuters) - China's agriculture ministry on Thursday said it was lowering its forecast for corn consumption in the 2019/20 crop year amid outbreaks of African swine fever across the country.

The ministry said corn consumption was now seen 2 million tonnes lower than last month's forecast at 280 million tonnes because a huge fall in the pig herd was reducing demand for feed. African swine fever is fatal to pigs, though it doesn't harm humans.

China has said its sow herd declined by a record 23.9% in May from a year earlier, but some estimate the number to be twice that level.

While demand will be lower, the country also planted less corn, the ministry said in its monthly crops report, thanks to a greater-than-expected shift in the type of crops being grown.

Beijing is encouraging less planting of corn in some areas in the far north and higher output of soybeans instead. This trend cut the estimated size of the corn crop by 920,000 tonnes to 253 million tonnes.

The ministry also said that southwestern Yunnan province continued to suffer from drought, and that both the sugar cane crop there and the sugar beet crop in Inner Mongolia were suffering from pests.

It did not change its forecast on sugar production, but said it would continue to monitor the impact of adverse weather and pests.

--------------
So China is expecting a harvest of 253 MT which is 4MT less than last year, but consumption is also lowered by 2MT. As mentioned above, less areas were planted with corn as soybeans are being promoted. This might have something to do with wanting to be less dependent on soyabean import from the US.

Brasil is another big grower of corn and the results have just come in for the season where harvest of corn is harvested in March and April...roughly. Here is a link to the growing seasons in Brazil and Argentina for those curious, though it is roughly 5-6 months later, though not always due to sommer and winter varieties and climatic conditions.
The result for the year 2018/2019 are:

Corn, cotton output push Brazil harvest to record

Brazil's grains and oilseeds crop rose by 6.4pc to a record 242mn metric tonnes (t) in the 2018-2019 harvest, boosted by increased corn and cotton output.

The total compared with 227.7mn t from last year's crop, the country's agricultural statistics agency Conab said in its final report on the season ended 30 June.

The corn harvest rose by 24pc to a record 100mn t in 2018-19 from the prior year. The final number was pulled higher by favorable weather conditions for winter corn, which accounts for nearly two thirds of all the country's cereal production.

Cotton lint output rose by 36pc to 2.7mn t, also a record, from the 2017-18 harvest. Conab cited attractive currency exchange rates and commodity prices as key factors for the acreage expansion, especially in the states of Bahia and Mato Grosso. Brazilian cotton producers sowed 1.61mn hectares (3.95mn acres) in 2018-19, a 38pc increase on the prior year.

Soybean output fell by 3.6pc to 115mn t, down from the prior harvest but still the second largest on record. The crop was impacted by hot, dry weather between December-January, an important period for development of the crop.

Output of wheat came in at 5.4mn t, nearly flat on the year, Conab said. Wheat imports were estimated at 7.2mn t for 2019, according to Conab. Brazil is a net importer of the cereal.

Brazil planted 63.2mn ha with grains and oilseed in the season ended in June.

The country is expected to export a record of 35mn t of corn in 2018-19, up by 47pc from the prior year, while soybean exports are expected to fall by 16pc to 70mn t, according to Conab. Cotton lint exports are forecast to rise by 64pc to 1.5mn t.

Brazil is the global top exporter of soybeans and the second in corn and cotton, behind only the US, according to the US Department of Agriculture.

Conab is due to release its first forecast on the 2019-20 crop on 10 October.

------
So Brasil has just had their 2 best year of soyabean harvests.

Argentina is also a big agricultural producer and also in the Southern hemisphere. It turns out they have just had their best harvest on record.


Argentina: record harvest for the 2018/19 season

The July report on agricultural estimations confirms the maximum historic volume. It also highlights the important production of maize and wheat.
Wednesday 24 July 2019

The Ministry of Agribusiness informs that the total harvest in the 2018/2019 agricultural season will reach 147 million tonnes, this entailing a record in the agricultural production of Argentina, according to the historic registers.

The Minister of Agribussiness of Argentina, Mr Luis Miguel Etchevehere, highlighted that “both maize and wheat will reach record productions of 57 million tonnes and 19.5 million tonnes, respectively. This reflects the parity between cereals and soya, that is basic for the sustainability of the production system and the care of our soils”.

He also reminded that after suffering the worst drought in 50 years, this feat is “the merit of the producers and the chain, that trusted and invested once more to achieve this historic occurrence”. “It is not only a quantitative nor isolated feat, but also a qualitative one, fruit of the rotation of crops, that allows us to think in a long-term process that will allow us to go on breaking these records”, Mr Etchevehere said.

The data are part of the last Agricultural Estimates monthly report, drafted by the Ministry of Agribusiness, that bases its estimation on objective analytical methods in which it deems that uncultivated land represents 1.8 million hectares, 5% of the Argentinian agricultural land.

-----

Like Brazil, Argentina also experienced a record harvest
. Argentina harvest of 57MT of corn is almost equal to Europes total corn harvest according to the chart above. Regarding discrepancies in the chart at the top of the post, then the figures for corn must be from the calendar year before. The last bit in the above article is also interesting as it shows that there is still a big potential for growth in Argentina with 5% uncultivated.
 
This is a great thread/discussion.
Nowdays technology gives an immense edge over circunstances when it comes to agriculture.

The 'other' side that should be considered is the effect that consciousness has on agriculture :cool2: but that is an off-topic for this thread.
Thank you for this research!
 
I found this link from 2017 about agricultural production in Russia. It talks about how Russia can benefit from a warming climate, but ignoring that there is a lot of information in it. The short version is that Russia under Putin has made agriculture a top priority back in 2005-2006 and the result is that they have now become an agricultural powerhouse. Below is the article linked and I will quote a few things of interest.


September 22, 2017

[...]
While many traders may be looking for a pop in short-term prices, the story of Russia is one that will resonate across the global markets in the years to come. Not only has Russia established itself as the largest exporter of wheat on the planet, but they are setting the stage for supremacy in the agricultural markets.
Don’t ignore the Russian bear.


The agricultural hook to this story is tied to the economic sanctions imposed by the United States on Russia. At a time that the U.S. Dollar had shown remarkable strength leading up to the Federal Reserve’s interest rate hikes last year, Russia’s ruble was struggling.
The lower Ruble was a boon for the export of commodities this year, mainly wheat. While Australia and the United States were hindered by drought conditions in main-growing regions, the Euro had pressed to two-year highs against the greenback. High production and lower prices were attractive to buyers.
But Russia had already made its move.
In July 2016 to June 2017, the country exported 27.8 million metric tonnes of wheat. This figure was more than the entire wheat exports of the European Union. It was the first time that Russia had topped the EU since the formation of the world’s largest economic bloc.
The country is also expected to pass the United States as the largest individual wheat exporter in 2017/18. The only other time that’s happened in history was 2 years ago.
Ask the average person with a slight understanding of global commodities, and they won’t associate food production with Russia. The first thing that people think of is oil and natural gas, the latter being an important bargaining chip in all relations with Eastern Europe.
But Russia – along with Ukraine and Kazakhstan (the RUK) – have become dominant forces in the global grain markets.

Tracking Russia’s Grain Rise
Back in 2005, the Kremlin said that agricultural would become a national priority. The nation blessed vertical integration and adopted western technologies to improve yields across the country.
As a result, we’ve seen a dramatic increase in wheat production over the decade.
A decade ago, back in the 2006/07 marketing year, the USDA projected that Russian wheat production would hit nearly 45 million metric tonnes.
In July 2017, the USDA projected that the country would produce 72.0 million metric tonnes for the 2016/17 marketing year. [1]. Two months later, in the September WASDE report, the USDA projected that Russia’s 2017/18 wheat output would hit 81.0 million metric tonnes. [2]
The total Russian harvest for all grains is pegged between 125 million and 127 million tonnes. [3]

This massive output accompanied drought in Australia and the United States and gave Russia a distinct advantage in selling wheat to countries like Egypt, Nigeria, and nearly all of Asia, including major importers Bangladesh, and Indonesia.
The growth has accelerated so quickly that Russia has experienced infrastructure challenges that will require increased investment. With a total grain production of 117 million metric tonnes in 2016, the nation has attracted large international trading houses like Olam International, Cargill, and Glencore.
Kansas State University reported last year that the combination of soil quality, government support, and proximity to Black Sea shipping points could reduce the cost of procuring grain to the Middle East by as much as 50% compared to other major exporting countries. [4]
SovEcon reported that Russia’s infrastructure – all of its rails and ports – have been working at maximum capacity. To accompany expected increases in agricultural output, the government has financed increased port capacity and storage. Infrastructure spending along the Black Sea is experiencing a rise in export terminals and silos. That said, SovEcon has predicted that bottlenecks and constraints to their supply chain will become more visible in the months ahead.
Given that companies engaged in the middle of the supply chain are expected to see very good returns this year, one should anticipate a rush of capital to relieve the stress in the region.
But it’s not just infrastructure at home that will aim to bolster Russia’s presence. Reportedly, the nation is discussing grain infrastructure projects in Egypt, which would entice and reward one of its largest customers.
Other projects have been rumored in Iran and other parts of the Middle East, where grain demand is expected to surge over the next few decades.
But there’s one other factor that makes you realize just how hellbent that Russia is on becoming now just an agricultural superpower but THE superpower.


But there are other areas of Russia, Ukraine, and Kazakhstan that will benefit from the combination of temperature changes and technological advancement.
Bloomberg reported earlier this month that roughly 140 million acres of cropland were abandoned in those three countries after the fall of the Soviet Union.
In the future, better technology, increased investment, and lower development costs could bring these lands back online.

The potential production figure is staggering. Moscow has said that it anticipated annual harvests of 150 million metric tonnes by 2030.
By 2050, Russia predicts it could see total harvests of 205 million metric tonnes.

Who Cares About Wheat Anymore?
What we do know is that corn and soybean acres are eating North and South America.
Subsidizing production by means of supporting ethanol mandates will continue to ensure corn gets planted in the Western Hemisphere on both sides of the equator.
For soybeans, a clear demand factor has emerged, and its name is Asia.
Leading the charge is China.
In the last 20 years, Chinese soybean imports have gone from just under 3 million tonnes to a forecasted 95 million tonnes in 2017/18.
Back in 2000/01 US soybean exports to China were a touch under 900,000 MT. That represented 20% of total US soybean exports.
In the 2017/18 marketing year, the US is expected to ship out about 61 million tonnes of soybeans. Roughly 35 million tonnes of that could be shipped to China alone. [Hence Trump's desire for the trade war not to last too as farmers could get hurt]
To be clear, US soybean exports to China, in less than 20 years, have increased nearly 4000%.
As a percentage of total exports, America’s dependence on China as a go-to soybeans market has increased three-fold.
While US and Brazil account for the vast majority of China’s soybean imports, Russia may have a hand in future trade.
Russia is expected to produce 3.9 million tonnes of soybeans this year.[5]
It would be their second consecutive record crop. Average yields only look to be 23.2 bushels per acre, but that’s 19% better than the 5-year average.

What Will Happen To Wheat Markets Now?
Russian wheat yields this year[2017] are pegged at about 25% above their 5-year average.
Currency factors will continue to play a major role in Russia’s ability to have a major hand in global grain markets.
Regarding production, global demand for specific crops will play a significant role in dictating what gets planted and harvested in Russia. Currency fluctuations will certainly be a factor in this but not as much as the demand factor.
While there are certainly geopolitical risks to consider, Russia has emerged as a country that has little to no intention of slowing grain production down.
While wheat production in the likes of Canada and the USA haven’t retreated, their ownership of the world wheat export market has declined substantially.
russia-wheat-exports-expoloding
Major wheat exporters the last 20 years and exports as a % of total production (click to zoom)

Comparably, Russia wheat exports will continue to tick ahead, assuming that infrastructure development can keep up.
If the eastern regions of Russia are opened up to farming, their share of global wheat export markets will likely only continue to grow.
Further, there continues to be growing chatter about more rail movement of wheat to Asia. COFCO, China’s state-grain buying agency has already publicly stated that it intends to buy 2 million tonnes of wheat from Russia every year.
Today, we already know that 40,000 MT of Kazakhstan wheat has been getting railroaded into China each month. [6]
Ultimately, it’s hard to see Russia’s grain production slowing down, especially considering how they continue to surprise us with bigger crops. Looking further out though, Russia isn’t likely to just have a significant impact on the wheat market, but others as well.
It’s clear that soybeans are the new wheat from a global demand perspective (or at least in Asia, as driven by China). It took Russia a few decades to get their act together on wheat, but now they’re a major player.
Could they do the same thing in the soybeans market in half the time?
Yes, if export infrastructure development and arable acreage expand.

What seems certain though is, given the trend, we could be shocked at next year’s numbers out of Russia again.
 
A quick overview can be seen from USDA which has figures that vary slightly from other sources. Perhaps because of not going by the calendar year, but from what is suspect is July to July.

World production (million tonnes):
Wheat:
2017/2018: 762
2018/2019: 731
2019/2020: 768 (estimate)

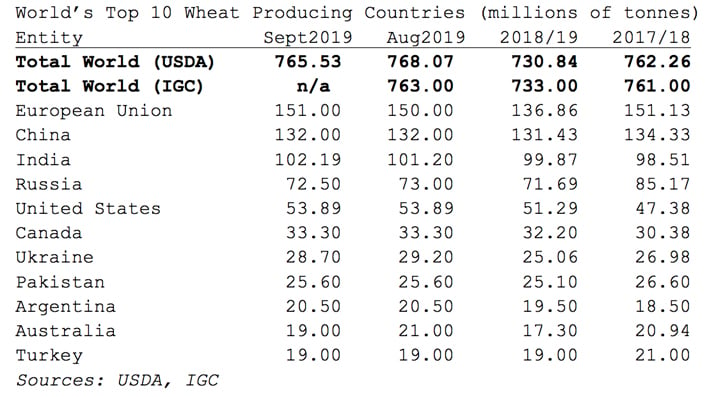
A few days ago, the forecast for the world total wheat production came in and got adjusted downward from the August numbers. Despite the headline it is not all bad news as the total wheat production is still a record:


Global wheat production to decrease says USDA
By Glen Hallick - MarketsFarm, MarketsFarm

Published: September 13, 2019

The USDA has now projected 765.53 million tonnes of wheat to be produced in 2019/20, according to the department's World Agriculture Supply and Demand Estimates (WASDE) released Sept. 12. That's down from the 768.10 million tonnes forecast in the August WASDE. | File photo
WINNIPEG, (MarketsFarm) – In the latest supply and demand report from United States Department of Agriculture (USDA), the global wheat forecast was revised downward due to difficult weather conditions.

The USDA has now projected 765.53 million tonnes of wheat to be produced in 2019/20, according to the department’s World Agriculture Supply and Demand Estimates (WASDE) released Sept. 12. That’s down from the 768.10 million tonnes forecast in the August WASDE.
In comparison, the International Grains Council (IGC) projected global wheat production at 764.00 million tonnes in its August 29 report. That was up 1 million tonnes from the IGC’s July report.

In the USDA’s September report, the department reported its estimate for global beginning stocks for the 2019/20 crop year increased by 0.06 per cent to 277.24 million tonnes. Ending stocks increased 0.04 per cent from August to September at 286.51 million tonnes.
Hot and dry conditions resulted in many of the USDA’s revisions.

That included the projection for Germany at 23.35 million, of which the USDA lowered by 600,000 tonnes. However, despite those same conditions, the French wheat crop increased by 1.50 million tonnes and is expected to reach 40.20 million.

The European Union remains the world’s top producing region with 151.00 million tonnes, up 1.00 million from the August WASDE.
Of note, if French and German production was accounted for separately rather than the EU as one entity, the countries would rank fifth and ninth respectively in the world.

The USDA lowered its estimates for Russia and Ukraine by 500,000 tonnes each from the August WASDE, also due to hot and dry weather. Russia is expected to produce 72.50 million tonnes and Ukraine 28.70 million.

Such conditions took a greater toll on Australia’s wheat crop, with an estimated decrease of 2.00 million tonnes, with 19.00 million now expected.
top10-wheat-707.jpg

----------
Just repeating, the world wheat production for 2019 was a record high!


Russia had the 3rd highest wheat harvest.

Russia had before 2016 never produced more than 64MT
and as a matter of fact most often a lot less as can be seen here. Since then the harvest have been above 70MT per year. Here are the figures from the above link:

2016: 73.3MT
2017: 85.9MT (above it says 85.17, so there is a small discrepancy)
2018: 71.7MT
2019: 72.5MT (forecast, though the harvest should be finished by now, so it would just be a fine tuning of those numbers).

France had the 3rd highest wheat harvest in history only surpassed by 42.8 MT in 2015 and 40.3MT in 2011.
Ukraine had their best year ever beating the previous record harvest in 2015 with a handy 2,2MT.
India had their best year ever too after last year which held the previous record.
China had their 2nd best harvest. China's 6 best wheat producing years have been the last 6 years!

Repeated record harvest does not come totally by chance, but involves long term planning, research, patience, strategic management and in some cases cultivating unused agricultural land. Regarding the weather then my father who was a farmer used to say that one should not be a farmer if one could not get to terms with nature and that weather can be unpredictable, but instead take the good years with the bad. It can teach a bit of humility, patience and of taking the long view.

In a link from a few days ago, which I can't find, I read that Iran, Iraq and Syria also have had good wheat harvests due to more rain. I did find another link from Iran about the harvest. It says that they again will be self-sufficient with wheat for the 4th year in a row. They did have floodings in March, reported on Sott, but the flooding was offset by other areas having better harvests resulting in an overall good harvest.


Iran’s wheat autarky on track despite severe floods
Tue May 28, 2019 10:37AM [Updated: Tue May 28, 2019 10:53AM ]

Wheat is the dominant cereal in Iran, accounting for almost 70 percent of total cereal production.
For the fourth year in a row, Iran’s wheat harvest is enough to make it self-sufficient in the strategic crop, an official was quoted as saying Tuesday.
Better rainfall across Iran will offset the loss of crops from unprecedented flash flooding
in some provinces in March, head of the government program to buy wheat from farmers Esmail Esfandiarpour said.
Under the autarky plan, the government makes purchases from wheat growers at guaranteed prices. Esfandiarpour said he expects a 800% rise in such buys in some provinces, which will help Iran’s self-sufficiency in wheat recur for the fourth year.

Deputy Agriculture Minister Abbas Keshavarz said on Monday Iran’s total wheat harvest is estimated to reach 14.5 million metric tons this year. The government expects to buy 11.5 million tons of wheat from local farmers, he said.
“Our prediction before the floods was to harvest about 15.5 metric tons of wheat, but 65,000 hectares of farmland in Khuzestan province went under water,” Keshavarz added.
Several southern provinces are also grappling with a severe locust outbreak. Local reports have said a very small swarm eats as much in one day as about 35 000 people.
The UN Food and Agriculture Organization (FAO) said in February that a locust outbreak in Sudan and Eritrea was spreading rapidly along both sides of the Red Sea to Saudi Arabia and Egypt.
Good rains, it said, have allowed generations of locust breeding since October 2018, leading to a substantial increase in locust populations and the formation of highly mobile swarms.

According to state officials, the country usually maintains a carryover from previous wheat crops and past stocks which cover any shortfall.
Irrigated wheat covers only one-third of the total wheat area, thus the bulk of the wheat crop depends on seasonal precipitation. Most of the rain-fed wheat crop is concentrated in the northwest.
According to Esfandiarpour, Iran’s use of improved seed technology over the past five years has boosted the country’s self-sufficiency in wheat by more than 30.
Largely self-sufficient in wheat a decade ago, Iran emerged as one of the world’s biggest importers a few years ago but a raft of measures taken by the government is returning the country to where it was.


So globally there does not appear to be a wheat scarcity just yet unlike what Adapt 2030 said the other day.


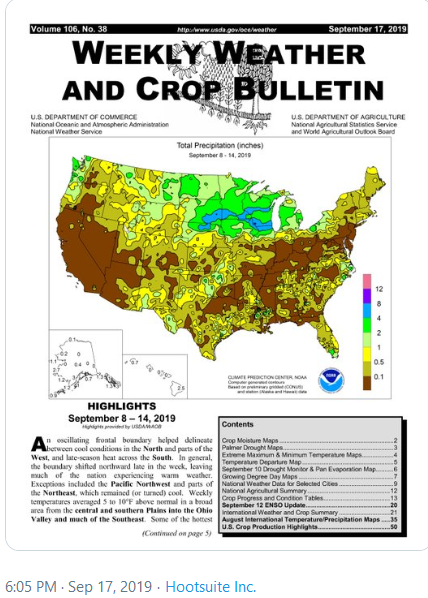
https://static.producer.com/wp-cont...26.485591013.1568662915-1166354026.1566911849
 

PDF / 50 Pages


Experts SovEkon: falling wheat prices ends - https://mailchi.mp/sovecon.ru/c9j
Last week, export prices for Russian wheat continued to decline, according to SovEcon monitoring. At the end of the week, wheat quotes 12.5% fell 1.5 to $ 185 (FOB deep water) amid continued competition with other regions. The pace of decline is slowing, in the near future we expect stabilization and growth of the market.

The Russian wheat market again closed the week in the red. Export quotes fell, on the domestic market, on average, wheat of 3 cl in the European part fell by 25 rubles to 10 425 rub / t, 4 cl - by 125 rub to 10 075 rub / t, 5 cl - by 125 rub to 9500 rub / t . The most noticeable decrease was observed in the Volga region, which is completing harvesting. High rates continue to decline in Siberia.

On the foreign market, the situation is beginning to change. December contracts in Chicago and Paris broke the bearish trend that has been in effect in the market in recent months. As a result of the week, quotes increased by 2-4%. SovEcon experts believe that the global wheat market has reflected all the bearish news from the Northern Hemisphere and is close to finding the bottom, or has already found it.

If this assumption is true, in the near future it will begin to support export quotations for Russian wheat, and followed by the domestic market.

What does it mean?

It seems that the decline in the export market is ending, and growth is ahead of us. However, one should not count on its high pace; competition in the world market remains intense.


9/13/2019
SHANGHAI, Sept 13 (Reuters) - China will exempt some agricultural products from additional tariffs on U.S. goods, China's official Xinhua News Agency said Friday, in the latest sign of easing Sino-U.S. tensions before a new rounds of talks aimed at curbing a bruising trade war.
The United States and China have both made conciliatory gestures, with China renewing purchases of U.S. farm goods and U.S. President Donald Trump delaying a tariff increase on certain Chinese goods.

China had imposed additional tariffs of 25% on U.S. agricultural products including soybeans and pork in July 2018. It raised tariffs on soybeans by a further 5% and on pork by a further 10% on Sept. 1.

"China supports relevant enterprises buying certain amounts of soybeans, pork and other agricultural products from today in accordance with market principles and WTO rules," Xinhua said, adding that the Customs Tariff Commission of China's State Council would exclude additional tariffs on those items.

China has "broad prospects" for importing high-quality U.S. agricultural goods, Xinhua reported, citing unnamed authorities.
"It is hoped that the U.S. will be true to its words and fulfill its promise to create favourable conditions for cooperation in agricultural areas between the two countries," the report said.

Before the announcement of additional tariff exemptions, Chinese firms bought at least 10 boatloads of U.S. soybeans on Thursday, the country's most significant purchases since at least June.

Lower-level U.S. and Chinese officials are expected to meet next week in Washington before talks between senior trade negotiators in early October. President Donald Trump said on Thursday he preferred a comprehensive trade deal with China but did not rule out the possibility of an interim pact.


9/13/2019
Snip: 7-8 minute Read
Weather forecasts continue to call for mostly above normal temps and normal to above normal precip for most of the Corn Belt.

It will be wetter in the northern Corn Belt the rest of this week than the southern half, and the National Weather Service has the forecast warmer and wetter than many private forecasters.

Temps are forecast to cool seasonably into mid and late September, but most forecasters still see above normal temps persisting. That's good for crops, as we need extra time beyond the normal frost date to reach maturity of late season row crops.

News came out Monday that prevented planting payments for farmers affected by weather, this year, will be eligible for an additional 10% of indemnity payments. Note that isn't another 10% coverage or PP percentage payment, it is simply adding 10% to your indemnity.

For example, if you got $300/acre corn PP payments, you could get another 10% of that ($30/acre) from the FSA. If you have the harvest
revenue option, you could also get another 5% enhancement of your indemnity payment.

Signup begins this week, but many FSA offices may not be ready yet. For farmers who struggled to plant crops late this spring (even into June for corn), they may now regret not taking an enlarged PP payment and instead plant the crop. In many cases, cobs are small, the soils were too wet all year, and the crop will struggle to make maturity (and then it'll cost a fortune to dry down the below average crop this fall).

Crop progress numbers showed that in spite of relatively warmer weather recently, we still lag normal progress by quite a bit.

Corn is only 89% dough (8% behind normal), 55% dented (22% behind normal), and 11% mature (13% behind normal). Also this week, corn conditions dropped a huge 3% to only 55% rated G/E, an interesting change for a week of weather that was mostly favorable for the crop (are they just admitting ratings were too high?).

Soybeans are 92% podding (7% behind normal), with conditions at 55% this week (unchanged from last week). Our yield model for corn dropped 1.7 bushels to 173 bu/acre (a loss of 130 mb of production) on the big drop in conditions. Is this a realization finally that some corn won't make maturity? Soybean yield models rose a small 0.17 bu/acre to 48.13, still below USDA's number.

Other crops are not so far behind, with sorghum 97% headed (1% behind normal), 65% coloring (9% behind normal), and 27% mature (10% behind normal), and 22% harvested (2% behind normal). However, sorghum ratings are quite high at 68% G/E, up another 1% this week and well above last year's 53% rating. Cotton is actually somewhat advanced, with 43% bolls opening (6% ahead of normal) and 7% harvested (1% ahead).

HRS wheat harvest is advancing, now 71% complete (16% behind normal). But, quality is a real issue, with both falling numbers and vomitoxin an issue in the harvested grain.

Falling numbers are discounted more heavily by the marketplace than the crop insurance allowance in most cases, with crop insurance only discounting from 5-15.5% production from 299 on down to 200 falling numbers. But, once you fall below 200 falling numbers, it is a market based discount for crop insurance.

Vomitoxin is more complicated, but farmers are treated much better with crop insurance discounts than falling numbers. If farmers are discounted for vomitoxin and sell within 30 days of the end of the insurance period, they get a market discount. If unsold, it goes by a chart which is very favorable from 2-10 ppm, with from 22% to 45% reductions in the production to count.

In fact, so far it seems the chart is even more favorable than market discounts so the crop insurance treats vomitoxin much more favorably than falling numbers. With these discounts combined with the 12.5% drop in HRS prices (from $5.77 to $5.05 this fall), there will likely be many HRS wheat claims IN SPITE of yields better than average. If you don't understand this, give our office a call or email and we can explain it to you.

Barley harvest is 82% complete (10% behind average), with oat harvest only 89% complete (6% behind normal).

Soil moisture levels are still quite high at 67% adequate/surplus topsoil (down 2% this week), and subsoil 70% rated adequate/surplus (down 1% on the week). These are still historically high soil moisture ratings for fall, and now its becoming an issue where many soils might be too wet to support harvest equipment.

That could spell lots of problems for harvest, especially root crops like potatoes and sugarbeets. But it's also difficult to support semi's or tandem trucks full of corn, soybeans, or wheat, too. That might make it a difficult fall in areas with excessive rains.
 
Probably the last post about wheat for the moment as the main data is in for the year. I just wanted to mention Egypt, which is the biggest importer of wheat, something in the order of about 12MT. But the also grow their own wheat, just not enough.

The wheat harvest finished in June and they had a good year, slightly above average.


Egypt
Reference Date: 22-May-2019

1.jpg


2.jpg


Increased wheat harvest forecast in 2019
The 2019 wheat harvest started in early May and will be completed by June. Harvest of the minor barley crop is about to be completed.

Cereals are grown on irrigated fields, yielding relatively stable harvests. About 1.37 million hectares were planted with wheat in the 2018/19 crop year, slightly above the 1.3 million hectares planted in the previous year encouraged by higher Government procurement prices. The 2019 wheat production is forecast at 9.2 million tonnes, up by 5 percent compared to last year and slightly above the average on the account of favourable winter weather conditions, increased area and continued use of improved seeds. The 2019 cereal production is forecast at 22 million tonnes, about the same as in 2018, but about 6 percent below the average due to the decline in rice production as the Ministry of Water Resources and Irrigation continues to set limits on the area planted with rice to save water. Farmers not complying with the instructions face fines. Despite constraints on the planted area, new domestically developed early maturing rice varieties have the potential to increase yields.

The 2019 wheat procurement season runs from 15 April to 15 June and the General Authority for Supply Commodities (GASC) aims to purchase 3.7 million tonnes, up from 3.3 million tonnes purchased in the previous year. Until 12 May, some 1.6 million tonnes of wheat were purchased. The procurement prices are derived from a moving average of prices paid for imported wheat in the previous two months. The 2019 procurement prices announced in March 2019 range from USD 251-263 per tonne (EGP 655-685 per ardeb or 150 kg) based on quality and moisture levels, up from USD 213-224 per tonne (EGP 570-600 per ardeb or 150 kg) applied in 2018.

Cereal import requirements forecast slightly above average
The country remains the world’s largest wheat importer. Wheat imports for the current 2018/19 marketing year (July/June) are estimated at 12.5 million tonnes, about the same as the previous year and about 15 percent above the average of the last five years. In the 2019/20 marketing year, wheat import requirements are expected to remain at the same level. The three largest suppliers in the 2018/19 marketing year (up to April 2019) were the Russian Federation (7.2 million tonnes), Ukraine (1.6 million tonnes) and Romania (1 million tonnes).

The overall cereal import requirements in the 2018/19 marketing year (July/June) are forecast at about 22.5 million tonnes, about the same as in the previous year and 10 percent higher than the five‑year average.

Food price inflation eased in April 2019
The effects of increased energy and transportation prices, which pushed food inflation up to 20 percent in October 2018, are leveling off. In April 2019, the food price inflation reached 13 percent year on year, with a slight decrease from the 15 percent recorded in March. The decrease in food price inflation was supported by Government market intervention providing additional supplies of food items, particularly meat, fruit and vegetables before the start of Ramadan.

About 70 million of the country’s 92 million people benefit from a subsidy card programme which entitles them to EGP 21 (USD 1.16) worth of goods monthly in addition to five loaves of bread per day at a EGP 0.05 per loaf (USD 0.01) – less than one-tenth of the actual cost. Bakeries are subsidized for the difference in costs, currently about EGP 0.60. Under the current systems, beneficiaries can convert their unused “bread quota” into points to be spent on 44 selected food products sold in State-owned or partnered private shops. For the 2018/19 fiscal year (July/June), the Government allocated EGP 86 billion (USD 4.8 billion) for bread and food subsidy schemes, up by EGP 1 billion compared to the 2017/18 allocation. About half of the allocation is earmarked for the bread subsidy programme.​


----

Rice which is water intensive was down by a good 8% as water irrigation to the rice farmers was being limited by the government.
 
Back
Top Bottom