The Ice Age Cometh! Forget Global Warming!

Hurricane Size Comparison Sep 9, 2017
We compare the sizes and power of hurricanes, tornadoes, typhoons & cyclones, from a tropical storm to a category 5 hurricane such as Hurricane Irma, Hurricane Andrew & Hurricane Katrina, and even go beyond what you'd expect!

Please take note: The size indicated here is the maximum diameter based on Meteorologist calculations (Sourced from National Hurricane Center, National Oceanic & Atmospheric Administration & NASA, or own mapping estimates based on images if no official figures are given. It is not entirely accurate, but it gives a good scale of the sizes of certain tropical storms.

Snow, High Winds Seen Atop Mount Washington
Published on Sep 2, 2017

Snow Reports and Snow Forecasts for Switzerland.
Covering the period from Tuesday 12th September 2017.
https://www.j2ski.com/snow_forecast/Switzerland/

Summary for France:
https://www.j2ski.com/snow_forecast/France/

Summary for Italy:
https://www.j2ski.com/snow_forecast/Italy/

Spain Snow Report:
https://www.j2ski.com/snow_forecast/Spain/

Snow Forecast for La Mongie (Hautes-Pyrénées)
https://www.j2ski.com/snow_forecast/France/La_Mongie_snow.html

Austria Snow Report:
https://www.j2ski.com/snow_forecast/Austria/

Australian Snow Reports:
https://www.j2ski.com/snow_forecast/Australia/

More snow for the Alps Updated:
8.45am Monday 11 September 2017 -
https://www.weathertoski.co.uk/weather-snow/
There was further snow across parts of the Alps this weekend, which is great news for the glaciers after an exceptionally warm summer.
 
Aeneas said:
As those who have followed SOTT knows, then Scandinavia has not had much of a summer. I was curious to see what the verdict was from DMI (Danish Meteological Institute) about the Summer 2017. They had this to say:
_http://www.dmi.dk/nyheder/arkiv/nyheder-2017/august/solfattigste-sommer-i-17-aar-vaadeste-i-6/
[...]
DMI is known for having changed their methodology to fit more the version of Global warming and 'hide the decline. This could just be an example of that.

Thank you Aeneas for your analysis. One wonders if their reluctance to adopt the 1981-2010 data reflects internal disagreements, forgetfulness, missing data, or some agenda as you suggest, Perhaps if you write a mail to Niels Hansen and express your point about the new WMO normal, they will consider it. My impression is they appreciate alert readers. However, it may be a good idea to save a copy of the old normal. In any case, DMI has a front row seat to the developement in the Arctic and the air was not particularly warm.

In a recent article only published in Danish, as far as I can sea, they write the arctic sea ice has received first aid from a cold summer. In a slightly improved machine translations it reads as follows where two illustrations have been attached and the text below put last.
_http://www.dmi.dk/nyheder/arkiv/nyheder-2017/september/havisen-fik-foerstehjaelp-af-kold-sommer/ said:
Artic ice received first aid from cold summer
In a short period of time during Summer there are plus degrees in the central Arctic. It changes the way the ice responds significantly.

The sea ice was weakened and vulnerable before the end of the melting season, but was temporarily saved by a cold summer in the Arctic.

The sun is low in the horizon at the north Pole, and the temperature in the glaciated area has dropped below the freezing point. Nevertheless, the melting continues for the ice at the lower latitudes along the edge of the arctic sea ice, which is on its way toward its annual minimum in the distribution in the middle of September.

"The weather conditions during the Summer has once again been critical for the ice's health," says ice researcher, Rasmus Tonboe.
"The Summer in the Arctic was marked by minor depressions with a cold core. It has given relatively cold weather above the ice, avoiding a record low spread in the year".

A repetition of 2016
In the fall of 2016, it became clear that the arctic sea ice would get weakened in the melting season 2017. It did, but the cold weather in the polar area has therefore slowed down the net melting.

It does not mea however that the ice is in recovery. There are missing huge amounts of ice in the Beaufort Sea and in the Tjukter Sea which back in the 1980s was covered with old and thick ice.

"The situation now is very similar to that of last year at the same time. The temperatures in the sea that surrounds the ice is up to 4 degrees warmer than normal in some places. It is high. It is especially Baffin Bay, Hudson Bay, and in the East Siberian Sea, which is warmer than they used to be. In the East Siberian Sea the water temperature up to 10 degrees. It is quite unusual," says the ice researcher.

The warm water around the ice in the Arctic is contributing to the continued melt for a few more weeks, but already now there are lurking new problems.

"We have a situation that is very similar to the from 2016. Also here was the water temperature high, and there was more open water than usual. If it repeats itself this year, and it seems to, then we get again a stunted and slow growth of the ice through the fall and going into 2018 with a weakened and vulnerable ice," concludes Rasmus Tonboe.

The arctic loses 94.000 km2 per year

Rasmus Tonboe, has previously analyzed the sea ice in the period from 1978 to today. His data shows that the area of the arctic sea ice annual decrease with 94.000 km2 of the summer minimum of sea ice in September. 94.000 km2 is more than the double of Denmark's land area.

The sea ice in the Arctic is important for the climate, because it has a high so-called albedo. High albedo means that ice reflects large amounts of sunlight back out into space, so it does not convert to hot. When the ice is gone, it is replaced by the dark ocean surface. The sea surface reflects very little sunlight, but allows instead a large part of the light to be converted into heat. The heat of the water has the potential to melt even more sea ice, thus amplifying the process.

Since 2007, the arctic ice coverage in Summer has remained at a level significantly lower than in the 1970's, 80'ies and 90'ies. The lower level is a consequence of the rising temperature in the Arctic and general thinning of the sea ice. Climate models suggest that the trend will continue, and that we are already in the middle of the 21. century is experiencing its first ice-free summer in the Arctic.

Text to attached pictures from the DMI website
1)
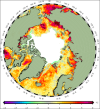
The ocean temperature in the Arctic 7. september 2017, expressed as deviations from the normal. It is evident, that the water is relatively warm. Graphics from the _ocean.dmi.dk. Click for big version.

2)
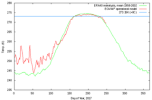
The temperature (red curve) in the Arctic in 2017. In the course of the winter and up to ca. day 120 (1. may), it was much warmer than normal (green curve). In turn, it was then a bit cooler over the summer. Graphics from the _ocean.dmi.dk. Click for a larger version.
Perhaps what influences the scientists at DMI is more the arctic ice than a not so warm summer in Denmark.
 

Attachments

  • Arctic sea temperatures September 7, 2017.png
    Arctic sea temperatures September 7, 2017.png
    158.4 KB · Views: 192
  • Temperature in the Arctic 2017.png
    Temperature in the Arctic 2017.png
    21.2 KB · Views: 186
Re: Solar activity to fall by 60% in 2030-40?

The sun fired off yet another powerful solar flare yesterday (Sept. 10), its seventh in seven days.

Monster Solar Flare Marks 7th Powerful Sun Storm in 7 Days
https://www.space.com/38115-sun-monster-solar-flares-seven-days.html?utm_source=notification

The flare, which peaked at 12:06 EDT (1606 GMT), covered North and South America in high-energy light. The National Oceanic and Atmospheric Administration's Space Weather Prediction Center (SWPC) released a statement that warned of strong, high-frequency radio blackouts and navigation-system disruption, potentially lasting up to an hour.

Like the six other flares observed since Sept. 4, this one came from a sunspot known as Active Region (AR) 2673 , which is currently turning away from Earth and will soon be out of sight.

There are three categories of solar flares, and Sunday's was the highest classification: an "X" event. Two of the other recent flares were also X-class, including Wednesday's (Sept. 6) X9.3 flare, the strongest solar blast in 12 years.

The SWPC's warning also asked astronauts aboard the International Space Station to take special precautions, because they're above most of Earth's atmosphere and therefore are at risk of exposure to harmful radiation. The warning discouraged astronauts from performing spacewalks just after the flare, for example.

Like many powerful flares, Sunday's was accompanied by a coronal mass ejection (CME), a huge cloud of superheated solar plasma that races through space at millions of miles per hour. AR 2673 isn't pointing directly at Earth anymore, but this CME may still give the planet a glancing blow, potentially supercharging the northern lights on Wednesday night (Sept. 13), according to Spaceweather.com.

The solar activity seen this month comes as a bit of a surprise, as the sun is currently entering solar minimum, a quiet portion of the star's roughly 11-year cycle of change.
 
thorbiorn said:
Thank you Aeneas for your analysis. One wonders if their reluctance to adopt the 1981-2010 data reflects internal disagreements, forgetfulness, missing data, or some agenda as you suggest, Perhaps if you write a mail to Niels Hansen and express your point about the new WMO normal, they will consider it. My impression is they appreciate alert readers. However, it may be a good idea to save a copy of the old normal. In any case, DMI has a front row seat to the developement in the Arctic and the air was not particularly warm.

Interestingly, I did write to him a few years ago pointing out some discrepancies, but received no answer back. So I am more inclined to think that the DMI is very much on the AGW bandwagon. Also they are interested in the weather in Denmark, which is clear when one reads last year resume which was quite detailed and also mentioning the number of tropical nights there had been in Denmark. Tropical nights are defined in DK as being a 24 hour period where the temperature did not go below 20° C. This year there was no mention of it which is not surprising if one considers that there is an agenda as there were no tropical nights in DK this summer. Otherwise that in itself would be newsworthy.


thorbiorn said:
In a recent article only published in Danish, as far as I can sea, they write the arctic sea ice has received first aid from a cold summer. In a slightly improved machine translations it reads as follows where two illustrations have been attached and the text below put last.
_http://www.dmi.dk/nyheder/arkiv/nyheder-2017/september/havisen-fik-foerstehjaelp-af-kold-sommer/ said:
Artic ice received first aid from cold summer
In a short period of time during Summer there are plus degrees in the central Arctic. It changes the way the ice responds significantly.

The sea ice was weakened and vulnerable before the end of the melting season, but was temporarily saved by a cold summer in the Arctic.

The sun is low in the horizon at the north Pole, and the temperature in the glaciated area has dropped below the freezing point. Nevertheless, the melting continues for the ice at the lower latitudes along the edge of the arctic sea ice, which is on its way toward its annual minimum in the distribution in the middle of September.

"The weather conditions during the Summer has once again been critical for the ice's health," says ice researcher, Rasmus Tonboe.This is also a common strategy that a have noticed. When it is cold, it is due to weather, when it is warm, it is due to global warming
"The Summer in the Arctic was marked by minor depressions with a cold core. It has given relatively cold weather above the ice, avoiding a record low spread in the year".

A repetition of 2016
In the fall of 2016, it became clear that the arctic sea ice would get weakened in the melting season 2017. It did, but the cold weather in the polar area has therefore slowed down the net melting.

It does not mean however that the ice is in recovery. There are missing huge amounts of ice in the Beaufort Sea and in the Tjukter Sea which back in the 1980s was covered with old and thick ice. Heavens forbid that we might get to think that the ice is in recovery. So, one can always go far enough back into the past and find a time when there was more ice in certain areas. Heck, if needed we will just go back 20000 years to prove our point of Global warming, manmade of course.

"The situation now is very similar to that of last year at the same time. The temperatures in the sea that surrounds the ice is up to 4 degrees warmer than normal in some places. It is high. It is especially Baffin Bay, Hudson Bay, and in the East Siberian Sea, which is warmer than they used to be. In the East Siberian Sea the water temperature up to 10 degrees. It is quite unusual," says the ice researcher.
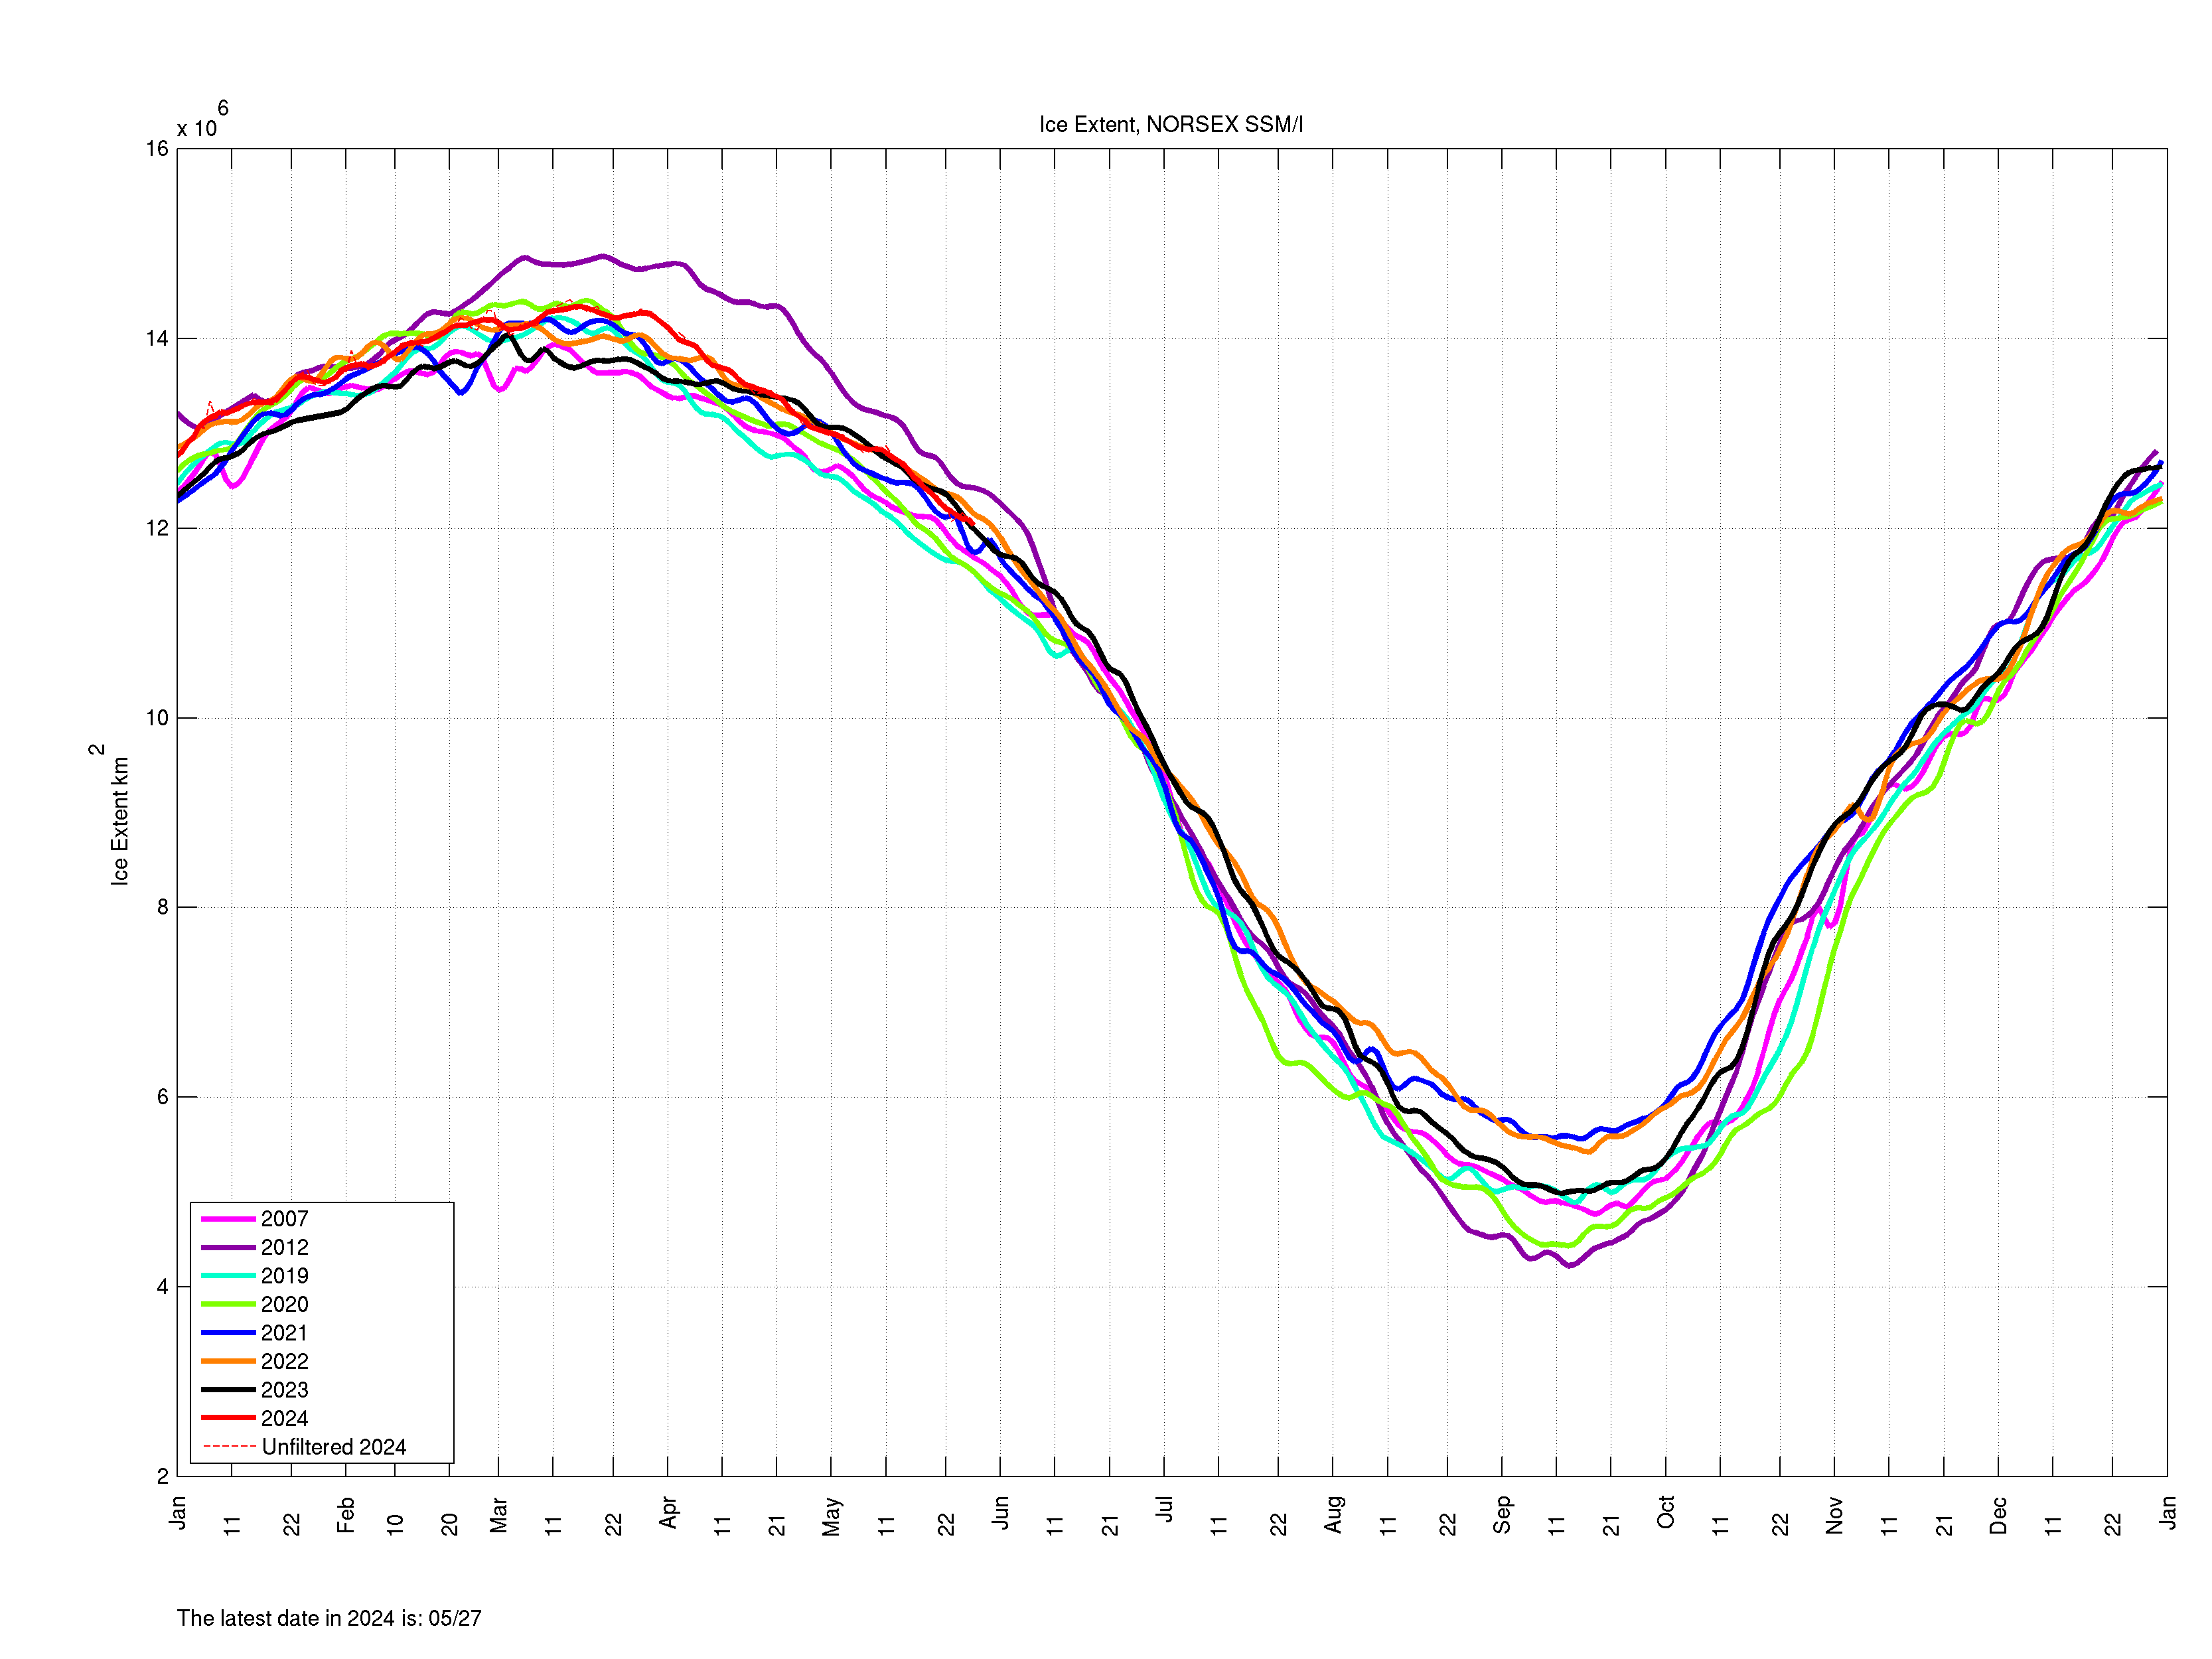
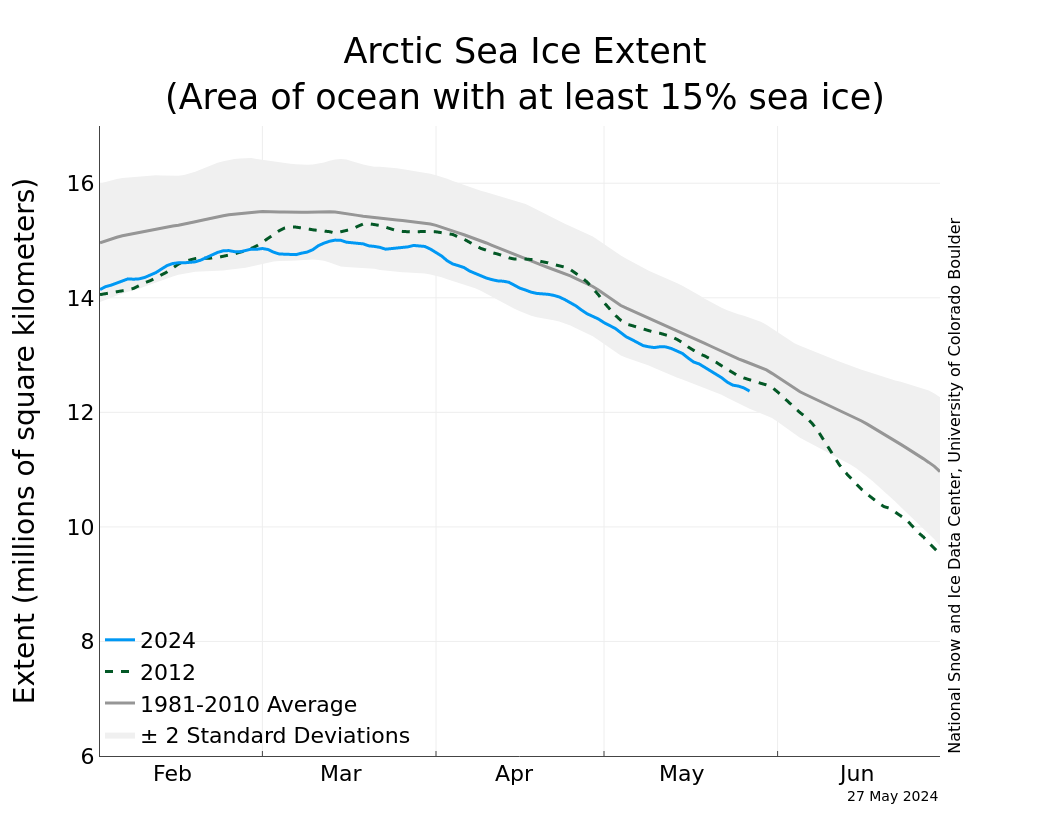
Very similar, he says? Did he go into winter hibernation early and thus didn't look at the recent maps of ice melt compared to last year? It appears that there are around a few hundred thousand sqkm more ice this year than last year.
ssmi_ice_ext.png


N_stddev_timeseries.png


_http://www.dmi.dk/nyheder/arkiv/nyheder-2017/september/havisen-fik-foerstehjaelp-af-kold-sommer/ said:
The warm water around the ice in the Arctic is contributing to the continued melt for a few more weeks, but already now there are lurking new problems.

"We have a situation that is very similar to the from 2016. Also here was the water temperature high, and there was more open water than usual. If it repeats itself this year, and it seems to, then we get again a stunted and slow growth of the ice through the fall and going into 2018 with a weakened and vulnerable ice," concludes Rasmus Tonboe.

The arctic loses 94.000 km2 per year

Rasmus Tonboe, has previously analyzed the sea ice in the period from 1978 to today. His data shows that the area of the arctic sea ice annual decrease with 94.000 km2 of the summer minimum of sea ice in September. 94.000 km2 is more than the double of Denmark's land area.

The sea ice in the Arctic is important for the climate, because it has a high so-called albedo. High albedo means that ice reflects large amounts of sunlight back out into space, so it does not convert to hot. When the ice is gone, it is replaced by the dark ocean surface. The sea surface reflects very little sunlight, but allows instead a large part of the light to be converted into heat. The heat of the water has the potential to melt even more sea ice, thus amplifying the process.

Since 2007, the arctic ice coverage in Summer has remained at a level significantly lower than in the 1970's, 80'ies and 90'ies. The lower level is a consequence of the rising temperature in the Arctic and general thinning of the sea ice. Climate models suggest that the trend will continue, and that we are already in the middle of the 21. century is experiencing its first ice-free summer in the Arctic.
It has to have the prediction of no ice in the mid century. It is a subtle bit of propaganda that is meant to stay with the readers, me thinks
Text to attached pictures from the DMI website
1)
The ocean temperature in the Arctic 7. september 2017, expressed as deviations from the normal. It is evident, that the water is relatively warm. Graphics from the _ocean.dmi.dk. Click for big version.

2)
The temperature (red curve) in the Arctic in 2017. In the course of the winter and up to ca. day 120 (1. may), it was much warmer than normal (green curve). In turn, it was then a bit cooler over the summer. Graphics from the _ocean.dmi.dk. Click for a larger version.
Perhaps what influences the scientists at DMI is more the arctic ice than a not so warm summer in Denmark.

The sea ice article also tries to hide how much more or less ice there is this year compared to 2007 or just last year and does not mention the extent. It might be interesting if there is equal amount of ice this year compared to 2007. It is true that there has been a loss since 1978, but that does not reflect what is happening now and what has happened in the last decade. It would be more of interest to know how much has the average ice loss been in the last decade.

Greenland has also seen a net gain this year, which should be newsworthy for DMI who keeps a track of it. It should be even celebrated by them as they believe that global warming is a catastrophe. But instead of popping the champagne bottles, they hide this celebratory event. So I am inclined to judge them by their fruits rather than speculate that they really mean well. They have a job and know where the funding comes from, so it pays for them to follow this AGW agenda. One can not exclude that there aren't perhaps some in DMI who can see what is going on, but they are keeping a low profile.
 
Rapid climate changes across northern hemisphere in the earliest Middle Pleistocene


By studying climate changes that took place thousands of years ago, we can better understand the global climate system and predict the Earth's future climate. A multi-organization research team led by Professor HYODO Masayuki (Research Center for Inland Seas, Kobe University) has discovered evidence of rapid climate changes on a millennial-to-centennial scale that occurred 780 to 760 thousand years ago. The findings were published on August 30 in Scientific Reports.

During the 2.6 million year Quaternary Period, the climate repeated a glacial and interglacial cycle, caused by changes in the geographical distribution of solar radiation due to orbital changes including those of the Earth's orbit and the tilt of its axis. These changes are regarded as "Milankovitch cycles", over 20,000 years in period. But in the Holocene and last glacial periods, a number of millennial-to-centennial scale climate changes have been observed. Such rapid climate changes have scarcely been reported before the last glacial period.

In the interglacial period between 780 and 760 thousand years ago, the Earth's orbital patterns were quite similar to the current (Holocene) era, so this interglacial climate could be useful in predicting the Earth's future climate.

The research team focused on the Kazusa Group (Chiba prefecture, Japan), which has the fastest sedimentation rate in the world for strata of that era, and obtained high resolution paleoceanic environmental records every 10 years. When combined with records from Osaka Bay and the North Atlantic, they found evidence of multiple instances of rapid warming and cooling across all three regions at the same time. The data includes the unusual phenomenon of a rapid temperature rise with cyclicity suddenly finishing with a cold event. The cold events occurred at the same time as the great iceberg flow reached mid-latitudes in the North Atlantic, so they are thought to be caused by meltwater that covered the North Atlantic Ocean.

This cyclic warming and rapid cooling repeated twice just after a geomagnetic reversal, a key event for the Early/Middle Pleistocene boundary, and a third time about 10 thousand years later. All occurred after the Earth had recovered its geomagnetic strength. This shows that the second half of this interglacial period, namely the earliest stage of the Middle Pleistocene, was a time of extreme climate change when ice sheets expanded and shrunk causing changes of several meters in sea levels, repeating every 500 to 2000 years.

The phenomenon of rapid temperature rises modulated by bi-centennial cycles ending with a sudden freeze only occurred during a very brief portion of this interglacial period, during the two warmest periods. There is a high possibility that this 200 year period marks the de Vries Cycle (205 years), when the climate was particularly sensitive to solar activity.

Researchers will now verify whether the same phenomenon can be observed in other regions. Evidence from the southern hemisphere will be the key to showing whether it was a global phenomenon. This discovery is very unusual among the climate warming that occurred in the past, as well as being an important key to learning about the diversity of temperature rises and understanding current global warming.

Additionally, this discovery was made in the Chiba Section (Japan), a candidate section for the Early/Middle Pleistocene era global boundary stratotype sections and points (GSSP), currently under review by the International Union of Geological Sciences. These findings provide further evidence for the academic value of the Chiba Section

https://phys.org/news/2017-09-rapid-climate-northern-hemisphere-earliest.html?utm_source=menu&utm_medium=link&utm_campaign=item-menu
 
thorbiorn said:
_http://www.dmi.dk/nyheder/arkiv/nyheder-2017/september/havisen-fik-foerstehjaelp-af-kold-sommer/ said:
The arctic loses 94.000 km2 per year

Rasmus Tonboe, has previously analyzed the sea ice in the period from 1978 to today. His data shows that the area of the arctic sea ice annual decrease with 94.000 km2 of the summer minimum of sea ice in September. 94.000 km2 is more than the double of Denmark's land area.

The sea ice in the Arctic is important for the climate, because it has a high so-called albedo. High albedo means that ice reflects large amounts of sunlight back out into space, so it does not convert to hot. When the ice is gone, it is replaced by the dark ocean surface. The sea surface reflects very little sunlight, but allows instead a large part of the light to be converted into heat. The heat of the water has the potential to melt even more sea ice, thus amplifying the process.

Since 2007, the arctic ice coverage in Summer has remained at a level significantly lower than in the 1970's, 80'ies and 90'ies. The lower level is a consequence of the rising temperature in the Arctic and general thinning of the sea ice. Climate models suggest that the trend will continue, and that we are already in the middle of the 21. century is experiencing its first ice-free summer in the Arctic.


Perhaps what influences the scientists at DMI is more the arctic ice than a not so warm summer in Denmark.

Regarding arctic sea ice, then there is this article that cites 12 new papers on the balance of ice etc., and it appears that there some scientists who unlike DMI are seeing that things are changing.
_http://notrickszone.com/2017/09/11/12-new-papers-north-atlantic-pacific-and-southern-oceans-are-cooling-as-glaciers-thicken-gain-mass/#sthash.PrDvzzoB.dpbs
12 New Papers: North Atlantic, Pacific, And Southern Oceans Are Cooling As Glaciers Thicken, Gain Mass
...
Contrary to expectations, climate scientists continue to report that large regions of the Earth have not been warming in recent decades.

According to Dieng et al. (2017), for example, the global oceans underwent a slowdown, a pause, or even a slight cooling trend during 2003 to 2013. This undermines expectations from climate models which presume the increase in radiative forcing from human CO2 emissions should substantially increase ocean temperatures.

...
Subpolar North Atlantic Cooling Rapidly Since 2005

According to Piecuch et al. (2017) there has been no net warming of the North Atlantic Ocean in the last quarter century. The warming that occurred in the 10 years from 1994-2004 has been completely negated by an even more pronounced cooling trend since 2005. The predominant (87%) cause of the warming was determined to be of the same natural (non-anthropogenic) origin as the subsequent cooling: advection, the movement/circulation of heat via internal processes. In fact, human CO2 emissions are never mentioned as even contributing to the the 1994-2004 warming.

...
Yeager and Robson (2017) also point out that, like it did from the 1960s to 1980s, the North Atlantic “has again been cooling”, a trend which they and others expect to continue. Sea surface temperatures are no warmer today than they were in the 1950s.

...
Predictions Of Future Cooling, Ice Expansion

Årthun et al., 2017 Statistical regression models show that a significant part of northern climate variability thus can be skillfully predicted up to a decade in advance based on the state of the ocean. Particularly, we predict that Norwegian air temperature will decrease over the coming years, although staying above the long-term (1981–2010) average. Winter Arctic sea ice extent will remain low but with a general increase towards 2020.

Pittard et al., 2017 We suggest the Lambert-Amery glacial system will remain stable, or gain ice mass and mitigate a portion of potential future sea level rise over the next 500 years, with a range of +3.6 to -117.5 mm GMSL-equivalent.

So mentioning that the arctic is losing 94000 sqkm2 at the end of the article is at the very least misleading and not in agreement with current scientific observations. Again, I am inclined to think that DMI is more tied to the AGW model of things rather than actual observations, which they have available. Otherwise, a more objective view would be presented.
 
goyacobol said:
Also, after the the current solar minimum the sun will go the other way towards another solar maximum 4 years from now. I just posted this in the Solar Activity to fall by 60% in 2030-2040 but I think they may be related.

Longer-Lasting Coronal Holes and Space Junk During Solar Minimum

Like a pendulum, in about four years the sun will begin exiting this phase and approach solar maximum.

It could start a cooling as soon as 2021. And the earth's axis is changing gradually too.

Axial tilt
Earth currently has an axial tilt of about 23.4°.[8] This value remains about the same relative to a stationary orbital plane throughout the cycles of axial precession.[9] But the ecliptic (i.e., Earth's orbit) moves due to planetary perturbations, and the obliquity of the ecliptic is not a fixed quantity. At present, it is decreasing at a rate of about 47″ per century (see details in Short term below).

It seems to me that while some areas are warming others are not or may be cooling. There are many others cosmic factors the global warming theory is ignoring completely.
 
Pattern Change Will Bring First Snow of the Season to Parts of Rockies Late This Week (Video 00:43)
By Linda Lam11 hours ago weather.com
_https://weather.com/forecast/national/news/mid-september-pattern-change-rockies-first-snow
Links within:
At a Glance
An upper-level pattern change will usher in much colder temperatures to parts of the West.
Snow is also expected to fall in some of the higher elevations of the northern Rockies.
Areas from the Plains to the East Coast will experience mild conditions into mid-September.


A noticeable pattern change is taking shape, especially across the West where the first snow of the season may fall in some locations.

In the West, a dramatic change in the weather is expected late this week as a strong upper-level low-pressure system will push southward into the northern Rockies, spreading much colder temperatures, along with rain and some higher-elevation snow.

This change is courtesy of a shift in the jet stream. Over the West, the jet stream will take a southward dip in the region, allowing colder conditions to infiltrate farther south. Conversely, the jet stream will be pushed northward over the East, with mild temperatures streaming northward into the Midwest and Northeast.

In addition, a significant low-pressure system will produce widespread showers and thunderstorms from Idaho and Montana into northern Arizona and New Mexico through Thursday. As the colder air flows in behind this system, the rain will change to snow in the mountains of southwestern Montana, western Wyoming and portions of Idaho Thursday night into Saturday.

Here's what to expect with this pattern change.

Chilly, Snowy West Forecast

Summer (June-August) was one of the top-five warmest summers on record in much of the West, according to the Southeast Regional Climate Center, and the unusual warmth has persisted into September, so the cold blast will be even more noticeable.

Warmer-than-average temperatures continued through Tuesday but, now, cooler temperatures will begin to push south, making it feel more like fall. Much of the northern Rockies will see high temperatures 30 to 40 degrees colder Friday compared to the start of the week, as temperatures will only climb into the 40s and 50s.

Low temperatures will be even chillier, with temperatures dropping into the 20s and 30s for much of western Montana, eastern Idaho and Wyoming Friday through Sunday mornings. Widespread frost is possible and, in some spots, there may even be a hard freeze Sunday morning in low-lying areas.

These below-average temperatures will allow the rain to change to snow in many spots. Significant snow is possible across portions of the higher elevations of western Montana and northern and western Wyoming.

As cold air filters into the region, snow may even spread down to the valley and basin floor in parts of western Wyoming by Friday evening.

Accumulation of snow is expected generally above 6,000 feet, with the higher mountain peaks picking up 1 to 2 feet of snow through Saturday.

Winter storm watches and winter weather advisories have been issued for portions of western Montana, eastern Idaho and northern and western Wyoming – the firsts of the season here.

It will likely still be too warm for much snow to accumulate on major roadways, unless the snow becomes heavy.

This pattern change is also anticipated to assist with slowing the ongoing wildfires in the area.

Snow in mid-September does happen in the northern Rockies, especially in the higher elevations, so this is not all that unusual.

Pikes Peak and Mount Massive in the Colorado Rockies already saw the first snow of the season in early August. Many areas of the West, including Denver, Cheyenne and Billings, have seen snow as early as early September.

However, given the recent warm conditions, campers and hikers need to be prepared for freezing temperatures and snow.

Mild East in Mid-September

Meanwhile, parts of the East saw cooler-than-average conditions early this week, due in part to the clouds and rain from the remnants of Hurricane Irma.

Several cities set daily record-cold high temperatures on Monday (new record in parentheses), including: Asheville, North Carolina (60 degrees), Knoxville, Tennessee (62 degrees), Greenville, South Carolina (62 degrees), Huntsville, Alabama (65 degrees), Birmingham, Alabama (66 degrees), Montgomery, Alabama (68 degrees), and Jacksonville, Florida (76 degrees).

High temperatures remained below average in portions of the South and Ohio Valley into Wednesday, where highs were generally in the 60s.

Late this week, temperatures will return to near average across the South and into the Ohio Valley and mid-Atlantic, with warmer-than-average temperatures prevailing from the Plains into the Midwest and Northeast.

Highs will generally reach into the 80s, with 70s in parts of the Northeast, while lows in the 50s and 60s can be expected. The southern Plains will see highs top out in the 90s.

It will also feel more humid for much of the South and East late this week.

The mild conditions are expected to last at least into the weekend across the East.

Many areas will also see drier conditions once the remnants of Irma depart the East by late week. Early next week, a cold front is expected to push eastward bringing a chance for showers and thunderstorms.
DCT_SPECIAL47_1280x720.jpg


The Old Farmer's Almanac, if it's to be trusted, has California on course for a cold and wet winter, while the Pacific Northwest will see a more cold and dry one. (Video 1:05)
_http://sfist.com/2017/09/13/experts_already_predicting_another.php
Will California be slipping back into a drought come January 2018, or will we see deluge after deluge again, causing dams to burst at the seams, sending trees, roads, and bridges into ravines — or into the Pacific — and dumping another hundred feet of snow in the Sierra? That is the question facing climatologists right now as we stare down what's jokingly called a "La Nada" winter — i.e. neither an El Niño or a La Niña, but what should be just a "normal" one. :pinocchio:

Sam Khoury: How Governments will Handle Grand Solar Minimum Effects (452) 30:10
Adapt 2030 Published on Sep 13, 2017
https://www.youtube.com/watch?v=upBG7gLExho
 
Looking around for sites about the current Arctic Sea ice extent in numbers, I ended up spending a good hour looking at a site from those who very much believe in AGW and it feels as if I just entered a different reality. The site is fairly professional with many contributors listed including Professor Peter Wadham, the man who since a number of years now every year announces that this will be the year that the Arctic will be ice free. :rolleyes:

_http://arctic-news.blogspot.ch/

They make their position quite clear early on about who is to blame:
There is no doubt that people's emissions are causing global warming and that this is causing more extreme weather to occur across the world.

Good to have that clear as for a moment I feared that it would be pinned on the flatulent cows. :P

Just 6 weeks ago, they said on the site that all the arctic sea ice could be gone by September. :scared:

_http://arctic-news.blogspot.ch/2017/08/arctic-sea-ice-may-well-be-gone-by-september-2017.html
Arctic sea ice may well be gone by September 2017

The Arctic Ocean is warming up fast and this is melting the sea ice from below.

Sea surface temperature anomalies are well above 8°C (14.4°F) in several parts of the Arctic Ocean.

The image on the right shows sea surface temperature anomalies from 1961-1990 for the Arctic (60°N - 90°N) on August 2, 2017.

Global sea ice extent is at a record low for the time of the year, as illustrated by the graph below, by Wipneus. Lower sea ice extent means that less sunlight is reflected back into space.

Again a site that likes to use the climate normals from 1961-1990 as a baseline, so as to increase their arguments. And the graph that they use don't match other maps that are around such as from from DMI and Nansen. And regarding the warm spots then one can always cherrypick localised areas where it is 'abnormally' warm and then just extrapolate.

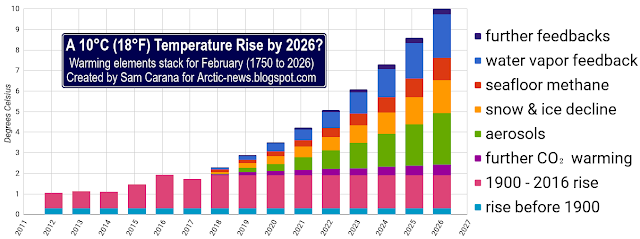
They also think it is likely that global temperatures could rise by 10° celcius by 2026. :rotfl:

Here is a graph they produce:

10C-18F-stack.png


So the temperature rose just over 1 degree Celcius from 1750 until 2012 and then they want you to seriously consider the idea that in the following 14 years the temperature will rise by 9 degrees!?! In order to make the case, they add new elements that have never played a role according to their own admission and then it is just a matter of fiddling with the curve until the desired alarmist result manifest. Next step is to feed it into a model and bingo, a model now predicts that the globe will heat by 10° Celcius by 2026.

In the post they even add this:
Such a rise could take place even more rapidly, as discussed in earlier posts.


Interestingly after an hours visit to their site and reading some of their articles, it felt very similar to reading some of the SJW sites. Completely disconnected from reality and very ideologically driven.
 
Aeneas said:
Here is a graph they produce:

10C-18F-stack.png


So the temperature rose just over 1 degree Celcius from 1750 until 2012 and then they want you to seriously consider the idea that in the following 14 years the temperature will rise by 9 degrees!?! In order to make the case, they add new elements that have never played a role according to their own admission and then it is just a matter of fiddling with the curve until the desired alarmist result manifest. Next step is to feed it into a model and bingo, a model now predicts that the globe will heat by 10° Celcius by 2026.[emphasis added - griffin]

Just looking at that graph, it's obvious that the most dramatic increase projected for the next 10 years is in the element category labeled "aerosols", which appears to ramp up quickly from zero to 10 times or more its initial value. This appears to be one part of a sleight-of-hand maneuver on the part of the warmist financial fraud conspiracy, in that the Gates Foundation and associated plutocrats plan to start dispensing aerosols high in the atmosphere in large quantities in order to help minimize global warming they claim.

If you see how this works, on the one hand a group of warmist fraudsters plan to distribute lots of gawd-knows-what (probably excess fluoride or aluminum, whatever they have) under the claim that it will aid in holding down manmade warming, and... on the other hand, other warmist so-called 'scientists' claim that aerosols will drive global warming.

These are nothing less than parts of a plan for financial fraud on civilization-wide scale.
 
Laura said:
Okay, Aeneas and Griffin, that's another article!!!

Okay, I will put something together in the next couple of days. I will have to look into aerosols a bit first and what they both mean by that term. Griffin if you have thoughts, links or feel to write more, then feel free and I will incorporate it.

It almost belongs in the category "Don't Panic, Lighten up", if you know what I mean. It is amazing how it almost hurts to look into these sites for any length of time. I guess it could be due to the ideological zealotry found there and the use of information selection and substitution.
 
Winter Storm Warning Issued For WY & MT | Up To 20″ of Snow Is Forecasted Tonight – Saturday Thursday September 14, 2017 (Graphs)
https://snowbrains.com/winter-storm-warning-issued-for-wy-mt-up-to-20-of-snow-is-forecasted-tonight-saturday/

The National Weather Service has issued a Winter Storm Warning for Montana and Idaho. This is in effect from Tonight – Saturday.

This is the FIRST Winter Storm Warning in the Continental USA this season!

A strong fall storm is expected to hit the west late this week into the weekend. Cold temperatures are expected to arrive along with it, which will turn rain into snow.

Up To 20″ of Snow Is Forecasted To Fall.

NOAA Has Issued Winter Storm Warnings For:
•Montana
•Wyoming

NOAA Has Issued Winter Storm Watches For:
•Idaho
•Montana
•Wyoming

NOAA Has Issued Winter Weather Advisories For:
•Idaho
•Montana
•Wyoming

Snow levels will start out around 7,000ft on Thursday Night and drop below 6,000ft by the time Friday Morning rolls around.

Idaho: Up To 10″ of Snow Tonight – Saturday Morning

* Accumulations: Snow accumulation of 1 to 3 inches, with up to 10
inches on mountain peaks above 7000 feet.
- NOAA Missoula, MT Today

Montana: 14+” of Snow Tonight – Saturday Morning

* SNOW ACCUMULATION...8 to 14 inches above 7,000 feet, with
locally higher amounts possible. Greatest totals will be on
north facing slopes.
- NOAA Billings, MT Today

Wyoming: Up To 20″ of Snow Tonight – Saturday Morning

* SNOW AMOUNTS...4 to 8 inches above 7500 feet, 8 to 14 inches
above 9000 feet.
- NOAA Riverton, WY Today
 
Back
Top Bottom