Published: November 28, 2021 at 2:54 p.m.
On a real polar night in the north of Sweden last night, the temperature dropped to an incredible -37.3 ° C in one of the coldest days recorded in November in that country.
Really impressive low temperatures for this time of year in the north of the country were measured in the village of the people of Sami Nikkaulotka located in the municipality of Gällivare where 17,529 people live. The fact that this is a truly polar day is also shown by the fact that the record of this village, which is -39 ° C for the month of November, and which was set in the 50s of the last century, was almost broken.
Sweden's national record for November was set in 1890, when -43 ° C was measured.
As you read this, the cold extremely unusual for this part of the year continues to spread rapidly across Europe.
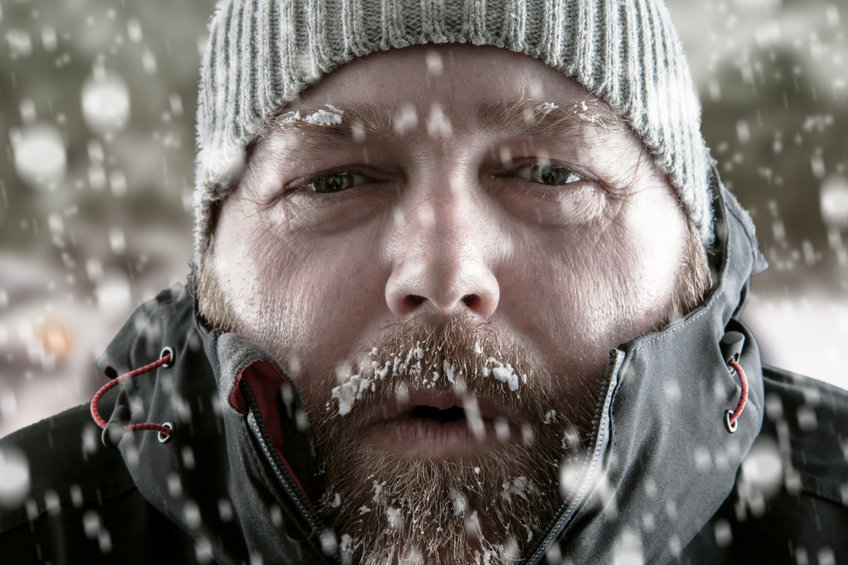
Photo credit: Scott Duncan / Facebook.
Photo credit: Scott Duncan / Facebook.
Also from the same meteo portal:
Published: November 27, 2021 at 10:45 am
The cold front is slowly advancing through central Europe with air temperatures falling to winter values and snow. Values at 850 hPa (around 1500 m above sea level) above most of Germany and France will drop below -4 ° C, which is enough for snow in some lowlands.
Slight cooling also reached the extreme north of Slovenia with a drop in air temperature to around 0 ° C at 850 hPa. That was enough for snow in the higher regions. This morning we can enjoy beautiful photos of fresh snow from Kranjska Gora.
The Croatian mountains are also expecting a moderate cooling tomorrow, so we should expect some snow in the higher areas, but without any major surprises. More about that soon in our
three-day forecast .
Kranjska Gora this morning, photo: Kranjska Gora / Facebook
A snowstorm hit most of Germany last night. According to meteorological portals, about 10 centimeters of snow fell above 500 meters above sea level, but there was also snow in the lower areas, where he sampled traffic difficulties. The following video comes to us from West Germany, the region of North Rhine-Westphalia.
Schnee in den Hochlagen von NRW! ❄️🥶 Mehr Infos zum Schnee auf www.WetterOnline.de/WetterTicker #Schnee #Winter #NRW

www.facebook.com
Looking at the total snowfall over the next 7 days we can see Europe slowly entering winter. The map does not show snow on the ground, but the total snowfall in mm or l / m2, so there will be less snow on the ground due to landslides and subsidence, but these are specific amounts for the time of year. Just look at the Baltic! (PR / IM).
Cumulative snowfall in the next 7 days, source: WRF / Istramet
(both articles translated by Google)
Here in the lower parts of NRW near the Rhein river, it is really wet and cold.
We have forecast for snow the last couple of days every day, but I still haven´t seen any.
Temperatures are from 0 degrees at night to a max of 4 degrees during the day.
It is cold....

 smoothiex12.blogspot.com
 11/15/2021


 November Minimum Records


")