You are using an out of date browser. It may not display this or other websites correctly.
You should upgrade or use an alternative browser.
You should upgrade or use an alternative browser.
Watch the skies and land and oceans
- Thread starter Ellipse
- Start date
JGeropoulas
The Living Force
100 years of physics challenged by observation.
I'm 73 and have never seen a crescent moon illuminated on the bottom like the one seen from diverse locations on February 20, 2026. (The one featured in this video was taken at 8:45 in Florida after the sun had set 2 hours earlier.) Traditional astronomy says the illuminated crescent must be on the side facing the sun (i.e. East or West due to Earth's rotational axis orientation). But this recent crescent moon was 135 degrees out of place, and followed a solar coronal hole aimed directly at Earth, with a electromagnetic field fired at 101 (100 times normal) and an historic peak Schumann resonance.
This guy has an interesting theory to explain such an event.
Two comments were especially interesting:
"To humanity you will see things that you never saw before you never were taught any of these phenomenons in science class things have changed drastically you will see things that will be unbelievable do not be fearful don't believe everything you see you are watching The greatest show on Earth"
"Two timeliness have merged and are reporting on this. Some say its normal and some say they never seen it."
I’ve seen this recently, the crescent at the bottom, it was day time, my toddler pointed it out. I thought may be it was a cloud at first but as I watched it didn’t change then checked the moon phase calendar and confirmed it was indeed the moon.100 years of physics challenged by observation.
I'm 73 and have never seen a crescent moon illuminated on the bottom like the one seen from diverse locations on February 20, 2026. (The one featured in this video was taken at 8:45 in Florida after the sun had set 2 hours earlier.) Traditional astronomy says the illuminated crescent must be on the side facing the sun (i.e. East or West due to Earth's rotational axis orientation). But this recent crescent moon was 135 degrees out of place, and followed a solar coronal hole aimed directly at Earth, with a electromagnetic field fired at 101 (100 times normal) and an historic peak Schumann resonance.
This guy has an interesting theory to explain such an event.
Two comments were especially interesting:
"To humanity you will see things that you never saw before you never were taught any of these phenomenons in science class things have changed drastically you will see things that will be unbelievable do not be fearful don't believe everything you see you are watching The greatest show on Earth"
"Two timeliness have merged and are reporting on this. Some say its normal and some say they never seen it."
I decided that there’s been some kind of change too, that reality is getting weird and only gonna get weirder so accepted it and didn’t think any more of it. It really is just one event among multiple things that has convinced me we are definitely not in Kansas.
What he's describing is normal in Northern latitudes for that time of the year: February and March.00 years of physics challenged by observation.
I'm 73 and have never seen a crescent moon illuminated on the bottom like the one seen from diverse locations on February 20, 2026. (The one featured in this video was taken at 8:45 in Florida after the sun had set 2 hours earlier.) Traditional astronomy says the illuminated crescent must be on the side facing the sun (i.e. East or West due to Earth's rotational axis orientation). But this recent crescent moon was 135 degrees out of place, and followed a solar coronal hole aimed directly at Earth, with a electromagnetic field fired at 101 (100 times normal) and an historic peak Schumann resonance.

Wet moon - Wikipedia
A wet moon (also called a Cheshire moon) is the visual phenomenon when the "horns" of the crescent Moon point up at an angle, away from the horizon, so that the crescent takes on the appearance of a bowl or smile. A wet moon occurs when the crescent Moon is low above the horizon and at a point more or less directly above the Sun's (invisible) position below the horizon. This in turn is determined by the positions of the Moon and Earth in their respective orbits, the inclinations of these orbits relative to one another and to Earth's celestial equator, and the observer's latitude on Earth. Wet moons occur routinely in the tropics (where the Sun and Moon rise and set nearly vertically), but rarely in the polar regions (where the Sun and Moon rise and set at a glancing angle or not at all).
By contrast, a dry moon is one where the crescent of the moon is at any other angle
The terms wet moon and dry moon originate from Hawaiian mythology, where it was thought that the Moon appeared as a bowl that would fill up with rainwater. The period when this is most common, January 20 to February 18, corresponds with Kaelo the Water Bearer in Hawaiian astrology and makes the Moon known as the "dripping wet moon". As summer comes, the crescent shape shifts, pouring out the water and causing the summer rains. After the "bowl" empties, it dries out and rights itself, creating the "dry moon". However, others say that this is a wet moon because it permitted the water to pour out.
The term Cheshire moon is a reference to the smile of the Cheshire Cat from Lewis Carroll's novel Alice's Adventures in Wonderland.
More info here:
Crescent Moon Tilt - Madison Metropolitan School District
Crescent Moon Tilt - Madison Metropolitan School District
JGeropoulas
The Living Force
Good to know. However, Florida is halfway between the equator and London (about 30 degrees, 1,900 miles, north of the equator), so a bottom crescent moon ("wet moon") as seen in February isn't consistent with the illustrations linked above.What he's describing is normal in Northern latitudes for that time of the year: February and March.
Wet moon - Wikipedia
en.wikipedia.org
More info here:
Crescent Moon Tilt - Madison Metropolitan School District
Crescent Moon Tilt - Madison Metropolitan School Districtwww.madison.k12.wi.us
View attachment 116829
Last edited:
However, not for the Northern Hemisphere for February and March. It looks like the illustrations near the Equator. Check out the links.Good to know. However, Florida is halfway between the equator and London (about 30 degrees, 1,900 miles, north of the equator), so a bottom crescent moon ("wet moon") as seen in February isn't consistent with the illustrations linked above.
Wandering Star
The Living Force
At the end of the video, the guy asks for money for his research.100 years of physics challenged by observation.
I'm 73 and have never seen a crescent moon illuminated on the bottom like the one seen from diverse locations on February 20, 2026. (The one featured in this video was taken at 8:45 in Florida after the sun had set 2 hours earlier.) Traditional astronomy says the illuminated crescent must be on the side facing the sun (i.e. East or West due to Earth's rotational axis orientation). But this recent crescent moon was 135 degrees out of place, and followed a solar coronal hole aimed directly at Earth, with a electromagnetic field fired at 101 (100 times normal) and an historic peak Schumann resonance.
This guy has an interesting theory to explain such an event.
Two comments were especially interesting:
"To humanity you will see things that you never saw before you never were taught any of these phenomenons in science class things have changed drastically you will see things that will be unbelievable do not be fearful don't believe everything you see you are watching The greatest show on Earth"
"Two timeliness have merged and are reporting on this. Some say its normal and some say they never seen it."
Well, you can do some quick research online, like Gaby did.
When I lived in the Canary Islands, I used to see the moon with its horns pointing upwards in winter, and having lived much further north as a child, I thought something was off. So I looked into it and quickly came across the same information Gaby shared.
Nothing unusual about it, in my opinion.
JGeropoulas
The Living Force
So the chart of various moon phases (at the equator, London/Sidney and poles) is what appears during Summer or Winter equinoxes?
Wandering Star
The Living Force
And that moon with its horns pointing upwards was visible when it rose over the horizon.
As the moon climbed higher in the sky throughout the night, it rotated and remained vertical in its usual position.
At the end of the night, after rotating again on its way to set below the horizon, the moon's horns pointed downwards.
I know this because I worked the night shift and was able to observe it.
It's a fascinating sight for those of us who live further north in the Northern Hemisphere.
Latest Updates on Global Seismic Activity and Other Important Information from the Present and Past
Major Coronal hole on the Sun Facing Earth. Southern California Earthquake activity.
Mar 10, 2026
Solar Weather Updates.. Solar flares and sunspots..Volcano and earthquake updates.https://streamlabs.com/theearthmaster... or https://the-earthmaster-shop.fourthwa...Current World Earthquake Map https://earthquake.usgs.gov/earthquak...Recent California and Nevada Earthquakes http://scedc.caltech.edu/recent/Geologist with the facts.
Severe Damage Left Behind by Likely Tornado in Lake Village, Indiana
Tsunami Forecast Model Animation: Kamchatka, Russia 2025
48,038 views Aug 11, 2025
Major Coronal hole on the Sun Facing Earth. Southern California Earthquake activity.
Solar Weather Updates.. Solar flares and sunspots..Volcano and earthquake updates.https://streamlabs.com/theearthmaster... or https://the-earthmaster-shop.fourthwa...Current World Earthquake Map https://earthquake.usgs.gov/earthquak...Recent California and Nevada Earthquakes http://scedc.caltech.edu/recent/Geologist with the facts.
Severe Damage Left Behind by Likely Tornado in Lake Village, Indiana
Tsunami Forecast Model Animation: Kamchatka, Russia 2025
On July 30, 2025, the sixth-largest earthquake ever recorded struck offshore of the Kamchatka Peninsula in far eastern Russia at 11:24 in the morning (29 July 23:24 UTC). Its 8.8 magnitude also made it the largest earthquake since the M9.0 earthquake that struck offshore of Japan in 2011, and like that earthquake produced a tsunami hazardous to both nearby and distant coastlines. PTWC did not know at first that the earthquake was large enough to pose a tsunami threat to distant coastlines so initially only notified Russia and Japan that they faced a serious tsunami hazard. But in less than an hour they had enough earthquake data to know that the threat would be more widespread. Over the following hours PTWC collected sea-level data from deep-ocean and coastal gauges and refined their tsunami forecasts. As the tsunami spread through the Pacific Ocean over the next day-and-a-half PTWC expanded their international guidance to include high-hazard notifications for countries in Central and South America and several Pacific Island nations. For the United States, PTWC issued a Tsunami Warning (1 m or more, evacuation recommendation) for Hawaii and Tsunami Advisories (0.3 to 1 m, clear the beach recommendation) for Guam+CNMI and American Samoa. Meanwhile PTWC’s sister office, NTWC, issued Tsunami Warnings for the western Aleutian Islands and northern California, and issued Tsunami Advisories for the eastern Aleutian Islands, Alaska Peninsula, southern Alaska, British Columbia, Washington, Oregon, and California south of Mendocino.
As expected, Russia received the largest tsunami waves, with one run-up measurement reaching 19 m (more than 60 ft.). Outside of Russia the greatest amplitudes were in Hawaii, with Kahului, Maui recording over 1.7 m (more than 5.5 ft.) and the other main Hawaiian islands all recording more than 1 m (over 3 ft.). Other locations with comparable run-up values included Japan and Chile, (1.3 m), northern California (1.2 m), the Galapagos Islands (1.0 m), and Midway Atoll and American Samoa (just under 1 m).
Notably, this is the largest earthquake to not cause any casualties through ground shaking or its tsunami.
The Pacific Tsunami Warning Center (PTWC) creates animations of tsunamis with the same tool that it uses to determine tsunami hazards in real time: the Real-Time Forecasting of Tsunamis (RIFT) forecast model. The RIFT model takes earthquake information as input and calculates how the waves move through the world’s oceans, predicting their speed, wavelength, and amplitude. This animation shows these values through the simulated motion of the waves as they travel through the Pacific Ocean. You can see the distance between successive wave crests (wavelength) and color indicates their height (half-amplitude). More importantly, the model shows what happens when these tsunami waves strike land, the very information that PTWC needs to issue tsunami hazard guidance for impacted coastlines. The animation begins with all coastlines covered by blue dots. The blue color indicates normal sea level, but as the tsunami waves reach them they will change color to represent the height of the waves coming ashore, and often these values are higher than the waves in the deeper waters offshore. The color scheme is based on PTWC’s warning criteria, with blue-to-green representing no hazard (less than 30 cm or ~1 ft.), yellow-to-orange indicating low hazard with a clear-the-beach recommendation (30 to 100 cm or ~1 to 3 ft.), light red-to-bright red indicating flooding hazard and recommending evacuation (1 to 3 m or ~3 to 10 ft.), and dark red indicating a severe hazard possibly justifying a second-tier evacuation (greater than 3 m or ~10 ft.).
Toward the end of this simulated 30 hours of activity the wave animation will transition to the “energy map” of a mathematical surface representing the maximum rise in sea-level on the open ocean caused by the tsunami, a pattern that indicates that the kinetic energy of the tsunami was not distributed evenly across the oceans but instead forms a highly directional “beam” such that the tsunami was far more severe in the middle of the “beam” of energy than on either side. This pattern generally correlates with the coastal impacts; note how those coastlines directly in the “beam” are hit by larger waves than those to either side of it.
I'm placing this article under this section because "intense solar activity" is not necessarily due to the solar peak of this current solar cycle, which was more active than past cycles. I think it's also related to more intense localized activity from the sun because the geomagnetic field is weaker.
1,300-pound spacecraft will crash to Earth today following intense solar activity, NASA warns
Basically, it ran out of fuel and they thought it could navigate around without it. But it was knocked out of orbit during recent events.
Not technically true. I've seen predictions before the current sun cycle even started. It's definitely more active. But it's not so out of range. You see the chart done by the Laboratory of Solar Astronomy (xras.ru ) with the last 3 sun cycles, including the current one, here.

An illustration of NASA's twin Van Allen Probes orbiting Earth. (Image credit: JHU/APL, NASA)
1,300-pound spacecraft will crash to Earth today following intense solar activity, NASA warns
Basically, it ran out of fuel and they thought it could navigate around without it. But it was knocked out of orbit during recent events.
A heavy space probe is falling to Earth today (March 10), eight years earlier than expected, according to NASA.
The 1,300-pound (600 kilograms) Van Allen Probe A should mostly burn up as it enters Earth's atmosphere, but some components are expected to remain intact. The spacecraft poses a low risk to humans, with a 1-in-4,200 chance of it causing harm, NASA said in a statement released Monday (March 9).
U.S. Space Force calculations have the probe reentering Earth's atmosphere at about 7:45 p.m. EDT today, according to NASA. However, that prediction carries a 24-hour margin of error, so the reentry could have happened already. As of this writing, there have been no reports of a reentry.
Intense solar activity is forcing the probe down much earlier than initially forecast. When the spacecraft ran out of fuel in 2019, NASA predicted it would remain in orbit until 2034. However, that was before the sun entered its current solar cycle in late 2019, and that cycle has been much more active — and peaked sooner — than scientists expected.
Not technically true. I've seen predictions before the current sun cycle even started. It's definitely more active. But it's not so out of range. You see the chart done by the Laboratory of Solar Astronomy (xras.ru ) with the last 3 sun cycles, including the current one, here.
The sun's roughly 11-year cycle peaks with an explosive period of activity known as solar maximum, which triggers more intense space weather events. These events created more atmospheric drag for the fuelless Van Allen Probe A, pulling it out of orbit.
Van Allen Probe A is one of two Van Allen Probes that have been in space for almost 14 years. NASA launched the satellites in 2012 to study Earth's two permanent radiation belts, which were named after American physicist James Van Allen.
The radiation belts are made up of charged particles trapped by Earth's magnetic field. They essentially act as natural shields, protecting Earth from cosmic radiation, solar storms and solar wind.
The Van Allen Probes were designed for a two-year mission but ended up lasting around seven years. The mission eventually ended in 2019, when the probes ran out of fuel. Van Allen Probe A's twin, Van Allen Probe B, is expected to stay in space until 2030, according to NASA.
The probes made a series of scientific discoveries during their tenure. For example, the spacecraft found that electrons in the radiation belts can be accelerated to near light speed by surfing on waves of plasma ejected from the sun. They also detected a third radiation belt that forms only during periods of intense solar activity.
An illustration of NASA's twin Van Allen Probes orbiting Earth. (Image credit: JHU/APL, NASA)
The following press release means that something is being currently expelled from inner Earth. They can't say it outright, otherwise the public will panic.
'Blackwater' lakes and rivers in the Congo Basin are now emitting ancient carbon into the atmosphere

In the ballpark with a 3600 comet cluster timing. Maybe it's just a coincidence (?)
My very good guess is for the "onset of broadscale destabilization".
Or more accurately and literally, Earth Changes.
Drake might already know the answer, though. He couldn't possibly ignore the fact that the Congo Basin and all the places that he studied lay on top of the big African blob:


More info on the South Atlantic Anomaly post here.
'Blackwater' lakes and rivers in the Congo Basin are now emitting ancient carbon into the atmosphere
Blackwater lakes and rivers in the central Congo Basin are releasing carbon that is up to 3,500 years old. (Image credit: Matti Barthel / ETH Zurich)
In the ballpark with a 3600 comet cluster timing. Maybe it's just a coincidence (?)
Blackwater lakes and rivers in the Congo Basin are releasing ancient carbon into the atmosphere, a new study shows. Previously, scientists thought this carbon was safely stored in the surrounding peatlands, but the research reveals that's not the case.
The finding contradicts the long-held assumption that old peat carbon remains trapped underground, suggesting that some tropical peatlands could switch from being carbon sinks to major carbon sources.
"We are now faced with a 30-million-tonne question: we need to determine if this is just a small, natural leakage of ancient carbon, or the onset of broadscale destabilization," study lead author Travis Drake, a carbon biogeochemist at the Swiss Federal Institute of Technology Zurich (ETH Zurich), told Live Science in an email.
My very good guess is for the "onset of broadscale destabilization".
In short, they can't blame humans for this.Drake and his colleagues have conducted three research trips to the Congo Basin over the past four years. Specifically, the team traveled to the Cuvette Centrale, a 56,000-square-mile (145,000 square kilometers) region of forests and swamps in the Democratic Republic of the Congo that holds Earth's largest known tropical peatland complex. Situated in the heart and to the south of the Cuvette Centrale are two large blackwater lakes — Lake Mai Ndombe and Lake Tumba — while a major blackwater river, the Ruki River, flows west-northwest across it to meet the Congo River.
Blackwater lakes and rivers contain high levels of decaying plant debris, or dissolved organic carbon, which gives them their black color. This dissolved organic matter, together with direct inputs of carbon dioxide (CO2) from the surrounding swamps and forests, creates supersaturated concentrations of CO2 in lakes Mai Ndombe and Tumba and in the Ruki River. As a result, these waters emit enormous amounts of CO2 into the atmosphere.
Crucially, however, none of the CO2 was previously thought to originate from the Cuvette Centrale's ancient peat, as these deposits, protected from decomposition by their oxygen-depleted, waterlogged environment, were believed to be highly stable.
But in a paper published Feb. 23 in the journal Nature Geoscience, Drake and his colleagues found otherwise. Their results showed that a significant proportion of the CO2 escaping the Cuvette Centrale's blackwater bodies is from peat carbon that is between 2,170 and 3,500 years old.
"We were very surprised because we fully expected the carbon dioxide to be modern," Drake said.
The researchers drew their conclusions from measurements they took at Lake Mai Ndombe in 2022 and 2024, and at Lake Tumba and the Ruki River in 2025. They accessed Lake Mai Ndombe with small boats, which was difficult due to strong winds that almost capsized them, Drake said.
"The ecosystems remain in relatively pristine condition," he said. "There are some small settlements and villages scattered around Lake Mai Ndombe, but they are far and few between."
The team measured sediments, greenhouse gases, dissolved organic carbon and dissolved inorganic carbon, which includes dissolved CO2, bicarbonate ions (HCO3–) and carbonate ions (CO32-). Later, in the lab, the researchers analyzed their samples with high-precision spectrometry to separate modern carbon from plants and older carbon from soils.
"Because the organic carbon in the lake was modern, we assumed the inorganic carbon would be too, so we initially just analyzed a single sample to confirm," Drake said. But when about 40% of the inorganic carbon in that sample turned out to be millennia old, the team decided to test the remaining samples.
The results were consistent across Lake Mai Ndombe, so the researchers returned to the Cuvette Centrale to sample Lake Tumba and the Ruki River. Both contained high levels of inorganic carbon derived from ancient peat, suggesting that microbes in the region are breaking down peat carbon into CO2 and methane, which then seep into lakes and rivers before wafting into the atmosphere.
The Cuvette Centrale is estimated to hold one-third of the carbon stored in tropical peatlands globally, equivalent to about 33 billion tons (30 billion metric tons). It's possible that recent losses of ancient peat carbon are linked to the formation of new peat deposits, in which case the phenomenon might be nature returning to a state of equilibrium, according to the study. But it's also possible that climate change is destabilizing long-buried deposits and that the Congo Basin's peatlands are nearing a tipping point.
Or more accurately and literally, Earth Changes.
"This pathway highlights a critical vulnerability," Drake said. "If the region experiences future drought, this export mechanism could accelerate, potentially tipping these massive carbon reservoirs from a sink into a major source to the atmosphere."
Next, the researchers will analyze water trapped in the Congo Basin's peat to explore if and how microbes are releasing ancient carbon.
"Ultimately, we aim to confirm whether this process is happening across the entire Cuvette Centrale and quantify oxidation rates to determine if this leakage is a natural baseline or a sign of instability in this large carbon reservoir," Drake said.
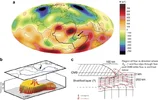
Drake might already know the answer, though. He couldn't possibly ignore the fact that the Congo Basin and all the places that he studied lay on top of the big African blob:
(1,000–2,800 km depth). Map from ref. 31 shown with the edge of African LLSVP at CMB [African blog at core mantle boundary] from refs 27, 28. The cluster analyses evaluate five global tomographic models32,33,34,35,36, with the colour-coded voting map representing the number of models, which assign a lower than average shear wave velocity to the pixel. The average spacing of the pixels is 4°. The voting map highlights the consistency between the global models in defining the African LLSVP, as well as the similar, but more spatially complex, Pacific LLSVP. Because of the inherent averaging in the cluster analyses, the voting map should not be used to comment on the sharpness of the African anomaly, which is better constrained by regional dense data coverage such as that used in refs 27, 28.
More info on the South Atlantic Anomaly post here.
Attachments
More "opening up" activity?
Black auroras seen on March 15th:


Here's an interesting explanation of these anti-auroras:
Black auroras seen on March 15th:
On March 15th, a bright display of auroras exploded over Iceland. Near the shore of lake Pingvallavatn, photographer Ian McCaskill witnessed expanses of pink and green ... and black.
McCaskill may have captured a rare episode of 'black auroras.' They are dark swirls or black blobs that sometimes appear in an otherwise ordinary expanse of auroral light.
Some researchers call them "anti-auroras."
Ordinary auroras are caused by electrons raining down from space. Black auroras are the opposite. Instead of electrons raining down, electrons are propelled upwards back into space. Europe's fleet of Cluster spacecraft flew over a black aurora on Jan. 14, 2001, and saw the process in action:
The study of black auroras is still in its infancy
Here's an interesting explanation of these anti-auroras:
The Cluster data show that the black aurora occurs where there are holes in the ionosphere(*), the part of the upper atmosphere where aurorae are created. Here, the particles that make up the ionosphere are shooting upwards into space inside regions known as positively charged electric potential structures.
"The black aurora isn't actually an aurora at all; it's a lack of auroral activity in a region where electrons are 'sucked' from the ionosphere," explained Professor Göran Marklund of the Alfvén Laboratory in Sweden.
"The data show that the potential structures that create the black aurora extend to altitudes greater than 20 000 km and that they grow in size and intensify over timescales of a few minutes," said Professor Marklund. "It is as if the 'cosmic battery' was getting stronger and stronger and then suddenly stopped working after about 3-4 minutes."
"This period of growth is comparable to the time it takes to 'suck' the electrons from parts of the ionosphere," said Marklund.
Re-posting this one, here, which is the best representation of Earth's magnetic field during a storm released by mainstream sources so far. They don't know know, but they know.
Back from January 19th, 2026:
At some point, around the South Atlantic Anomaly and on top of the "The Big African Blob", the intensity of the magnetic field gets ultralow...
It's just from one storm. Still, very interesting! Here's the press release about this.

Back from January 19th, 2026:
In the following video, released by ESA, they're not highlighting the above, which happened on the 19th (sun activity was released the day before, on the 18th). They're highlighting January 20th at midday. Notice the color of North America on the 19th, though. Blue is low intensity of the Earth's Magnetic Field in nanotesla. Then it moves on to highlight the South Atlantic Anomaly and Africa and so forth. It variates. Europe doesn't look that bad.he storm was a reaction to an X1.9 solar flare, the most powerful category, which occurred on Sunday, 18 January at around 21:00 Moscow Time. The event was registered in active region 4341, which had previously produced two large explosions in the first half of the month while still on the far side of the Sun. By the 18th, due to the Sun's rotation around its axis, it had moved to the side visible from Earth, and at the time of the explosion it was located precisely on the Sun–Earth line. This positioning partially explains the exceptional strength of the subsequent impact on the planet, but not entirely, as a number of facts are extremely difficult to reconcile with basic concepts of solar activity.
The main, difficult-to-explain consequence of the explosion was an exceptionally powerful radiation storm, accompanied by the strongest increase in the number of energetic protons (with energies above 10 MeV) in the vicinity of Earth in the 21st century. Within 24 hours, the density values rose to 37,000 units, which exceeded the “red level” thresholds by a thousand times and the indicators of the strongest flares of the current cycle by 20 times. The seemingly unbreakable records of the beginning of the century, recorded after the largest flares of the current century (about 30,000 units), were surpassed, and only slightly fell short of breaking the absolute record of 43,000 units, recorded back in the 20th century. The causes and consequences of this event (including the amount of radiation received by spacecraft during this period) are still to be investigated. It can only be noted that the increase in protons knocked out the sensors of the ACE spacecraft, which measures the speed of solar plasma in orbit, and for this reason, the speed of the plasma ejection that reached Earth is still unknown.
At some point, around the South Atlantic Anomaly and on top of the "The Big African Blob", the intensity of the magnetic field gets ultralow...
It's just from one storm. Still, very interesting! Here's the press release about this.
Over a few days in January 2026, a particularly strong X-class solar flare caused a geomagnetic storm in Earth’s atmosphere, with some of the most intense radiation storms on record. The cause was an eruption on the Sun’s surface, which released high energy particles that reached Earth within 25 hours. ESA’s ice mission, CryoSat had just received an important software update, enabling the mission to not only monitor polar ice sheets and sea ice, but to also provide scientific data on Earth’s magnetic field.
As shown in this video, data from CryoSat, together with data from two of Swarm’s satellites, as well as data from the Macau Science Satellite-1 (MMS-1) and NASA’s GRACE-FO satellite, was used to model the intensity of the disturbance in Earth’s magnetic field, caused by the solar flare. The colours on the map represent intensity extremes, with the dark orange indicating where Earth’s magnetic field increased in strength, while the dark blue indicates where the magnetic field got weaker. The magnetic intensity highs and lows over the three-day period in 19-22 January illustrates the disturbance in Earth’s magnetosphere.
The Disturbance Storm Time (DST) index, shown below the map, indicates the severity of geomagnetic storms, measured in nano-Tesla (nT). The more negative the DST value, the stronger the storm, suggesting that the storm was at its most powerful just after mid-day on 20 January.
Credits: ESA (data source: A. Grayver/University of Cologne, and N. Olsen/DTU).
OutSky
Jedi Master
Very interesting, good catch. A prelude of inversion of the magnetic axis of earth?More "opening up" activity?
Black auroras seen on March 15th:
View attachment 117054
View attachment 117055
Here's an interesting explanation of these anti-auroras:
Trending content
-

-
Thread 'Coronavirus Pandemic: Apocalypse Now! Or exaggerated scare story?'
- wanderingthomas
Replies: 30K -

-
