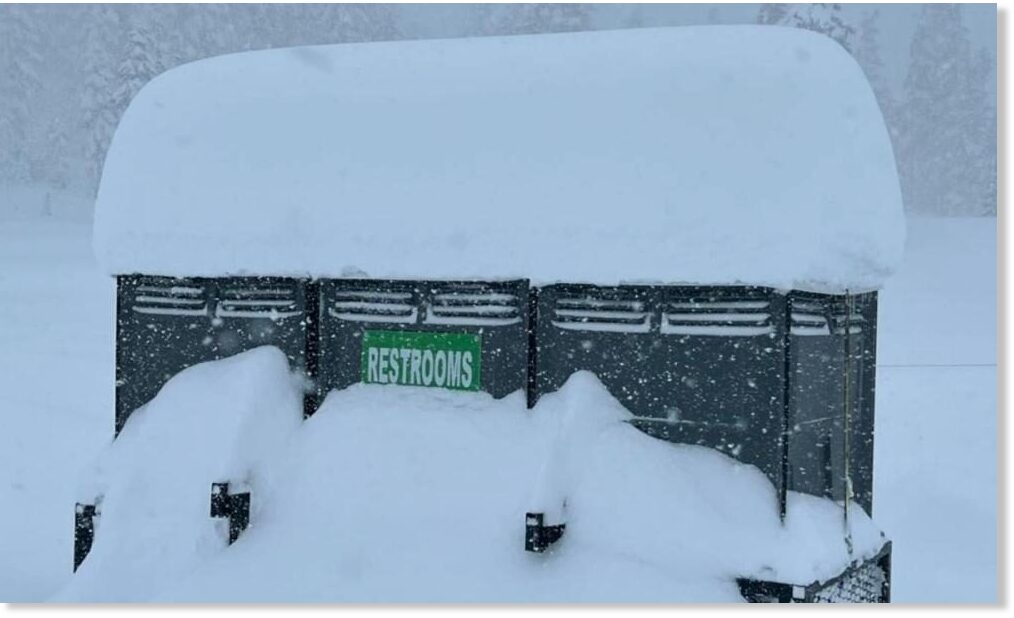
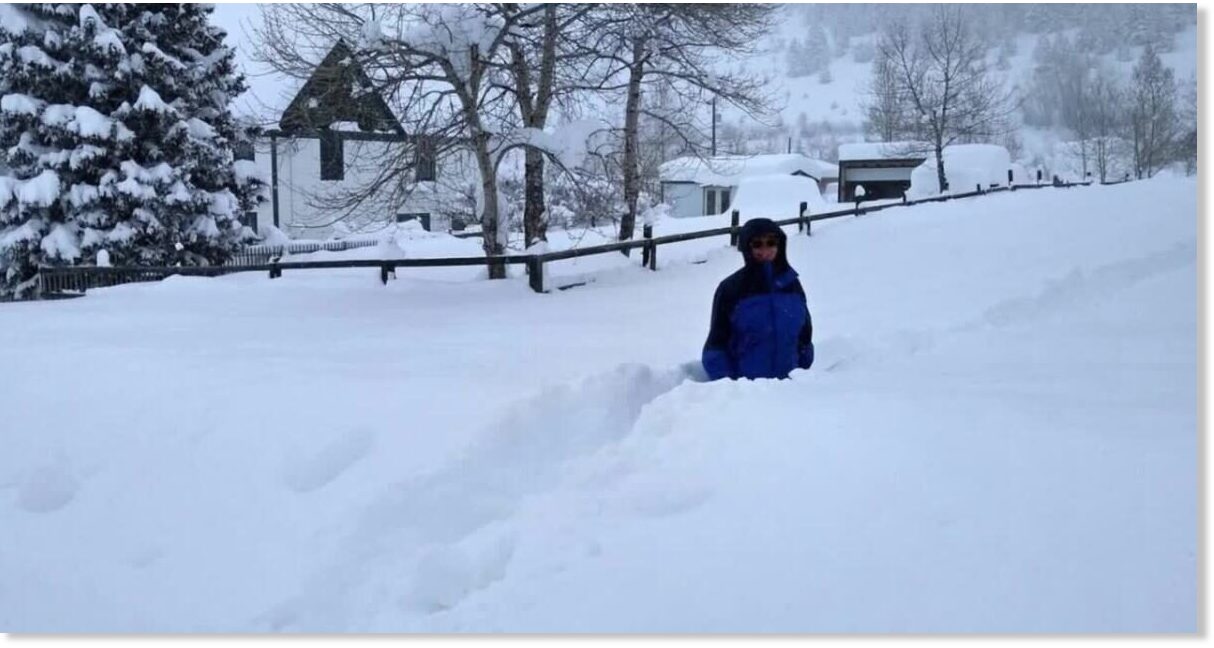
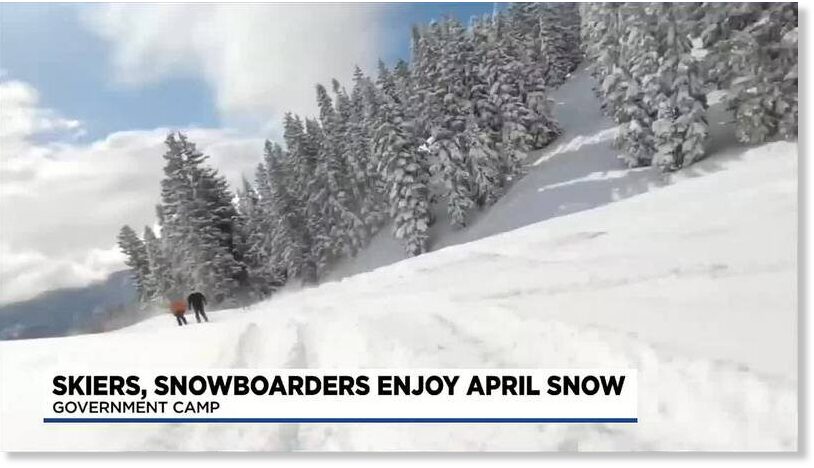
Yesterday was 18 degrees celcius and sunny - the nicest day since fall of last year - today was cloudy, just above zero and lightly snowing earlier and has since warmed up a little bit. It's interesting how influenced I am by the weather but with it being all over the place, schizophrenic-like, that it's indicative of what we are seeing overall. It's a reflection of so much else going on in the world and internally with people. The loss of stability of the seasons is reflected in the loss of stability most everywhere else, economic, Covid, freedoms, food, etc.
I put my hand up for being at a loss these days about how to plan for the future and how 'depressing' it can be focusing on stocking up. Spring is usually a time for growth where life renews itself and we see the birth of so much but it doesn't feel like its arrived just yet. Sometimes I wonder if this is the year that it won't come? But we are in the eye of the storm and the only way through it is through it. I pray it's not so bad, although these are the times that test men's souls.
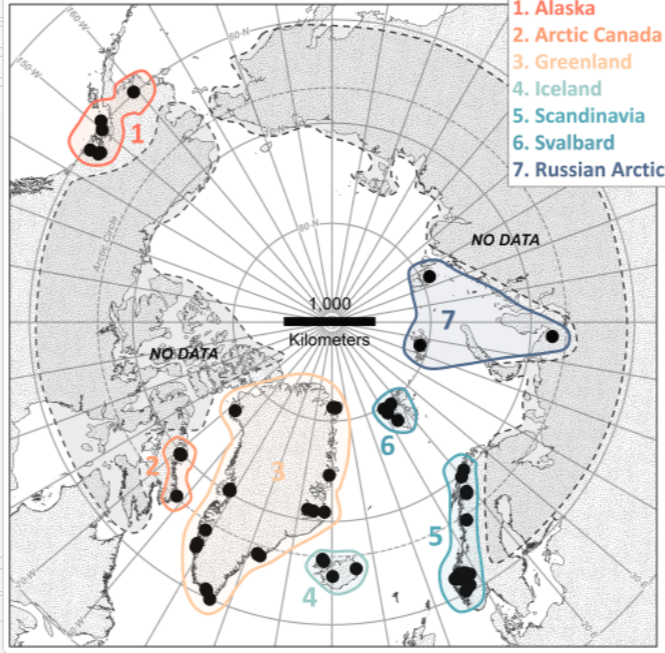
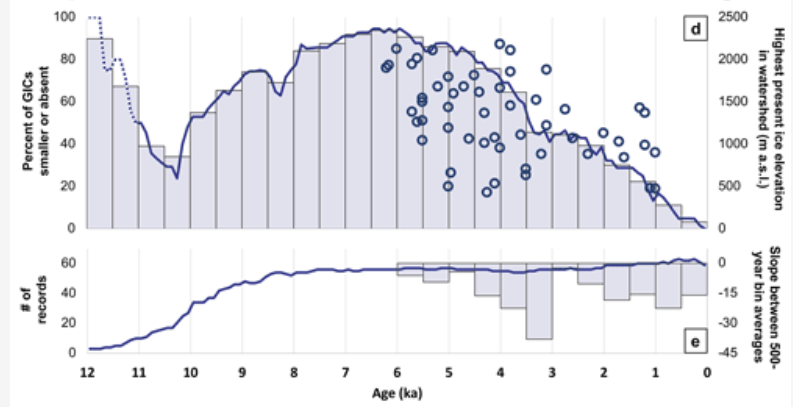
An old documentary on ice ages said that usually the onset of an ice age follows the depletion of essential mineral content that happens gradually during a warming period. And that over time during a cooling period, the ice grinds rocks and stones down which adds essential minerals and content to the soil. So that when a warming period finally does come, the soil is rich for more growth. I guess that's one thing to keep in mind and take heart in even though it will be a difficult transition on so many of us. I, for one, do not like cold weather, but a legitimate global reset, only this one is led by nature and the cosmos, not Klaus Schwab.
Anyways, just some musings from this morning wondering what happened to yesterday's beautiful weather.
I put my hand up for being at a loss these days about how to plan for the future and how 'depressing' it can be focusing on stocking up. Spring is usually a time for growth where life renews itself and we see the birth of so much but it doesn't feel like its arrived just yet. Sometimes I wonder if this is the year that it won't come? But we are in the eye of the storm and the only way through it is through it. I pray it's not so bad, although these are the times that test men's souls.
An old documentary on ice ages said that usually the onset of an ice age follows the depletion of essential mineral content that happens gradually during a warming period. And that over time during a cooling period, the ice grinds rocks and stones down which adds essential minerals and content to the soil. So that when a warming period finally does come, the soil is rich for more growth. I guess that's one thing to keep in mind and take heart in even though it will be a difficult transition on so many of us. I, for one, do not like cold weather, but a legitimate global reset, only this one is led by nature and the cosmos, not Klaus Schwab.
Anyways, just some musings from this morning wondering what happened to yesterday's beautiful weather.
Last edited: