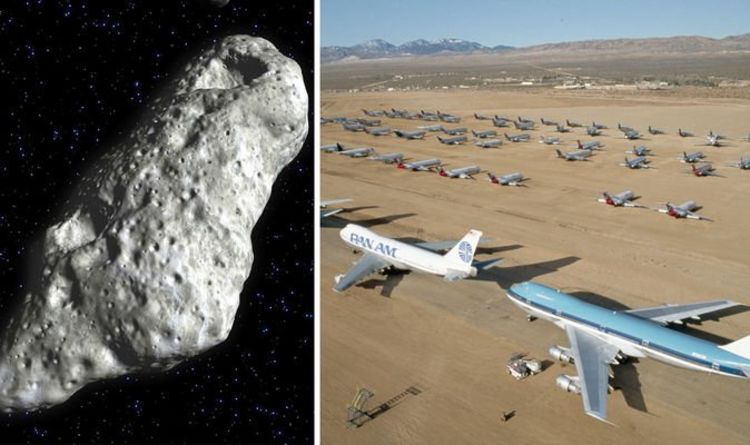
AN ASTEROID longer than two Boeing 747s placed tip to tip is set to swing by our planet in the coming days, and, although it will miss Earth this time, NASA has described it as "potentially hazardous".
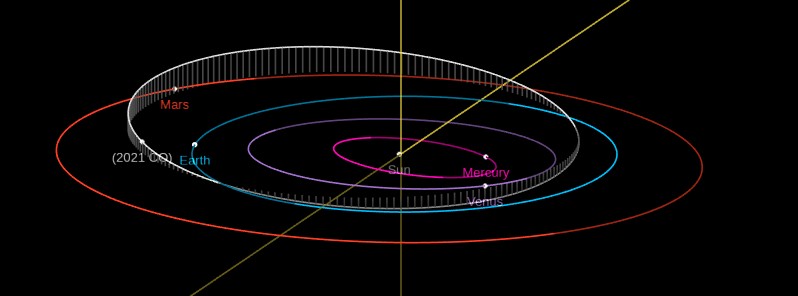
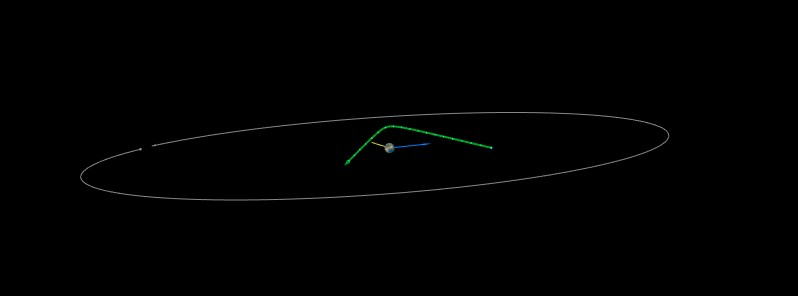
A newly-discovered asteroid designated 2021 CO will flyby Earth at a distance of 0.94 LD / 0.00242 AU (362 026 km / 224 953 miles) on February 11, 2021. This is the 12th known asteroid to flyby Earth…
NASA is warning of a slew of asteroids headed Earth’s way in the coming days and weeks, some coming between us and the moon, with others measuring roughly the same size as the Golden Gate Bridge.
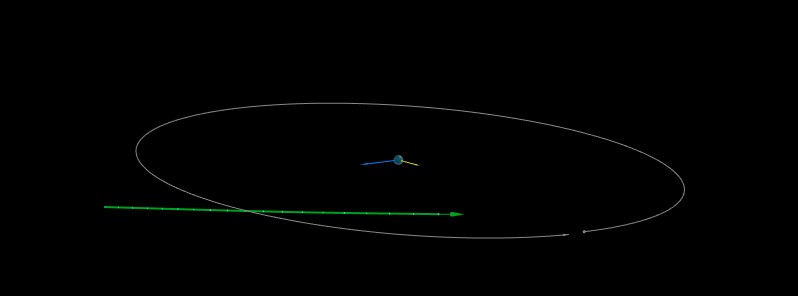
A newly-discovered asteroid designated 2021 CQ5 will flyby Earth at a distance of 0.46 LD / 0.00119 AU (178 021 km / 110 617 miles) at 22:35 UTC on February 11, 2021. This is the 14th known asteroid…
A newly-discovered asteroid designated 2021 CW7 will fly by Earth at a distance of 0.07 LD / 0.00019 AU (28 420 km / 17 660 miles) at 16:14 UTC on February 14, 2021. This object was first observed at…
I just love the following guy. Well worth the watch. And yes he is right, the number of close encounters still seems to increase from last year's all-time record. If it continues like that, this year will beat last year's records (again):
The US space agency is warning of a salvo of space rocks headed for Earth, ranging in size from a paltry 10 meters in diameter all the way up to a positively petrifying 213.
The US space agency is warning of a salvo of space rocks headed for Earth, ranging in size from a paltry 10 meters in diameter all the way up to a positively petrifying 213.
In fact, considering the next 10 years, the closest approach of Asteroid 2020 XU6 with the Earth is happening on Monday 22 February 2021 at 04:29 UTC time. At that time the closest distance between Asteroid 2020 XU6 and the Earth is 4,088,155 kilometers, which is a distance equivalent to 10.6333 Lunar Distances, or 641.68 Earth Radii.
How one could use data from the US and Japan to calculate the numbers for the Earth
If one assumes one has good data from AMS of the numbers observed over the US, and if one further makes the assumption, just to give a rough idea, that the distribution of events across the surface of the Earth is reflected by the observations over the US, then one could relate the area of the US to that of the Earth.
The surface of the US according to the Wiki is 9,833,520 km2 and the surface of the Earth is around 510,000,000 km2. If we approximate 9,833,520 km2 to 10,000,000 km2 it means the US covers 10/510 or 1/51 ~ 1/50 of the surface of the Earth.
Similarly for Japan: Japan covers according to the Wiki 377,976.41 km2. They have a LOT of coastline. the objects fly high and can be seen from far away. Giving Japan the benefit of doubt and honouring imperial ambitions, if one estimates the area to be 510,000 km2 then Japan covers 510/510,000 ~ 1/1000 of the surface of the Earth.
Using such models one should be able to find an estimate for the whole Earth.
One can multiply the observations from the US by 50 to get an idea of the number for the Earth. Or one can multiply the numbers from Japan by 1000.
Of course one could also compare the numbers from Japan with those from the US.
1/1000 relates to 1/50 as (1/1000)/(1/50) We need to divide a fraction with a fraction
The division of a fraction a/b by a non-zero fraction c/d is defined as the product of a/b with the multiplicative inverse or reciprocal of c/d. see]
and due to handy numbers, we get first 50/1000 and then 1/20.
To test the hypothesis of whether the numbers from Japan relatively speaking match those from the US one needs to answer if there is something like 20 times fewer observations in Japan than in the US, or if you wish, 20 times more in the US than in Japan when comparing observations within the same category.
There are of course differences in the density of observers, humans and robots, as also the weather conditions, indicated by the number of hours with sunshine, may vary between Japan on average, the US on average and even within the US. As such all these calculations will only give rough estimates, but they could tell us if we might be missing something over our own countries. One could add to the list of errors that some areas may be more susceptible than others.
Nice! Yes, the the data from AMS (but only within the US!) and from the Japan Network are the only two more or less reliable sources for fireball data over time that I could find (for a number of reasons). So using those two data points to get at a rough estimate of the global impact of fireballs is quite a valid idea IMO. Another factor to consider here: the AMS data is (as far as I know) significantly (if not totally?) based on eyewitness accounts while the data from the Japan network is apparently solely based on an automated-camera-detecting-system that has been established with various cameras throughout the country.
Also, from what I could gather about the workings of both systems (AMS and the Japan Network) I‘m fairly certain that the AMS data paints a more accurate picture in regards to the development of the number of fireball impacts over time: From what I can see, the AMS data is the best source we have in regards to that, followed by the Japan Network.
On Feb. 16 I saw an moving object on lasco 3 images (part of the SOHO satellite). I made a screencast of it but did not upload it anywhere. I still wanted to post about it because I would like to know what it could be.
You can see it here:
You sometimes can see comets on these images when they are around, but they look like comets. The blips and beeps are supposed to be dust or static or something. And you can see planets like Mercury or Venus when they are behind the sun, but they are much brighter/larger and they move from right to left and much slower. All the stars should move in coherence with each other and they should not fade into the distance like this object looks like it's doing.
There are of course differences in the density of observers, humans and robots, as also the weather conditions, indicated by the number of hours with sunshine, may vary between Japan on average, the US on average and even within the US. As such all these calculations will only give rough estimates, but they could tell us if we might be missing something over our own countries. One could add to the list of errors that some areas may be more susceptible than others.
In this post, I attempt to find a way to compare the data from Japan with those from the US taking into consideration the varying observation conditions. The main results are in the last two paragraphs.
To make matters even more complicated, the duration of the day and night also plays a role. If one wished to estimate the amount of good observation conditions for spotting fireballs, one would need the amount of sunshine hours for the location and the length of the day from sunrise to sunset.
A ratio between the number of sunshine hours and the length of the day for a given location would give a fraction that multiplied by the length of the night for the same location would give an estimate of the duration in which good observation conditions can be expected. Even this is not good enough, because it assumes the cloud cover is equally distributed day and night. How can we be sure of that, when some clouds are created by the sun shining on the ground making the water evaporate and later condense to form clouds, or the opposite, when it happens that the sun shines and the fog and low clouds break up and disappear as if burned away?
If across the globe, the difference in the duration of night and day average out over the period of one year to leave each day with 12 hours of daytime and 12 hours of nighttime, then we can estimate the total number of possible sunshine hours by multiplying 365 days by 12 hours. This number is 4380 hours out of a total of 8760 hours in a year. If we then assume the number of sunshine hours would convert into hours with decent conditions for observing a fireball, then it is clear we will be missing out a lot if a location has less than 1200 hours. Moreover, it may be difficult to catch the weaker fireballs near dawn or right after sunset, even if weather conditions are good. On the other hand, haven't there been recordings that show fireballs appearing briefly below an overcast sky? Or behind clouds?
Using the date from the US and Japan to get more accurate estimates
Moving on to the idea of comparing the statistics from Japan and the US, there are less hours suitable for observation in Japan than there are in most locations in the US. If Japan on average has 2000 hours and the US 2800, then one would need to multiply the numbers form Japan first with 20 and then by 1.4 to get something comparable. An then one could still try and estimate how many there might be in total, but which for one reason or another are not observed. If there are close to 9000 hours in a year, and only 1/4 to 1/3 are good for observations, then for the weaker fireballs that would not shine much during the day or be able to brighten up an overcast sky there would seem to be up to four times more than observed.
Reality is more complicated
There is an article from the International Meteor Organization that discusses Annual and Diurnal Variations in Fireball Rates. For a good model, these fluctuations in the fireball rate would have to be taken into consideration too. As a consolation, even if estimates of the total number of fireballs based on data from Japan or the US are not going to be great, they may still be useful, and when someone comes along with a better idea the underlying models can always be revised.
This site uses cookies to help personalise content, tailor your experience and to keep you logged in if you register.
By continuing to use this site, you are consenting to our use of cookies.
 www.express.co.uk
By SEAN MARTIN - Jan 29, 2021
www.express.co.uk
By SEAN MARTIN - Jan 29, 2021 theskylive.com