Michael B-C
The Living Force
“The bay-trees in our country are all withered,
And meteors fright the fixèd stars of heaven.
The pale-faced moon looks bloody on the earth,
And lean-looked prophets whisper fearful change.
Rich men look sad, and ruffians dance and leap;
The one in fear to lose what they enjoy,
The other to enjoy by rage and war.
These signs forerun the death or fall of kings.”
(Richard II, Act 2, Scene 4, 'Shake-speare')
Whilst researching the rise and subsequent disappearance of what I hypothesize was the most recent previous example to that of Gurdjieff and Laura of a 4th Way movement – namely the ‘Shake-speare’ project – I have become ever more acutely aware of the similarities in cosmic context to our time. Though it is likely that our transition into a new reality is going to be on a larger and even more seismic basis, the 100 years that surrounded the period of this ‘projects’ endeavors were extraordinary days of turmoil in the natural order of things and because we have a great deal more information on them than say the dark ages or medieval period disruptions, there is much I think we can learn by seeing what went on and how it impacts human life on earth.
Comets, supernova, strange natural phenomena, meteors, volcanic eruptions, earthquakes, pestilence, plague – you name it happened. All as a precursor to what has become known as the mini-ice age that commenced around 1600 and went on until the 19th century. It was also a time of unprecedented political, religious, economic and social revolution with a backdrop of human malevolence, conspiracy, near constant warfare, and mass death culminating in the too oft forgotten 30 years war of 1618-1648 that many historians have described as being in reality the true first world war (in that it involved all the major players of the European old world) with over 8million fatalities.
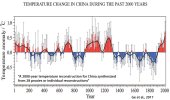
For context, here’s a reconstructed temperature charts for the last 1000 years, several sources combined (most recent in red) with contemporary measurements (ignore the oft debunked hockey stick data running up to today).
Temperature Comparison

All around the globe, different data reveals a steady decline beginning somewhere in the mid to late 15th century that deepened throughout the mid 16th century and continued well into the 17th before a slow rise to the 20th century’s period of so called ‘global warming’ (i.e. a return to levels seen previously in the Medieval Warm Period).
These significant temperature anomalies are correspondent to a build up to what has become known as The Maunder Minimum (or the “prolonged sunspot minimum”) between 1645 and 1715, a 70 year period during which sunspots became exceedingly rare, as noted by contemporary solar observers.
Taking a look at the mainstream view (which does everything it can to down grade the significance of this event), we read:
Despite the propaganda (nothing to see here folks!) there was something going on that in particular preceded the arrival full force of the mini-ice age taking place in the second half of the 16th century that may not have had that much to do with the sun cycles at that time – that the fall away of sun spots (suggestive of lower than normal sun activity) may have added to another set of unknown earlier cosmic causal links leading to a dramatic increase in violent earthquakes, volcanoes, tornados, floods, droughts, and other recurring anomalies.
We have significant reports of:
All the above and more took place against seismic changes in human behaviour with perpetual war, realignment of state and religious authority, world wide imperial activity (including the decimation of indigenous peoples everywhere) banking, the dramatic rise of the sciences, the emergence of a new wave of esoteric/secret societies, and the true birth of the humanist philosophy and movement.
Something monumental took place regarding and impacting human consciousness – the rise to dominance of the left brain ego wrapped up as the humanist movement - and the ‘Shake-speare’ project was right at the heart of baring witness to it.
The data is fascinating. For example I’ve been stunned to learn of the ‘Social Distancing’ practices that authorities put in place – especially well documented in England – each time the plague ravished the population, especially London. Reading the accounts and research its clear that living and dealing with repeat waves of viral epidemic became inbuilt into the collective consciousness over many decades, with acceptance of terrifying spikes in death rates as the new norm as well as a break down in food supply and increases in inflation coinciding with wage cuts. The authorities struggled to keep order with a range of legislation designed to give some support to the needy whilst extraditing to Australia all those malcontents who could have caused trouble at home! It even reached a place where Elizabeth I decreed the extradition of all ‘blackamoors!’ in an effort to keep order (stranger-danger). Sound familiar?
Here for example is the data on plague spikes in London 1560-1670 showing no less than 7 significant events with deaths between 12-48,000 (total population of London at that time was between 100-150,000).

Also for comparison, see the following graph regarding the decimation of the Mexican population between 1500 and 1570 by what came to be known as the Cocoliztli epidemics. It is important to note that the blanket suggestion these new world diseases were a product of interaction with European conquistadors is not supported by the data.

Below I have sifted through a number of sources to accumulate the following data that paints a powerful picture that there was a backdrop of mounting change taking place across the entire planet.
I hope this might inspire other forum members to add more data and further comment to fill out this picture.
And meteors fright the fixèd stars of heaven.
The pale-faced moon looks bloody on the earth,
And lean-looked prophets whisper fearful change.
Rich men look sad, and ruffians dance and leap;
The one in fear to lose what they enjoy,
The other to enjoy by rage and war.
These signs forerun the death or fall of kings.”
(Richard II, Act 2, Scene 4, 'Shake-speare')
Whilst researching the rise and subsequent disappearance of what I hypothesize was the most recent previous example to that of Gurdjieff and Laura of a 4th Way movement – namely the ‘Shake-speare’ project – I have become ever more acutely aware of the similarities in cosmic context to our time. Though it is likely that our transition into a new reality is going to be on a larger and even more seismic basis, the 100 years that surrounded the period of this ‘projects’ endeavors were extraordinary days of turmoil in the natural order of things and because we have a great deal more information on them than say the dark ages or medieval period disruptions, there is much I think we can learn by seeing what went on and how it impacts human life on earth.
Comets, supernova, strange natural phenomena, meteors, volcanic eruptions, earthquakes, pestilence, plague – you name it happened. All as a precursor to what has become known as the mini-ice age that commenced around 1600 and went on until the 19th century. It was also a time of unprecedented political, religious, economic and social revolution with a backdrop of human malevolence, conspiracy, near constant warfare, and mass death culminating in the too oft forgotten 30 years war of 1618-1648 that many historians have described as being in reality the true first world war (in that it involved all the major players of the European old world) with over 8million fatalities.
For context, here’s a reconstructed temperature charts for the last 1000 years, several sources combined (most recent in red) with contemporary measurements (ignore the oft debunked hockey stick data running up to today).
Temperature Comparison
All around the globe, different data reveals a steady decline beginning somewhere in the mid to late 15th century that deepened throughout the mid 16th century and continued well into the 17th before a slow rise to the 20th century’s period of so called ‘global warming’ (i.e. a return to levels seen previously in the Medieval Warm Period).
These significant temperature anomalies are correspondent to a build up to what has become known as The Maunder Minimum (or the “prolonged sunspot minimum”) between 1645 and 1715, a 70 year period during which sunspots became exceedingly rare, as noted by contemporary solar observers.
Taking a look at the mainstream view (which does everything it can to down grade the significance of this event), we read:
Little Ice Age

Comparison of group sunspot numbers (top), Central England Temperature (CET) observations (middle) and reconstructions and modelling of Northern Hemisphere Temperatures (NHT). The CET in red are summer averages (for June, July and August) and in blue winter averages (for December of previous year, January and February). NHT in grey is the distribution from basket of paleoclimate reconstructions (darker grey showing higher probability values) and in red are from model simulations that account for solar and volcanic variations. By way of comparison, on the same scales the anomaly for modern data (after 31 December 1999) for summer CET is +0.65oC, for winter CET is +1.34oC, and for NHT is +1.08oC. Sunspot data are as in supplementary data to and Central England Temperature data are as published by the UK Met Office The NHT data are described in box TS.5, Figure 1 of the IPCC AR5 report of Working Group 1.
The Maunder Minimum roughly coincided with the middle part of the Little Ice Age, during which Europe and North America experienced colder than average temperatures. Whether there is a causal relationship, however, is still under evaluation.
The current best hypothesis for the cause of the Little Ice Age is that it was the result of volcanic action. The onset of the Little Ice Age also occurred well before the beginning of the Maunder Minimum, and northern-hemisphere temperatures during the Maunder Minimum were not significantly different from the previous 80 years, suggesting a decline in solar activity was not the main causal driver of the Little Ice Age.
The correlation between low sunspot activity and cold winters in England has recently been analyzed using the longest existing surface temperature record, the Central England Temperature record. They emphasize that this is a regional and seasonal effect relating to European winters, and not a global effect. A potential explanation of this has been offered by observations by NASA's Solar Radiation and Climate Experiment, which suggest that solar UV output is more variable over the course of the solar cycle than scientists had previously thought. In 2011, an article was published in the Nature Geoscience journal that uses a climate model with stratospheric layers and the SORCE data to tie low solar activity to jet stream behavior and mild winters in some places (southern Europe and Canada/Greenland) and colder winters in others (northern Europe and the United States). In Europe, examples of very cold winters are 1683–84, 1694–95, and the winter of 1708–09.
The term "Little Ice Age" applied to the Maunder Minimum is something of a misnomer, as it implies a period of unremitting cold (and on a global scale), which was not the case. For example, the coldest winter in the Central England Temperature record is 1683–1684, but summers during the Maunder Minimum were not significantly different from those seen in subsequent years. The drop in global average temperatures in paleoclimate reconstructions at the start of the Little Ice Age was between about 1560 and 1600, whereas the Maunder Minimum began almost 50 years later.
Other observations

Solar activity events recorded in radiocarbon.

Graph showing proxies of solar activity, including changes in sunspot number and cosmogenic isotope production.
Past solar activity may be recorded by various proxies, including carbon-14 and beryllium-10. These indicate lower solar activity during the Maunder Minimum. The scale of changes resulting in the production of carbon-14 in one cycle is small (about one percent of medium abundance) and can be taken into account when radiocarbon dating is used to determine the age of archaeological artifacts. The interpretation of the beryllium-10 and carbon-14 cosmogenic isotope abundance records stored in terrestrial reservoirs such as ice sheets and tree rings has been greatly aided by reconstructions of solar and heliospheric magnetic fields based on historic data on Geomagnetic storm activity, which bridge the time gap between the end of the usable cosmogenic isotope data and the start of modern spacecraft data.
Other historical sunspot minima have been detected either directly or by the analysis of the cosmogenic isotopes; these include the Spörer Minimum (1450–1540), and less markedly the Dalton Minimum (1790–1820). In a 2012 study, sunspot minima have been detected by analysis of carbon-14 in lake sediments. In total, there seem to have been 18 periods of sunspot minima in the last 8,000 years, and studies indicate that the Sun currently spends up to a quarter of its time in these minima.
A paper based on an analysis of a Flamsteed drawing suggests that the Sun's surface rotation slowed in the deep Maunder minimum (1684).
During the Maunder Minimum aurorae had been observed seemingly normally, with a regular decadal-scale cycle. This is somewhat surprising because the later, and less deep, Dalton sunspot minimum is clearly seen in auroral occurrence frequency, at least at lower geomagnetic latitudes. Because geomagnetic latitude is an important factor in auroral occurrence, (lower-latitude aurorae requiring higher levels of solar-terrestrial activity) it becomes important to allow for population migration and other factors that may have influenced the number of reliable auroral observers at a given magnetic latitude for the earlier dates. Decadal-scale cycles during the Maunder minimum can also be seen in the abundances of the beryllium-10 cosmogenic isotope (which unlike carbon-14 can be studied with annual resolution) but these appear to be in antiphase with any remnant sunspot activity. An explanation in terms of solar cycles in loss of solar magnetic flux was proposed in 2012.
The fundamental papers on the Maunder minimum have been published in Case studies on the Spörer, Maunder and Dalton Minima.
Despite the propaganda (nothing to see here folks!) there was something going on that in particular preceded the arrival full force of the mini-ice age taking place in the second half of the 16th century that may not have had that much to do with the sun cycles at that time – that the fall away of sun spots (suggestive of lower than normal sun activity) may have added to another set of unknown earlier cosmic causal links leading to a dramatic increase in violent earthquakes, volcanoes, tornados, floods, droughts, and other recurring anomalies.
We have significant reports of:
- Extreme and large scale infection of mass populations – including regular outbreaks of plague.
- Increasing cometary activity and meteorites.
- Two significant supernovas including a pivotal event in Cassiopeia!
- Extreme observations in the sky – including ‘UFO’ type activity – vividly portrayed in such landmark works as ‘The Book of Miracles’.
- Human genetic mutation on a large enough scale that it became a source of widespread artistic and literary licence.
- Sexual depravity and huge rise in alcohol consumption.
- Widespread obsession and paranoia regarding witchcraft and demonology.
- Communion with ‘angels’, ‘familiars’ and other ‘spirits’.
- Apocalyptic writings and movements – end of time prophesies abounded, Etc.
All the above and more took place against seismic changes in human behaviour with perpetual war, realignment of state and religious authority, world wide imperial activity (including the decimation of indigenous peoples everywhere) banking, the dramatic rise of the sciences, the emergence of a new wave of esoteric/secret societies, and the true birth of the humanist philosophy and movement.
Something monumental took place regarding and impacting human consciousness – the rise to dominance of the left brain ego wrapped up as the humanist movement - and the ‘Shake-speare’ project was right at the heart of baring witness to it.
The data is fascinating. For example I’ve been stunned to learn of the ‘Social Distancing’ practices that authorities put in place – especially well documented in England – each time the plague ravished the population, especially London. Reading the accounts and research its clear that living and dealing with repeat waves of viral epidemic became inbuilt into the collective consciousness over many decades, with acceptance of terrifying spikes in death rates as the new norm as well as a break down in food supply and increases in inflation coinciding with wage cuts. The authorities struggled to keep order with a range of legislation designed to give some support to the needy whilst extraditing to Australia all those malcontents who could have caused trouble at home! It even reached a place where Elizabeth I decreed the extradition of all ‘blackamoors!’ in an effort to keep order (stranger-danger). Sound familiar?
Here for example is the data on plague spikes in London 1560-1670 showing no less than 7 significant events with deaths between 12-48,000 (total population of London at that time was between 100-150,000).
“Living standards and plague in London, 1560–1665 - Neil Cummins, Morgan Kelly and Cormac Ó Gráda”
Also for comparison, see the following graph regarding the decimation of the Mexican population between 1500 and 1570 by what came to be known as the Cocoliztli epidemics. It is important to note that the blanket suggestion these new world diseases were a product of interaction with European conquistadors is not supported by the data.
Below I have sifted through a number of sources to accumulate the following data that paints a powerful picture that there was a backdrop of mounting change taking place across the entire planet.
I hope this might inspire other forum members to add more data and further comment to fill out this picture.


