Near-Earth objects and close calls

As I was writing on the previous posts regarding the possibility of extrapolating from observations of fireballs in the US and Japan to the situation in the whole world, I began to reconsider a model for the amount of NEO flybys and the chances of a hit. I believe the model I once worked on needs to be reworked and new figures calculated. This post is divided into sections, and results are especially in the second but last.
Correcting an error and improving a model for calculating the number of flybys
In this post from 2019 I wrote:
If a hit could come from any direction, and there is an equal chance in the space around the earth for an object to pass by, then it seems the chance of the object hitting the space that the Earth occupies would be progressively smaller the greater the distance from the center of the Earth we consider.

How much smaller this might be, I try to estimate considering the space of Earth as being a globe which has the volume of 4/3 multiplied by pi (3.141592...) multiplied by the cubic value the Earth radius, which is the distance from the center of the Earth to the surface of the Earth. This can then be compared to the size of the space seen as a globe that is created by the distance between the center of the Earth and out to the object passing by when it is closest.
If one wishes to calculate the chance of a hit, is it really useful to work with the space? Would it not be useful to work with the area? I was considering how the rays of the Sun "hit" the Earth as this illustration shows:
gLOBEsUNSrAYS.jpg
If one in the above model expanded the radius r of the Earth, the area hit by the rays of the Sun would increase. The area would increase at a rate of the radius squared, as the formula for the area A of a sphere is 4*pi*r^2. If we inflated the Earth to twice the size it would make the radius equal to 2r, then the whole surface area would take up
4*pi*(2r)^2=4*(4*pi*r^2).

In the picture, the spot closest to the equator gets the same amount of energy as the spot further away, but no matter the spot, if one doubles the radius the surface taken up by the spots would become four times larger and they would receive four times more energy. One difference between this model looking at the rays of the Sun and one looking at possible impacts is that while the rays of the Sun come from one direction, the impacts could come from many directions. Still, the area increases in proportion to the radius squared.
Redoing the model for the number of flybys between us and the Moon
If we expanded the globe out to the average distance of the Moon, then the radius would have expanded a lot more. In the old post there was:
If we instead take the distance to the Moon, then the average distance is 238,855 miles. To find the ratio of misses to hits we first have 238,855 miles /4000 miles per each Earth radius. This gives us close to the equivalent of 59-60 Earth radii between the center of the Earth and the Moon.
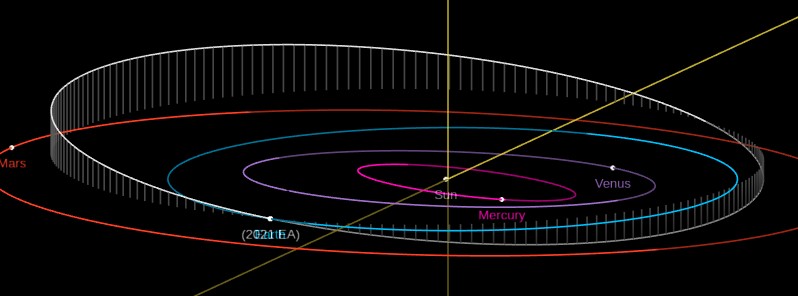
The surface of the globe with a radius equal to 60 Earth radii would be 4*pi*(60r)^2 or 3600*(4*pi*r^2) or 3600 times that of the Earth. This means that if we had really good data on the number of impacts for the whole Earth then 3599 times that would give us an idea of the number of flybys between the Earth and the Moon. I believe this makes for a better model than the previous results which I have quoted and corrected below according to the new calculation.
This gives us close to the equivalent of 59-60 Earth radii between the center of the Earth and the Moon. 59^3 is 205.379. In other words, for every strike there will be around 200,000 [3599] misses passing by within the space of a celestial globe around the Earth that extends to the average distance of the Moon.
Using the new model to calculate the number of NEO flybys in 2020
Next, I went to the NASA table of Fireball and Bolide Data and they have listed 42 impact events in 2020 and so far just five for 2021. If there were 42 impacts which corresponds to once every 9 days, and assuming none of them were caused by reentering satellite debris, then there must have been approximately 3600 that number of flybys. And instead of saying there where 3600*42 flybys in 2020, we could say there were roughly 400 per day or 16 -17 per hour. The impact energy of the registered events in 2020 varied between 0.073 and 9.5 kT. The 9.5 kT was the "Jupiter-Saturn conjunction and winter solstice" blast over China on December 22, 2020. Though 9.5 is almost nothing compared to the 440 kT of the Chelyabinsk impact in 2013. Looking at the table there are 857 entries and 9.5 kT comes in as the 15th largest, and therefore 15/857 or about 1 in 56 could be that big or bigger. If there are 400 flybys, then 400/56~7 per day would pass by having that much power.

The registered impacts above 0.1 kT during the last 33 years
Here is a picture from the above NASA site of the current impact events larger than 0.1kT. The NASA site also has links to spreadsheets one can order the data according to year and size. Here is the latest map of the 1/3600 of the NEO that did not fly by actually did land.

Screenshot 2021-02-25 200049.png
The above map is quite good, though since the Earth is a globe the relative distances and sizes are distorted and gives a false impression of the density of these impacts. The colour scale is logarithmic, just like in the Volcanic Explosivity Index. Between the smallest impacts on the map and the largest, there is a difference of more than a factor 4000. In other words, the biggest is 4000 times more powerful than the smallest.
 
Last edited:
A huge asteroid will fly past Earth on March 2, 2021.

26 Feb, 2021

 
There is an article from the International Meteor Organization that discusses Annual and Diurnal Variations in Fireball Rates.
In the article, one finds a mention of fireball showers, which indicates something altogether more powerful than the light display usually left by the small shooting stars we are most familiar with.
Furthermore, some authors suggest we can expect fireball showers (e.g. Astapovich and Terentjeva, 1968), but experience shows the influence of these on regularly observed rates to be very low. In past centuries some reports of fireball showers have been noted (Dall’Olmo, 1978) but it could possibly be that such showers are only reports of bright meteors between magnitudes +1 mag and -2 mag.
The sources are:
  • Astapovich I.S., Terentjeva A.K. (1968):
    “Fireball radiants of the 1st-15th centuries”
    L. Kresák, P.M. Millman (eds.), Physics and dynamics of meteors. IAU Symp. 33 Reidel, Dordrecht, p.308–319.
  • Dall’Olmo W. (1978):
    “Meteors, meteor showers and meteorites in the middle age: from European medieval sources.”
    J.Hist.Astron. IX, p.123–134
It was not possible for me to find the above papers, though the titles of the papers are telling. One could note that "Astapovich I.S., Terentjeva A.K." looks Slavic and it is: Астапович И. С., Терентьева А. К. were from the former U.S.S.R.

A more recent study of super fireballs
On the frequency of the superfireballs: more than 150 years of reports by Sandra Zamora1 , Francisco Ocaña1 , Alejandro Sánchez de Miguel1 and Maruška Mole2
Superfireballs are rare phenomena for which the reports are scarce and the estimation of their abundance has a huge margin of uncertainty. As a citizen science project we have gathered >500 reports from newspapers in the 1850-2000 period. This database shows how some superfireball abundances are constant during the period, though the reference newspapers have changed in the last two centuries. We have tentatively related some fireball sources to well-known meteor showers (Perseids, Geminids and Leonids), while superfireball sources may be related to minor or unknown showers, probably of asteroidal origin.
The advantage of one going back 150 years is that some streams of comet debris giving rise to large fireballs may have longer orbits, and not come in close to the Earth very often. In their conclusion, the researchers write:
The superfireball reports gathered for the period covering the last 150 years show statistically significant overabundance peaks for some periods of the year. During these periods we find no evidence of fireballs/meteor showers. These intervals are centered in (dates in epoch 2015):  July 3 ( λ☉=101º)  July 20 (λ☉=117º)  October 2 (λ☉=188º)  February 12 (λ☉=323º)  February 22 (λ☉=333º)
The results of Zamora, Ocaña, Sánchez de Miguel and Mole were based on newspaper reports, and some of these reports may have been about event that also appears in the NASA list. If one instead of the newspaper reports used the same statistical tools as Zamora et al. and applied them to the more than 850 observations registered in this NASA list, of which many have been added since the above paper was published in 2015, would one be able to find patterns that are statistically significant and would they confirm the dates Zamora et al suggested?
 
If this has been posted already, I could not find any visible diagrams from 2021.

Bolide Detections from Geostationary Lightning Mapper

The Geostationary Lightning Mapper (GLM) aboard the GOES 16 and GOES 17 satellites, is designed to capture natural lightning activity, but it is also capable of detecting bright meteors, called bolides. GLM's large coverage area allows it to capture unprecedented numbers of meteors and its data is publicly accessible. More background about this data, hints on how to use this website, and the latest news and updates can all be found here.
Screenshot 2021-02-28 000636.png
If one goes to the page and holds the cursor over the dots, then a popup window appears with information about the event and its duration measured in seconds. On the same page, there is a link to an event list. One could compare the entries with those on the AMS list to get an idea or what differences there are.
Screenshot 2021-02-28 000656.png
By now there really is quite a lot of data one could analyse. When one looks at the above diagram, one notices the number of observations has risen. Is that because they have trained the sensors of the satellites, or is it evidence the numbers have really been increasing? They must have been increasing, even as observed from the ground. Last year there was just one video of a bright fireball after the other.
 
Last edited:
If this has been posted already, I could not find any visible diagrams from 2021.

View attachment 43248
If one goes to the page and holds the cursor over the dots, then a popup window appears with information about the event and its duration measured in seconds. On the same page, there is a link to an event list. One could compare the entries with those on the AMS list to get an idea or what differences there are.
View attachment 43249
By now there really is quite a lot of data one could analyse. When one looks at the above diagram, one notices the number of observations has risen. Is that because they have trained the sensors of the satellites, or is it evidence the numbers have really been increasing? They must have been increasing, even as observed from the ground. Last year there was just one video of a bright fireball after the other.

Interesting find! I will take a closer look at it for sure and see if could be used for the database.
 
It looks like that system became operational rather recently and there are some uncertainties in how reliably it can detect bolides and differentiate them from ordinary lightning. So it can’t give us a reliable indicator of fireball activity over time. Having said that, it might become a useful source in that regard in terms of development over time in the future and it might be interesting to compare that data with the fireball data from AMS and Japan:

About GLM & Bolides​

The Geostationary Lightning Mapper, aboard the GOES 16 and GOES 17 satellites, is designed to capture natural lightning activity, but can also detect bright meteors, called bolides (e.g. Jenniskens et al 2018, Rumpf et al 2019). These two space-based remote sensing systems are operated by the National Oceanic and Atmospheric Administration (NOAA) and became operational in December 2017 (GOES 16) and in February 2019 (GOES 17). GLM's large coverage area allows it to capture unprecedented numbers of meteors. GLM data is publicly accessible. The current data products are generated by the GLM pipeline, which makes several assumptions that are not valid for bolides, so additional corrections maybe necessary for some purposes. More details can be found here.
 
The American Meteor Society (AMS) has received 766 reports of the event, the most widely reported in the UK since event 5538-2017 on December 31st 2017.

This morning the American Meteor Society (AMS) had received 1066 reports, which makes it the most widely reported event in the UK since their modern database system began in 1980.

BBC News reports meteorites are likely north of Cheltenham and that a sonic boom had been reported.

 
A newly-discovered asteroid made a close approach to Earth on March 2, 2021.

Posted by Teo Blašković on March 3, 2021

 
Meteorite crash in SW France: (DeepL translation)

image.png

A fireball passed over the Gers on the night of Saturday to Sunday. A phenomenon so well tracked by the Fripon astronomical camera network, that the meteor could well be found!

An astronomical visitor passed through the sky of the Gers on February 27th, even eclipsing the brightness of the full moon for a short moment. An intense blue dot, which produced an orange sheaf at the end of the journey. At 11:43 pm, this meteor really played the star: no less than 9 cameras immortalized its brief career, and more than 80 people saw it, and reported it, in all the French regions south of Paris. Some even thought it was a fireworks display.

The different views of the meteor captured by the Fripon network cameras

The fireball flew through the air for 5 seconds, crossing the Gers, from Fleurance to Marmande in Lot-et-Garonne. According to astronomers' calculations, the meteor arrived at 21 km/s - or more than 75,000 km/h - from the outer zones of the asteroid belt between Mars and Jupiter. The initial mass of this celestial rock is estimated at 500 g... which quickly melted in a 50 km fall! No giant crater at the arrival: only about 150 g must have touched the ground.

The Fripon program, a network of cameras turned towards the sky to locate meteorites, has an observatory in the Gers, at the Ferme des Étoiles, linked to the association À Ciel Ouvert, in Mauroux. It has followed the route of this fireball from beginning to end. And this in such a precise way that it is quite possible to find it. This would be the first meteor discovery made thanks to this network.

Research on the ground

Members of A ciel Ouvert have been trained in the Vigie-Ciel protocols, a participatory science program that coordinates meteorite searches. In the next few days, the hunt will begin in the field, respecting health regulations and private property.

The "meteorite gatherers" must respect a coordinated protocol, established thanks to the experience gained during the first meteorite test searches of the last few years. The study of meteorites remains one of the means to study the formation of the solar system. The Fripon network detects between 2 and 4 meteorites each week as they enter the atmosphere, but rarely with such accuracy.

image.png
The search area in Lot-et-Garonne

The probable meteor fall zone does not exceed one square kilometer, in an area of fields and small scattered groves. The search area forms an ellipse between the villages of Lagarrigue, Nicole, Bourran and Aiguillon. The testimonies of the inhabitants will be invaluable in trying to find this celestial body.
 
It looks like that system became operational rather recently and there are some uncertainties in how reliably it can detect bolides and differentiate them from ordinary lightning.
That is true. Thinking about a way to get an idea of the size of the problem I tried to find maps showing lightning activity, even if the lightning that could be seen from space would not be ground strikes, but cloud to cloud, or better cloud to air or even space, like sprites:

The NASA information page on SEVERE WEATHER 101 > Lightning Types has this:

Cloud Flashes

There are many flashes which do not reach ground. Most of these remain within the cloud and are called intra-cloud (IC) lightning flashes. Cloud flashes sometimes have visible channels that extend out into the air around the storm (cloud-to-air or CA), but do not strike the ground. The term sheet lightning is used to describe an IC flash embedded within a cloud that lights up as a sheet of luminosity during the flash.
It seems to be easier to encounter maps of the ground strikes. Here is one from an article in IEEE Spectrum
MzM0ODExNw.png
And a Russian map that did not explain what type they counted.
lightning-strike-map2.jpg
On both of the two previous maps, the landmasses and nearby areas stand out, but I wouldn't say that is very clear at all when one takes a second look at the map with the satellite observations. If the cloud to cloud and cloud to space follow the patters of activity over land, as one might expect, then the map most be showing something.
Screenshot 2021-02-28 000636.png
Next, one could try to calculate the area covered by the satellites. Here is one map with a semblance of coordinates.
Map-Coordinates-v4.8.9-Pro.png
Comparing the two previous maps, one has an idea that most of the measurements appear to be within 180 West to 15 West longitude and then from 50 South to 50 North latitude. Next, one could ask how much of an area that would be compared to the whole Earth and also if the satellites can register the flashes in daytime or how strong they would have to be to make that possible?
 
Last edited:
Back
Top Bottom