The Ice Age Cometh! Forget Global Warming!

Vox Day notices the first stirrings of awareness in Europe that this winter won't be a whole lot of fun:

Ten. As in a decade.
-------

18bb33586c361285.jpeg

Belgian Prime Minister Warns of 10 ‘Difficult’ Winters for Europe

The next “5 to 10 winters will be difficult,” Belgian Prime Minister Alexander De Croo warned on Monday as energy prices in Europe soared to new records.


Vox Day notices the first stirrings of awareness in Europe that this winter won't be a whole lot of fun:

 
Just for...er... amusement purposes?
-------------------------------------------------------


Farmers’ Almanac: 20 Signs of a Hard Winter Ahead

20100217-deepsnow.jpg
Big snow.


There are a lot of old wives’ tales about how to predict a harsh winter during the fall. A lot of them are ridiculous and wrong, but these ones here… these ones here are tried and true, 100%, bet your bottom dollar.

“Ok, the Farmers’ Almanac prediction for a Numbingly Cold winter is out, but what are the real experts saying? A wonderful friend of Ray Geiger, (Cleveland weather guru – Dick Goddard) put together a laundry list of “signs” of nature. We featured these in the 1978 edition and it is still relevant today.”

– Farmers Almanac

1. Thicker than normal corn husks
2. Woodpeckers sharing a tree
3. Early arrival of the Snowy owl
4. Early departure of geese and ducks
5. Early migration of the Monarch butterfly
6. Thick hair on the nape (back) of the cow’s neck
7. Heavy and numerous fogs during August
8. Raccoons with thick tails and bright bands
9. Mice eating ravenously into the home
10. Early arrival of crickets on the hearth
11. Spiders spinning larger than usual webs and entering the house in great numbers
12. Pigs gathering sticks
13. Insects marching a beeline rather than meandering
14. Early seclusion of bees within the hive
15. Unusual abundance of acorns
16. Muskrats burrowing holes high on the river bank
17. “See how high the hornet’s nest, ‘twill tell how high the snow will rest”
18. Narrow orange band in the middle of the Woollybear caterpillar warns of heavy snow
19. The squirrel gathers nuts early to fortify against a hard winter
20. Frequent halos or rings around the sun or moon forecast numerous snowfalls

All of these factual winter forecasting tools come from our friends at the Farmers’ Almanac:

Harsh-winter-part2-ice-storms-10.jpg
Ice storms aren’t cool.
 
Last edited:
I thought we were going to have a very hard winter when I saw that there were many more hazelnuts broken in half and emptied, for their reserves, than in other years.
We will see!

J'ai pensé qu'on va avoir un hivers très dur quand j'ai vu qu'il y avait beaucoup plus de noisettes cassées en deux et vidées, pour leurs réserves, que les autres années.
On verra !
 

One interesting point midway down in this piece is the relationship between earth acceleration (which is happening) and grand solar minima. I've been seeing the year 2030 hypothesized as the start of the next GSM with a degree of consistency. This paper is another one.

Nils-Axel Mörner is the former head of the paleogeophysics and geodynamics department at Stockholm University. He retired in 2005 and since has dedicated his days to disproving the IPPC’s thermageddon nonsense while also warning of a coming Grand Solar Minimum.

Between 1997-2003, Mörner chaired an INTAS project on Geomagnetism & Climate — a project concluding that by the middle of the 21st century the Sun would be in a new solar minimum and Little Ice Age climatic conditions would prevail on Earth.

These conclusions were quite straightforward, writes Mörner, and were included in a Special Issue of PRP:

“Obviously we are on our way into a new grand solar minimum. This sheds serious doubts on the issue of a continued, even accelerated, warming as proposed by the IPCC project.”

This quite innocent, logically and honest account made the publisher take the remarkable step of closing down the entire scientific journal. This censorship gave rise to turbulence and objections within the scientific community, but it didn’t stop Mörner, who kept publishing scientific works regarding the impending GSM.

In 2015, Mörner’s “The Approaching New Grand Solar Minimum and Little Ice Age Climate Conditions” was published. The paper suggests that by 2030-2040 the Sun will experience a new grand solar minimum.

This is evident from multiple studies of quite different characteristics, writes Mörner:

“The phasing of sunspot cycles, the cyclic observations of North Atlantic behavior over the past millennium, the cyclic pattern of cosmogenic radionuclides in natural terrestrial archives, the motions of the Sun with respect to the center of mass, the planetary spin-orbit coupling, the planetary conjunction history, and the general planetary-solar-terrestrial interaction.”

During the previous grand solar minima—i.e. the Spörer Mini-mum (ca 1440-1460), the Maunder Minimum (ca 1687-1703) and the Dalton Minimum (ca 1809- 1821)—the climatic conditions deteriorated into Little Ice Age periods.


Salvador presented a mathematical model of the sunspot cycles based on Wilson’s tidal-torque model–above.

Salvador’s model had an 85% correlation with the sunspot numbers observed for 1749-2013, and made “a reasonable representation of the sunspot cycles for the past 1000 yr.”

Therefore, it justified an extrapolation for the next century:


The prediction gives an extended low up to 2160 with the lowest values reached within the period 2028-2042; i.e. just where we expect the New Grand Solar Minimum to occur.

In 2015, Salvador extended his analysis over the last 4000 years, comparing his model with the observed 10Be variations:


The phasing of the solar cycles gives a clear message for the middle of the century: there will be a New Grand Solar Minimum. The same message is seen when we consider the cyclic relations between Earth’s rotation, ocean circulation, and Arctic climate, too.

During the last three grand solar minima—the Spörer, Maunder and Dalton Minima—global climate experienced Little Ice Age conditions. Arctic water penetrated to the south all the way down to Mid Portugal, and Europe experienced severe climatic conditions. The Arctic ice cover expanded significantly.


“We now seem to be in possession of quite convergent data indicating that we, by 2030-2040, will be in a New Grand Solar Minimum which, by analogy to past minima, must be assumed will lead to a significant climatic deterioration with ice expansion in the Arctic.”

The mathematical model by Salvador seems to provide an excellent tool for the prediction of future sunspot variations.

All this precludes a continual warming as claimed by the IPCC. Instead of this, concludes Mörner, we are likely to face a new Little Ice Age.
 
After a brief search, I found this interesting piece of history recounting the pre-Confederation Canadian experience of 1816, the 'Year Without A Summer'. The article includes newspaper snippets and journal entires that detail the concerns and observations of the people at the time. As can be expected, there's drought, crop failure, and food shortages.


I find this piece quite interesting to read - not just because I live in Canada - but also because I've noticed that most reporting on GSM stuff tends to focus on Europe and the Gulf Stream, almost to the exclusion of most of the rest of the world. The article focuses on the Canadian experience, but it does pan out and mention the Tambora eruption as the most likely cause of the temperature drop.

...in 1819 HBC trader and Red River surveyor Peter Fidler observed:

Within these last 3 years the climate seems to be greatly changed the summers being so backward with very little rain & even snow in Winter much less than usual and the ground parched tip that all kinds of grass is very thin & short & most all the small creeks that flowed with plentiful streams all summer have entirely dried up after the snow melted away in the spring. ... Wheat, Barley, & potatoes have been cultivated here a few years back to a considerable extent last summer a considerable quantity was sown & planted of the kinds above mentioned but owing to the very dryness of the season not even a single stalk was reaped or potatoes taken up and here before when showery summers the wheat would produce above 40 Barley 45 and the potatoes 50 fold. Even all the smaller Kinds of vegetables failed from the same cause but the first week in Augt last clouds of Grasshoppers came & destroyed what little barley especially had escaped the drought.

The world the Selkirk settlers knew was a cooler one than our own. They were living in the Little Ice Age, the interval between the 1450 and 1850 when global temperatures were between 1.0 and 2.0°c cooler than they are now.

Within that, the settlers were living in what some climatologists say was a cooling trend between 1809 and 1820. And in the middle of that came the 1815 eruption of Tambora. For settlers living on the edge of existence on the central North American plains, its effects were very nearly the last straw.

I found another short article - Reader's Digest, of all places - that makes the case for Tambora much more strongly. It also makes mention of chaos in India, including the world's first cholera epidemic.

The year without a summer​

In the spring of 1815, things were looking up for Canada.

Local Canadian militia, along with British forces and their Indigenous allies, had just thwarted an American invasion in the War of 1812. Casualties aside—York (now Toronto) was briefly captured and Newark (now Niagara-on-the-Lake) was burned down—the Canadians stood their ground. Lower Canada (present-day Quebec) had a population of about 335,000 people, while Upper Canada (present-day Ontario) had 95,000. Newfoundland, meanwhile, was home to a further 52,000 people.

For the first time, these Canadians—many of whom were newly-arrived immigrants with no connection to the Crown—started to feel like Canadians.

Sixteen-thousand kilometres away, however, trouble was brewing.

The largest volcanic eruption in 2,000 years​

On April 5, 1815, Mount Tambora, a volcano on the island of Sumbawa in the Indonesian archipelago, suddenly erupted. Five days later, Tambora erupted once again, this time releasing 100 cubic kilometres of molten rock—and ash clouds that covered an area the size of Australia—into the sky.

Nearly 12,000 people living near Mount Tambora died—the victims of falling rocks and fast-moving gas currents. Over the next several months, an estimated 80,000 more would perish from starvation, contaminated drinking water, or respiratory infections from the ash that still remained in the atmosphere.

Scientists now know that Mount Tambora is the largest volcanic eruption of the last 2,000 years. In order to “rate” a volcano, today’s researchers use the Volcanic Explosivity Index: a system that uses whole numbers from zero to eight to measure the amount of ash, dust and sulphur a volcano throws into the atmosphere.

Iceland’s Eyjafjallajökull volcano, which erupted in 2010 and delayed air travel in Europe for six days, rates a mere four on the Volcanic Explosivity Index. The 1980 eruption of Mount St. Helens in Skamania County, Washington, is considered a five. Krakatoa, which erupted in 1883 and is also located in Indonesia, has been deemed a six.


Mount Tambora is the only stratovolcano (a volcano composed of alternating layers of lava and ash) to ever receive a score of seven.

Along with ash particles, the eruption also released 100-million tonnes of sulfuric acid into the stratosphere, writes historian William K. Klingaman and meteorologist Nicholas P. Klingaman in the book The Year Without Summer. Over the next 12 months, this aerosol cloud spread around the world, cooling temperatures by drastically reducing the amount of solar energy that was able to reach Earth.

A summer of starvation and misery​

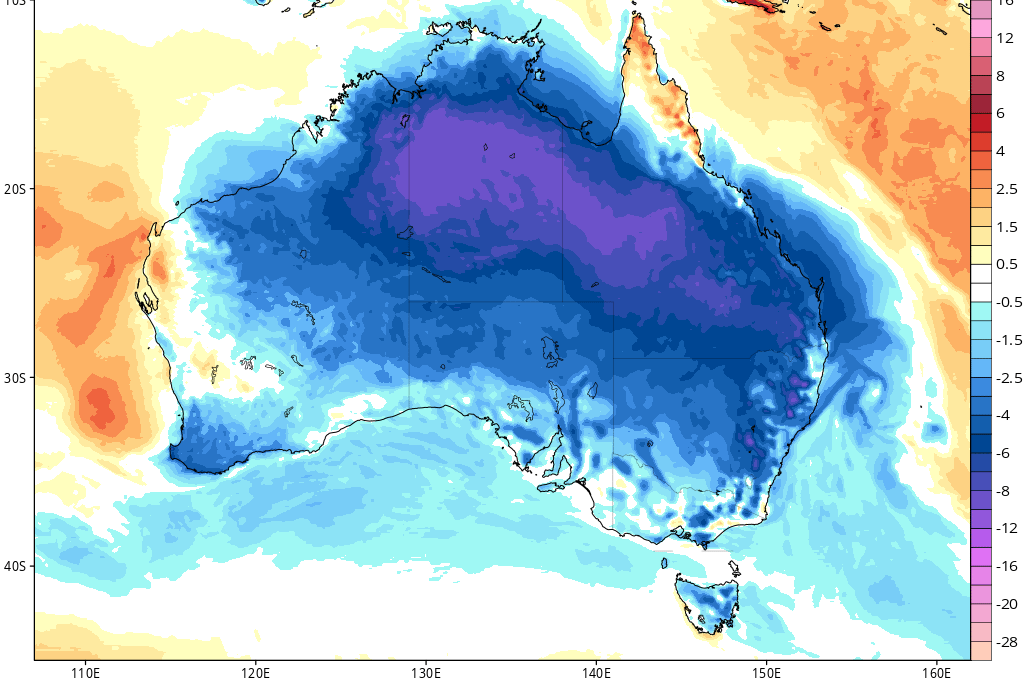
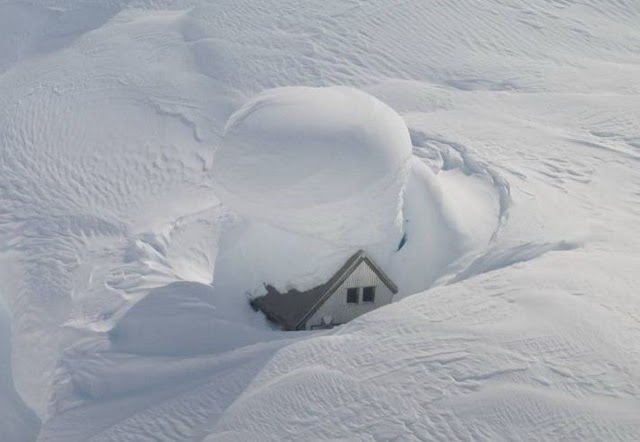
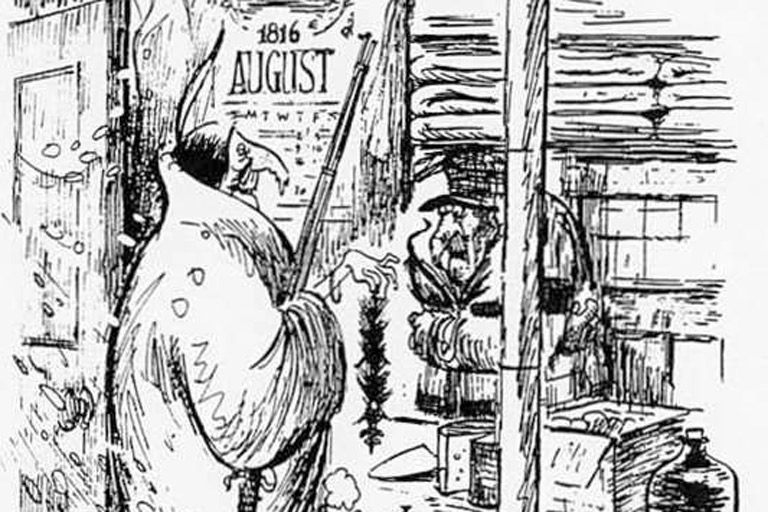
It took a full year after the eruption for the shockwaves to reach Canada. On April 12, 1816, it began snowing in Quebec City—and it didn’t stop. A news report from April 18 wrote, “The country has all the appearance of the middle of winter, the depth of snow being still between three and four feet. We understand that in many parishes the cattle are already suffering from a scarcity of forage.”

By June, the noontime temperature in central Ontario was just one below zero. In the Quebec countryside, newly-shorn sheep began dying from the cold. The Montreal Herald, meanwhile, urged readers to plant as many potatoes as possible in case the summer’s wheat crops failed completely.


Out west in Brandon, Manitoba, Peter Fidler of the Hudson’s Bay Company witnessed a cold spell that began on June 5. “A very sharp frost at night… killed all the barley, wheat, oats and garden stuff above the ground except lettuce and onions,” he wrote. “The oak leaves are coming out as if they are singed by fire and dead.”

Cold fronts continued to sweep through Lower Canada in July. By then, growing season was three weeks behind. To avoid famine, the governor of Lower Canada banned the export of wheat, flour, beans and barley until September. At the same time, he opened Canadian harbours to grain imports from the U.S.—free of tariffs.

His efforts, however, were in vain. By September, Lower Canada was destitute. Up to four-fifths of the region’s hay crops were ruined, while the frost left the province with a small wheat harvest and an even smaller supply of oats. Farmers were forced to sell their dairy cows to buy bread, while others survived on a diet of wild herbs.


Disaster for the rest of the world​

Eastern Canada was far from the only region affected that summer, however.

Summer frosts also devastated much of the eastern United States, from New England to Virginia. Failing crops and rising bread prices led many hungry settlers to leave for areas in the Midwest, particularly modern-day Indiana and Illinois.

Across the Atlantic, the citizens of Germany and France struggled with surging food prices. In the Netherlands, rainstorms destroyed so much hay and grain crops that farmers, fearing their livestock would die of starvation, began slaughtering them. Ireland, meanwhile, faced famine as the region’s wheat, oat and potato harvests failed.

India was ravaged by several late-season downpours. As harvests failed, a combination of famine, mass migration and crowded communities led to the world’s first cholera pandemic. By the winter of 1816, the disease broke out of northeastern Bengal—where it killed 10,000 people in two weeks—and spread across Nepal, Thailand, the Philippines, China and Japan.


The aftermath​

While Mount Tambora’s toxic aerosol cloud had its most catastrophic impact in the summer of 1816, weather patterns around the world continued to be affected for at least another two years.

The stratovolcano erupted again 1819—this time, it registered only a two on the Volcanic Explosivity Index. It erupted twice more between 1847 and 1913, and again in 1967. A string of earthquakes on Sumbawa in 2011 led the Indonesian government to fear another eruption, but experts believe no explosion from Mount Tambora would again approach the magnitude of 1815-16.

Now that you know the story of the year without a summer, find out what it was like on the coldest day in Canadian history.


On a cultural-antennae/collective-subconscious note... I just noticed on Netflix that there are a number of new cold-survivalist movies. One is about Inuit elders, another about plane crash survivors, and another about escapees from a gulag; all of them facing the cold and trying to make it through.
 

One interesting point midway down in this piece is the relationship between earth acceleration (which is happening) and grand solar minima. I've been seeing the year 2030 hypothesized as the start of the next GSM with a degree of consistency. This paper is another one.

All of that was excellent and sure does explain some things.
 

One interesting point midway down in this piece is the relationship between earth acceleration (which is happening) and grand solar minima. I've been seeing the year 2030 hypothesized as the start of the next GSM with a degree of consistency. This paper is another one.
Fascinating! Thanks for sharing.

I cannot help but think of the graph in Pierre's books Earth Changes and the Human-Cosmic connection (p. 127) and Cometary Encounters (p. 172) about how influenced is Earth spin rate and its internal electric field by modulated Sun activity (comets being major modulators) and how it affects the Earth shape and then "can cause earthquakes and volcanic eruptions, through crustal slippage, crust deformation and reduction in the 'binding force'."

How Earth spin rate affects its shape.jpg
 
August snowfall in 2 regions of China once on the 20th and later on the 27th.

-----------------------------------------------------------------------------

A sudden bout of heavy snow hit multiple mountainous areas in Altay Prefecture, northwest China's Xinjiang Uygur Autonomous Region on Saturday, cooling the weather to below zero degree Celsius.

More than 10 centimeters of snowfall are spotted in some areas of the prefecture, a rarely seen summer or early autumn weather in many other parts of the vast country. The snow cover was expected to melt on August 21 as the air temperature picked up again in mountainous areas in Altay, according to the local meteorological authorities.


-------------------------------------------------------------------------------

 
According to DiscloseTV's Twitter account, using Greenland Polar Portal's charts, 'Greenland ice sheet gained 7 Gigatons of mass in just one day yesterday — the largest daily gain ever recorded during the summer.'

For some reason the portal is currently unavailable, so i can't check this claim. No outlets are currently reporting it, but i came across a report of a similar ice gain back in 2020, except it occurred in February. ADDED: according to Electroverse, there was another 7 Gigatons recorded in June 2022 (which actually seems to show on the cart below):


Pic for posterity:
Link to portal: https://t.co/2EvukuPcAM
 
Last edited:
According to DiscloseTV's Twitter account, using Greenland Polar Portal's charts, 'Greenland ice sheet gained 7 Gigatons of mass in just one day yesterday — the largest daily gain ever recorded during the summer.'

For some reason the portal is currently unavailable, so i can't check this claim. No outlets are currently reporting it, but i came across a report of a similar ice gain back in 2020, except it occurred in February.


Pic for posterity:

Link to portal: https://t.co/2EvukuPcAM
I guess it's a good thing I bought that blizzard suit... :whistle:
 

One interesting point midway down in this piece is the relationship between earth acceleration (which is happening) and grand solar minima. I've been seeing the year 2030 hypothesized as the start of the next GSM with a degree of consistency. This paper is another one.
The article mentions that there's a correlation between earth's rotation speed and solar minimum and maximums.

So I took a look here and reproduced their table below. Look at the Total yearly difference:


YearAverage dayTotal yearly differenceShortest dayLongest dayLeap second added
2022-0.30 ms-111.08 msNov 29 -3.40 msNov 5 +0.71 ms-
2021-0.18 ms-65.15 msJul 9 -1.46 msApr 26 +1.00 ms-
2020-0.00 ms-1.30 msJul 19 -1.47 msApr 8 +1.62 ms-
2019+0.39 ms+141.25 msJul 16 -0.95 msMar 22 +1.68 ms-
2018+0.69 ms+252.47 msJun 30 -0.64 msFeb 4 +1.69 ms-
2017+1.03 ms+375.01 msAug 4 +0.06 msApr 25 +2.20 ms-
2016+1.34 ms+490.76 msJul 18 -0.03 msMar 10 +2.49 msDec 31
2015+1.25 ms+458.03 msJun 17 +0.19 msOct 26 +2.31 msJun 30
2014+0.99 ms+362.96 msJul 24 +0.02 msApr 26 +2.02 ms-
2013+1.02 ms+373.99 msJul 6 -0.35 msMar 28 +1.97 ms-
2012+0.83 ms+304.11 msJul 16 -0.35 msApr 5 +1.87 msJun 30
2011+0.76 ms+277.94 msJul 27 -0.34 msMay 14 +1.85 ms-
2010+0.70 ms+254.74 msJul 23 -0.76 msMar 1 +2.09 ms-
2009+0.80 ms+293.37 msJul 6 -0.43 msApr 22 +1.81 ms-
2008+0.87 ms+319.49 msJul 16 -0.41 msApr 5 +1.91 msDec 31
2007+0.85 ms+310.81 msJul 27 -0.63 msApr 16 +2.31 ms-
2006+0.82 ms+300.88 msJun 12 -0.40 msOct 7 +2.26 ms-
2005+0.43 ms+157.76 msJul 5 -1.05 msFeb 27 +1.73 msDec 31
2004+0.31 ms+114.01 msJul 15 -1.05 msApr 5 +1.56 ms-
2003+0.27 ms+100.16 msJul 13 -0.96 msMar 19 +1.55 ms-
2002+0.48 ms+173.79 msAug 6 -0.74 msMar 2 +1.66 ms-
2001+0.57 ms+208.94 msAug 2 -0.71 msMar 11 +1.64 ms-
2000+0.72 ms+262.42 msAug 11 -0.25 msOct 26 +1.58 ms-
1999+0.99 ms+361.19 msJun 30 -0.13 msApr 15 +1.93 ms-
1998+1.37 ms+501.72 msJul 9 +0.01 msMar 1 +2.66 msDec 31
1997+1.84 ms+671.08 msJul 4 +0.52 msApr 6 +2.98 msJun 30
1996+1.82 ms+666.37 msAug 10 +0.67 msMay 12 +2.68 ms-
1995+2.31 ms+843.66 msJul 25 +0.81 msMar 17 +3.29 msDec 31
1994+2.19 ms+800.86 msJul 6 +0.86 msFeb 27 +3.36 msJun 30
1993+2.36 ms+862.66 msJul 17 +1.25 msMay 2 +3.49 msJun 30
1992+2.22 ms+812.25 msJul 12 +0.84 msMar 18 +3.59 msJun 30
1991+2.04 ms+743.88 msJun 27 +0.79 msMar 1 +3.00 ms-
1990+1.95 ms+710.04 msJul 20 +0.63 msMar 26 +3.28 msDec 31
1989+1.52 ms+555.00 msJul 2 +0.25 msNov 10 +2.82 msDec 31
1988+1.31 ms+480.30 msJul 12 -0.09 msFeb 20 +2.76 ms-
1987+1.36 ms+497.35 msJul 23 -0.06 msMar 1 +2.67 msDec 31
1986+1.24 ms+451.06 msAug 2 -0.04 msApr 23 +2.30 ms-
1985+1.45 ms+528.83 msJul 16 +0.11 msMar 9 +2.64 msJun 30
1984+1.51 ms+554.42 msJul 12 +0.16 msMar 18 +2.77 ms-
1983+2.28 ms+832.08 msJul 23 +1.01 msFeb 1 +3.57 msJun 30
1982+2.16 ms+789.64 msAug 2 +0.84 msApr 23 +3.14 msJun 30
1981+2.15 ms+786.03 msJul 16 +0.82 msMar 8 +3.42 msJun 30
1980+2.30 ms+842.04 msAug 8 +1.34 msOct 23 +3.24 ms-
1979+2.61 ms+953.02 msJul 23 +1.46 msMar 27 +3.65 msDec 31
1978+2.88 ms+1051.83 msJul 31 +1.49 msMar 9 +3.83 msDec 31
1977+2.77 ms+1012.60 msJul 14 +1.46 msApr 4 +3.72 msDec 31
1976+2.91 ms+1064.67 msJun 26 +1.87 msOct 21 +3.90 msDec 31
1975+2.69 ms+980.87 msJul 20 +1.54 msNov 1 +3.72 msDec 31
1974+2.72 ms+991.99 msJul 30 +1.57 msApr 5 +3.79 msDec 31
1973+3.04 ms+1106.21 msJan 2 +0.00 msApr 2 +4.03 msDec 31


I created a graph from the data to make the trend more apparent:

Earth's Rotation Speed.png
It really took a dip from 1995 to 2003 or so. And another dip from 2016 onwards.

Here is what the solar cycles look like for roughly the same period:

Solar Cycles.png

It's not perfectly correlated but there's definitely a general correlation. Maybe there's a lag - maybe the rotation speed changes and the sun takes a few decades to "catch up"? If so, we could hypothesize that the 1995-2003 dip in day length is correlated with solar cycle 24, the first one that was very weak. So roughly a 10-20 year lag. If so, then the dramatic dip that started in 2016 should reflect in the sun's behavior around 2026-2036. And that timeframe lines up with your link's prediction where the sun kinda bottoms out between 2028 and 2042.

Sal-1-crop.png

And for what it's worth, this also matches up roughly with Valentina Zharkova's prediction of 2020-2055 as well.

If accurate, it looks like we're in for a wild ride very soon!
 

Attachments

  • Sal-1-crop.webp
    80.2 KB · Views: 16
The article mentions that there's a correlation between earth's rotation speed and solar minimum and maximums.

So I took a look here and reproduced their table below. Look at the Total yearly difference:


YearAverage dayTotal yearly differenceShortest dayLongest dayLeap second added
2022-0.30 ms-111.08 msNov 29 -3.40 msNov 5 +0.71 ms-
2021-0.18 ms-65.15 msJul 9 -1.46 msApr 26 +1.00 ms-
2020-0.00 ms-1.30 msJul 19 -1.47 msApr 8 +1.62 ms-
2019+0.39 ms+141.25 msJul 16 -0.95 msMar 22 +1.68 ms-
2018+0.69 ms+252.47 msJun 30 -0.64 msFeb 4 +1.69 ms-
2017+1.03 ms+375.01 msAug 4 +0.06 msApr 25 +2.20 ms-
2016+1.34 ms+490.76 msJul 18 -0.03 msMar 10 +2.49 msDec 31
2015+1.25 ms+458.03 msJun 17 +0.19 msOct 26 +2.31 msJun 30
2014+0.99 ms+362.96 msJul 24 +0.02 msApr 26 +2.02 ms-
2013+1.02 ms+373.99 msJul 6 -0.35 msMar 28 +1.97 ms-
2012+0.83 ms+304.11 msJul 16 -0.35 msApr 5 +1.87 msJun 30
2011+0.76 ms+277.94 msJul 27 -0.34 msMay 14 +1.85 ms-
2010+0.70 ms+254.74 msJul 23 -0.76 msMar 1 +2.09 ms-
2009+0.80 ms+293.37 msJul 6 -0.43 msApr 22 +1.81 ms-
2008+0.87 ms+319.49 msJul 16 -0.41 msApr 5 +1.91 msDec 31
2007+0.85 ms+310.81 msJul 27 -0.63 msApr 16 +2.31 ms-
2006+0.82 ms+300.88 msJun 12 -0.40 msOct 7 +2.26 ms-
2005+0.43 ms+157.76 msJul 5 -1.05 msFeb 27 +1.73 msDec 31
2004+0.31 ms+114.01 msJul 15 -1.05 msApr 5 +1.56 ms-
2003+0.27 ms+100.16 msJul 13 -0.96 msMar 19 +1.55 ms-
2002+0.48 ms+173.79 msAug 6 -0.74 msMar 2 +1.66 ms-
2001+0.57 ms+208.94 msAug 2 -0.71 msMar 11 +1.64 ms-
2000+0.72 ms+262.42 msAug 11 -0.25 msOct 26 +1.58 ms-
1999+0.99 ms+361.19 msJun 30 -0.13 msApr 15 +1.93 ms-
1998+1.37 ms+501.72 msJul 9 +0.01 msMar 1 +2.66 msDec 31
1997+1.84 ms+671.08 msJul 4 +0.52 msApr 6 +2.98 msJun 30
1996+1.82 ms+666.37 msAug 10 +0.67 msMay 12 +2.68 ms-
1995+2.31 ms+843.66 msJul 25 +0.81 msMar 17 +3.29 msDec 31
1994+2.19 ms+800.86 msJul 6 +0.86 msFeb 27 +3.36 msJun 30
1993+2.36 ms+862.66 msJul 17 +1.25 msMay 2 +3.49 msJun 30
1992+2.22 ms+812.25 msJul 12 +0.84 msMar 18 +3.59 msJun 30
1991+2.04 ms+743.88 msJun 27 +0.79 msMar 1 +3.00 ms-
1990+1.95 ms+710.04 msJul 20 +0.63 msMar 26 +3.28 msDec 31
1989+1.52 ms+555.00 msJul 2 +0.25 msNov 10 +2.82 msDec 31
1988+1.31 ms+480.30 msJul 12 -0.09 msFeb 20 +2.76 ms-
1987+1.36 ms+497.35 msJul 23 -0.06 msMar 1 +2.67 msDec 31
1986+1.24 ms+451.06 msAug 2 -0.04 msApr 23 +2.30 ms-
1985+1.45 ms+528.83 msJul 16 +0.11 msMar 9 +2.64 msJun 30
1984+1.51 ms+554.42 msJul 12 +0.16 msMar 18 +2.77 ms-
1983+2.28 ms+832.08 msJul 23 +1.01 msFeb 1 +3.57 msJun 30
1982+2.16 ms+789.64 msAug 2 +0.84 msApr 23 +3.14 msJun 30
1981+2.15 ms+786.03 msJul 16 +0.82 msMar 8 +3.42 msJun 30
1980+2.30 ms+842.04 msAug 8 +1.34 msOct 23 +3.24 ms-
1979+2.61 ms+953.02 msJul 23 +1.46 msMar 27 +3.65 msDec 31
1978+2.88 ms+1051.83 msJul 31 +1.49 msMar 9 +3.83 msDec 31
1977+2.77 ms+1012.60 msJul 14 +1.46 msApr 4 +3.72 msDec 31
1976+2.91 ms+1064.67 msJun 26 +1.87 msOct 21 +3.90 msDec 31
1975+2.69 ms+980.87 msJul 20 +1.54 msNov 1 +3.72 msDec 31
1974+2.72 ms+991.99 msJul 30 +1.57 msApr 5 +3.79 msDec 31
1973+3.04 ms+1106.21 msJan 2 +0.00 msApr 2 +4.03 msDec 31


I created a graph from the data to make the trend more apparent:

View attachment 63399
It really took a dip from 1995 to 2003 or so. And another dip from 2016 onwards.

Here is what the solar cycles look like for roughly the same period:

View attachment 63400

It's not perfectly correlated but there's definitely a general correlation. Maybe there's a lag - maybe the rotation speed changes and the sun takes a few decades to "catch up"? If so, we could hypothesize that the 1995-2003 dip in day length is correlated with solar cycle 24, the first one that was very weak. So roughly a 10-20 year lag. If so, then the dramatic dip that started in 2016 should reflect in the sun's behavior around 2026-2036. And that timeframe lines up with your link's prediction where the sun kinda bottoms out between 2028 and 2042.

View attachment 63402

And for what it's worth, this also matches up roughly with Valentina Zharkova's prediction of 2020-2055 as well.

If accurate, it looks like we're in for a wild ride very soon!

Thank you very much SAO for the graphs and comparisons. When I started reading, even before I scrolled down and saw the graphs, I was thinking "I want a graph of that"!

It does look like we are in for a wild ride.
 
Thank you very much SAO for the graphs and comparisons. When I started reading, even before I scrolled down and saw the graphs, I was thinking "I want a graph of that"!

It does look like we are in for a wild ride.
No problem at all! Another thought I had after I posted is that the slowing down and speeding up of rotation seems to come in waves, and it would be interesting to try to find data before 1973 as well to see what it was up to. It’s possible that we are in for an extended acceleration leading into the ice age, but it’s also possible that it will continue to go up and down more and more dramatically, even if the general trend, at least since 1973, is down. It’s acting like a swing that is being pushed. Unfortunately they didn’t have the tech to measure it before 1950’s or so, but I believe I read that it can be inferred from observing the moon and the stars, which we have done for a long time, I just need to see if anyone did the math.

The C’s specifically mentioned slowing down of the rotation as causing all the “opening up” on the planet, so I’ll try to see if the rotation data correlates with earthquake spikes or other weirdness in any way as well.
 
Back
Top Bottom