You are using an out of date browser. It may not display this or other websites correctly.
You should upgrade or use an alternative browser.
You should upgrade or use an alternative browser.
The Ice Age Cometh! Forget Global Warming!
- Thread starter Gaby
- Start date
Interesting.
I presume the link you were referring to is: https://www.actuaries.asn.au/Library/Events/SUM/2013/Sum2013PaperBrentWalker.pdf
I presume the link you were referring to is: https://www.actuaries.asn.au/Library/Events/SUM/2013/Sum2013PaperBrentWalker.pdf
That was a very good paper. Probably one of many that have been rejected by the mainstream Climate Change narrative.
I took a few snippets from the paper, but the whole thing is worth reading.
=======================
...The last grand minimum – the Dalton Minimum – commenced in the late 18th Century so, logically if these are occurring roughly every 200 years, it would seem that the next grand minimum should have already commenced or will very soon.
International Panel on Climate Change View
According to models used by the International Panel on Climate Change, the second, most recent, period of higher sunspot activity was not the primary cause of an increase in temperature. On this latest occasion most of the increase in global temperatures was caused by mankind. More specifically it was mankind’s industrialisation and its concomitant requirement for energy that caused higher emissions of the greenhouse gas carbon dioxide. These higher levels of this atmospheric gas then caused the observed increase in global temperatures. More likely is that there were a number of factors that caused the 20th Century global warming. However more responsibility should be given to the sun.
Use of Predictive Models
The computer models that are currently being relied upon to forecast climate change have so far proved fairly unreliable. On the other hand the NASA ephemeris models, that are used by some solar and astrophysicists to predict changes in the sun due to gravitational forces of other bodies in the solar system, are extremely reliable in predicting exactly where all relatively large extra-terrestrial bodies in our solar system will be located at any point in time in the past, present and future. Without these models NASA and other space agencies would not have had the successes in interplanetary exploration and satellite positioning that they have had to date3.
There are many disparate forces that intertwine in ways to make each grand minimum different. Russian scientist Dr Habibullo Abdussamatov, of the St Petersburg Pulkovo Astronomical Observatory and head of the Russian/Ukrainian section of the International Space Station uses different models that predict that this new grand minimum will be as severe as the Maunder Minimum. But many astro-physicists and solar physicists who have used the NASA ephemeris model predict it will be more like the preceding Dalton Minimum. If the latter are correct, given that there has been some global warming for about 150 years, the climate changes that will occur will not be too extreme - unless there are some really large volcanic eruptions that drag global temperature down rapidly4.
3 The ephemeris is a computer system used in the exploration of the solar system and accurately plots the position of the sun, planets, their satellites and asteroids at any time past, present or future (within a few thousand year timeframe). It is freely available on the NASA website for anyone to use. There are also other versions of this system that have been developed in other countries.
But if Dr Abdussamatov is correct then this grand minimum will cause many economic and political changes and some may be very unpleasant.
...
Summary
The sun’s sunspot activity during a grand minimum, paradoxically, plays a significant role in producing extreme “ice-age” type cold weather events in the Northern Hemisphere while at the same time causing arctic regions to become warmer. This activity also can cause conditions that increase the short term risks of major, even great earthquakes and volcanic eruptions.
There will be increased risks for the insurance industry during the Eddy Minimum. These are:
1. The increased incidence of violent storms will lead to higher property claims and increased crop insurance claims.
2. The colder and sometimes very much colder Northern Hemisphere winters will lead to higher business costs from lost production.
3. Longer winters, increased droughts and stalled monsoons will cause significant crop losses.
4. The continuing high incidence of great earthquakes causing sometimes catastrophic property and business losses which will be increased, particularly if they are followed by large tsunamis.
5. Higher mortality rates result from extreme weather, droughts, failed monsoons and seismic events. (For example, it was estimated that there were 6000 excess deaths from the March 2013 cold weather in the UK.)
The secondary effects of these also have risk consequences. These result from political instability caused by:
1. High food inflation due to failed crops and reductions in grain stores.
2. High energy price inflation due to the lack of enough energy supplies in some locations during periods of excessively cold conditions.
3. Population concerns about the future leading to political unrest.
4. Major business disruptions due to extreme weather or major seismic events.
This paper identifies why the Actuarial Profession should be using space weather and other space age tools to identify changes in a number of short-term and long-term risks.
...
Chad
The Living Force
Interesting paper coming out of China published yesterday by news outlet SCMP. Chinese researchers are predicting an end to the global warming trend which they say began 4000 years ago, although the period also had it's ups and downs; human activity is evidently not responsible (at least not because of carbon emissions and the usual factors blamed); the drivers behind the shift are the Sun, our atmosphere, the oceans and the interaction between them. They note that they underestimated just how significant the impact of the Sun is on climate.
Global cooling to replace warming trend that started 4,000 years ago - Chinese scientists
Stephen Chen
South China Morning Post
Sun, 11 Aug 2019 06:30 UTC
© Xinhua
A team of Chinese researchers says a period of global cooling could be on the way, but the consequences will be serious.
A new study has found winters in northern China have been warming since 4,000BC - regardless of human activity - but the mainland scientists behind the research warn there is no room for complacency or inaction on climate change, with the prospect of a sudden global cooling also posing a danger.
The study found that winds from Arctic Siberia have been growing weaker, the conifer tree line has been retreating north, and there has been a steady rise in biodiversity in a general warming trend that continues today. It appears to have little to do with the increase in greenhouse gases which began with the industrial revolution, according to the researchers.
Lead scientist Dr Wu Jing, from the Key Laboratory of Cenozoic Geology and Environment at the Institute of Geology and Geophysics, part of the Chinese Academy of Sciences, said the study had found no evidence of human influence on northern China's warming winters.
"Driving forces include the sun, the atmosphere, and its interaction with the ocean," Wu said. "We have detected no evidence of human influence. But that doesn't mean we can just relax and do nothing."
© BaiduShare:
Moon Lake, a small volcanic lake hidden in the deep forest of China's Greater Khingan Mountain Range, where a team of scientists spent more than a decade studying the secrets hidden in its sediments.
Wu and her colleagues are concerned that, as societies grow more used to the concept of global warming, people will develop a misplaced confidence in our ability to control climate change. Nature, they warned, may trick us and might catch us totally unprepared - causing chaos, panic, famine and even wars as the global climate system is disrupted.
Comment: And this is exactly what is happening; good people are being brainwashed by the nefarious and misguided into thinking they can somehow control the global climate with drastic and deleterious changes in their lives: The Misanthropic Bankers Behind The Green New Deal
There are already alarming signs, according to their paper, which has been accepted for publication by the online Journal of Geophysical Research: Atmospheres.
Wu and her colleagues spent more than a dozen years studying sediments under Moon Lake, a small volcanic lake hidden in the deep forests of the Greater Khingan Mountain Range in China's Inner Mongolia autonomous region. They found that winter warming over the past 6,000 years had not been a smooth ride, with ups and downs occurring about every 500 years.
Their findings confirmed an earlier study by a separate team of Chinese scientists, published by online journal Scientific Reports in 2014, which first detected the 500-year cyclical pattern of China's summer monsoons and linked it to solar activity.
The 2014 research, which drew on 5,000 years' worth of data, suggested the current warm phase of the cycle could terminate over the next several decades, ushering in a 250-year cool phase, potentially leading to a partial slowdown in man-made global warming.
Wu said the latest study, with 10,000 years' worth of new data, not only helped to draw a more complete picture of the 500-year cycle, but also revealed a previously unknown mechanism behind the phenomenon, which suggested the impact of the sun on the Earth's climate may be greater than previously thought.
According to Wu, the variation in solar activity alone was usually not strong enough to induce the rapid changes in vegetation the research team recorded in the sediment cores of Moon Lake. Instead, the scientists found the warming impact was amplified by a massive, random interaction between surface seawater and the atmosphere in the Pacific Ocean known as the El Nino-Southern Oscillation.
As a result of the research findings, Wu said she was now more worried about cooling than warming.
"A sharp drop of temperature will benefit nobody. The biggest problem is, we know it will come, but we don't know exactly when."


M
MikaelYosef
Guest
This message is a harder one to respond to, as there's devil in the detail. If the information being shared is accurate, but comes from a person who is completely contradictory to everything you stand for, is the information still valid?
The man featured and sharing his views in this clip is someone who's considered highly divisive, creates controversy and is paid a lot of money to be that way. He appears in this clip on a right-wing, pay-TV station which is only available to a minority of people. It is very probable that an alternate agenda exists, and it's got nothing to do with climate change science or the debunking of it.
I only bring this up in reference to the C's.......if an alternate source came along which shared accurate information but was from the complete opposite of who the C's are, would it be accepted or would it be neglected?
WEll, if that was the only reason, then why did you bring it up in this thread? Opposite the C's would be STS and when would STS be sharing? Below is perhaps an example:I only bring this up in reference to the C's.......if an alternate source came along which shared accurate information but was from the complete opposite of who the C's are, would it be accepted or would it be neglected?

Session 18 March 2000
March 18, 2000 Laura, Ark, Frank Q: Hello. A: Hello. Q: And who do we have with us this evening? A: Ponollah. Q: And where do you transmit through? A: Cassiopaea. Q: (A) I have two questions. The first question is about a German fellow named Heim who wrote a couple of books...
 cassiopaea.org
For context there is more, since there was no question about who the sources might be, but it came later:Q: Well, what I am trying to get at is: should we start stockpiling firewood?
A: Maybe.
Q: So, it could be that fast?
A: Oh yes, and faster when in response to global"warming."
Q: When you put "warming" in quotes, you obviously mean warming in more than just an ordinary sense? Is that correct?
A: And/or not really "warm."
Q: Whitley Strieber and Art Bell have published a book about a "global superstorm." Is any of the information they have given in this book fairly accurate?
A: Derived from non-human sources known for stark accuracy, when convenient.
Q: What makes it convenient at the present time for them to be "starkly accurate?"
A: Fits into plans.
Q: Plans for what?
A: Do we not know already?
Q: In other words: world conquest and the takeover of humanity?
A: Not as simple.
Q: What would make my statement more accurate?
A: Call it amalgamation.
Session 1 January 1995
January 1, 1995 [Continuation of December 31, 1994 session after break for New Year celebration.] Q: (L) Who do we have with us tonight? A: Cassiopaea calling. Sorrona. Q: (L) And who are our guests? A: You must network tonight as there are those who are awaiting your message as...
cassiopaea.org
Q: (L) What is the energy fueling Whitley Strieber and his work?
A: Grays.
Q: (L) He is an agent of the Grays?
A: No. Instrument of the Grays.
Q: (T) So, all his writing is compromised by the Grays?
A: Influenced by them.
Q: (T) Well, he says that, too. (L) Well, he now thinks he has learned how to be a companion of God through these experiences.
A: Wolfen reflects Lizzie reality.
Q: (L) Who's read the book, what's it about? (T) I saw the movie but I never read the book. I can't stand his Gothic style of writing. (L) I can't stand to read his stuff either. (T) I only got half-way through Communion and gave it up. (L) Well, let me ask, while we are on the subject of writing, is Anne Rice channeling her concepts in her vampire books?
A: She also is influenced by the Grays.
Can information be accurate but not valid? In this case we are in the areas of atmospheric physics, meteorology, climatology, etc. that is natural science; I looked up the terms you used on Reliability, accuracy & validity: BEEP BioEthics Education ProjectThis message is a harder one to respond to, as there's devil in the detail. If the information being shared is accurate, but comes from a person who is completely contradictory to everything you stand for, is the information still valid?
Being Reliable, Accurate & Valid
As an example of some of these terms, this summer the thermometer that DMI had on station SUMMIT in Greenland showed the highest temperatures ever, a new record and the measurement was accurate, down to the last decimal. It was also reliable, the thermometer itself was not faulty and any other thermometer brought by anyone else put next to the other and under the same circumstances would have measured the same temperature. Unfortunately it was not valid, because the conditions around the thermometer had been messed up by - snow. Although the temperature was real and accurate, the record could not be accepted, because it was not according to the standard conditions. In this example we stayed within the same framework of science, this is not the case if one mentions scientific knowledge and then adds,Reliability
When a scientist repeats an experiment with a different group of people or a different batch of the same chemicals and gets very similar results then those results are said to be reliable. Reliability is measured by a percentage – if you get exactly the same results every time then they are 100% reliable.[...]
Validity
Validity describes whether the results of an experiment really do measure the concept being tested. Does seeing how far a ruler can drop through someone’s hand really measure reaction time? What other variables may be influencing the results? [...]
Accuracy
Accuracy describes how well a measuring instrument determines the variable it is measuring. It can be employed in two ways
In order to be accurate in their work scientists need to first select a measuring instrument that allows an appropriate measure of accuracy eg a micrometer for the diameter of a piece of wire and a ruler marked in mm for its length and then to calibrate it. Calibrating an instrument involves measuring already known quantities too assess how accurately it is working. [...]
- An accurate measuring instrument, say a thermometer, is one whose readings confirm a known result.
- The level of accuracy of a measuring instrument determines the detail to which it can measure. A micrometer measures length to a greater level of accuracy than a ruler which in turn measures length to a greater level of accuracy than a ‘clicker’ wheel.
then you step outside of the framework of natural science, and discuss whether you can accept what he says, because of what you think of him as a person.but comes from a person who is completely contradictory to everything you stand for,
That may be the case, (but again who says? who pays THOSE who say so? where? when? why??? ...) and btw we did not pay to see this clip, except that Google logged us as having watched it and will send us ads).The man featured and sharing his views in this clip is someone who's considered highly divisive, creates controversy and is paid a lot of money to be that way. He appears in this clip on a right-wing, pay-TV station which is only available to a minority of people. It is very probable that an alternate agenda exists, and it's got nothing to do with climate change science or the debunking of it.
The presenter in the clip is also the person who knows some people, interviews them and shares some research that others have made. Personally, I find the presenter irritating at times, which admittedly has little to do with any political stand, but even if that is the case, who has resources to make a distillation of all the data and the sources? You? And when is it ready? Okay, my solution was to watch some sections at normal speed. other sections at a faster speed, and skip parts I already knew the content of.
angelburst29
The Living Force
Protecting Singapore from rising sea levels could cost S$100 billion

FILE PHOTO: Passers-by hold their mobile phones as people take a selfie photo using a smartphone, with Singapore's central business district skyline, in Singapore, May 10, 2019. REUTERS/Kevin Lam/File Photo GLOBAL BUSINESS WEEK AHEAD
SINGAPORE August 18, 2019 - Protecting Singapore against rising sea levels could cost S$100 billion ($72 billion) or more over 100 years, its prime minister said on Sunday, as the low-lying island-state makes preparations to mitigate the impact of global warming.
“How much will it cost to protect ourselves against rising sea levels? My guess is probably S$100 billion over 100 years, quite possibly more,” Prime Minister Lee Hsien Loong said.
Lee said Singapore’s future options include building polders, areas of land reclaimed from a body of water, or reclaiming a series of islands offshore and connecting them with barrages.
Singapore’s has already taken some action, including introducing a carbon tax and requiring future critical infrastructure like its new airport terminal and port to be built on higher ground.
Earlier this year, the government said it would spend S$400 million over the next two years to upgrade and maintain the country’s drains and strengthen its flood resilience.
The prime minister made the comments in his annual National Day Rally speech, in which he laid out policies and priorities for the government.
In the speech, he also said Singapore would gradually raise its retirement age by three years to 65.
The retirement age will rise to 63 in 2022 from the current retirement age of 62 and to 65 by 2030, Lee said.
Singapore, which has the longest life expectancy at birth in the world, is growing more dependent on its older residents as birth rates fall and foreign labor is restricted.
“Most seniors in fact don’t want to stop working,” the prime minister said. “We are healthy for longer and living longer, but we don’t want to spend more years in retirement.”
“Also many of us want to build up a bigger nest egg for when we eventually retire.”
Singapore will also raise its so-called re-employment age from 67 to 70 by 2030. Under the re-employment law, companies in Singapore are required to offer eligible employees the option of continuing to work until they are 67.
Lee said the public service will raise its retirement and re-employment ages one year earlier in 2021.
Singapore is facing slowing growth prospects this year. It cut its full-year economic growth forecast last week amid fears of recession in the city-state that has been hit hard by the China-U.S. trade war.
Lee said should U.S.-China relations continue to deteriorate, it was bad news for Singapore. He said that while the current situation did not warrant immediate stimulus measures, the government would respond with appropriate interventions if the situation got much worse.
($1 = 1.3842 Singapore dollars)
A few weeks before the sea ice minimum of the year, I found data from polarportal.dk Havisens udbredelse: Polar Portal


From a Russian site Charts of ice conditions there is for the same date

Notice the difference above Siberia between the two island in the lower right corner on the Russian map, between 150 and 180 degrees East latitudes compared with the Danish/American map? I don't know if this is significant, except I would be concerned if I was a captain of a ship wishing to take the north passage. Is the difference between the maps, due to faulty Russian data, or faulty American, or an optical illusion caused by a different map projections of the globe. Perhaps, but which is more truthful? I am beginning to be concerned, I have been a frequent visitor of polar portal, but am I wasting my time?
From a Russian site Charts of ice conditions there is for the same date
Notice the difference above Siberia between the two island in the lower right corner on the Russian map, between 150 and 180 degrees East latitudes compared with the Danish/American map? I don't know if this is significant, except I would be concerned if I was a captain of a ship wishing to take the north passage. Is the difference between the maps, due to faulty Russian data, or faulty American, or an optical illusion caused by a different map projections of the globe. Perhaps, but which is more truthful? I am beginning to be concerned, I have been a frequent visitor of polar portal, but am I wasting my time?
Perhaps I was a little quick in my previous post, or at least on polarporal.dk I found two maps that do not show the same area. This time I will take the English versions of the pages and then after that there will be sea ice maps from Norway, Canada, the US, and more details from the seas above Russia. Along the way I will comment on the differences:
First there is Sea Ice Extent: Polar Portal map I posted previously, and pay special attention to the area from the North pole along 160 degrees east, remember the ice cover and compare with map nr two:

The new map I found on Sea Ice Thickness and Volume: Polar Portal Notice the extend of the ice is greater than on the previous map, especially along the 160 degree mark between the two Russian Islands

Apparently the first map from Polar Portal made by OSI-SAF showing sea ice extend neglects ice covers in the low end, say 10-20 %, but then again this is not ice free conditions. Moreover it seems more inaccurate when it comes to the seas north of Russia, where even spots of dense ice cover are neglected. OSI SAF has a website OSI SAF | Observing oceans from space from where Polar Portal gets their maps. About the accuracy they say on Global Sea Ice Concentration (AMSR-2) | OSI SAF
10-20% accuracy would of course count for a lot and it seems they prefer to err on the side of reporting too little ice.
And again the Russian map from Charts of ice conditions which is responsible for the northern sea route navigation. Green is 1/10-6/10 red is 7/10-10/10 coverage:

In an attempt to solve the doubts about the quality of the data on the above maps, I found the page of the Norwegian Ice Service on Ice Information Portal It is surprisingly detailed.

Compared with the Russian map they are close, but perhaps the Russian map is slightly more conservative, I have gone back and forth many times comparing the perspective, but this seems to be the case. I assume any ship moving in this area would use the Norwegian maps.
The Canadian ice service also offers maps at Canadian sea ice concentration map - Canada.ca Comparing with the Russian map it appears similar, the coding is slightly different, but it does not change much. Both the Norwegian and the Canadian maps are very limited in the area they cover.

Then I visited the U.S. National Ice Center, Naval Ice Center at U.S. NIC Products and then went to their library of maps: U.S. NIC where todays maps of the Arctic Ice shows a picture where the projection appears to be pretty close to having the North Pole in the center although the perspective is different from the Russian map.

When I compare this last American map with the first sea ice extend map from OSI-SAF it almost appears as if they have removed the yellow areas on the US map and with a broad brush smoothed out the edges around the red areas and called that the extent of Arctic ice cover. Now they have their own satellites, but this is the impression. When I compare the US map with the sea ice thickness map on Polar Portal there is more correspondence.
If we go back to the the Russian page, they have four areas for which they offer more detailed maps if ice is present:
Kara Sea
Laptev Sea
East-Siberian Sea
Chukchi Sea is ice free
For the Kara Sea there is this map:

And to the east of the above map there is the Laptev sea:

The above two maps clearly indicate that one has to sail close the shore and watch out for the ice bergs that still appears to be floating around.
For the East-Siberian Sea there is this map, which gives details that the big maps can only cover with approximation:

The above area looks safe at the present if one sails close to the shore. At the end of the day, it appears that if there is a choice between relying on data only based on satellite images like the OSI DAF and Polar Portal estimates of sea ice thickness and then those made by people responsible for sea navigation, I would rather rely on the latter, as they, besides satellite data, are likely to take the conditions observed in the areas where ice is present into greater consideration, and probably receive surface feedback all the time, but since some areas are not accessible, one has to study both kinds of information.
I almost can't believe this small excercise got this complicated, but doubts have been put to rest, and if anyone dares to pull out the OSI-SAF maps posted on Polar Portal to prove there is hardly any ice left in the Arctic, then there is some good data available from many sources to show those maps are a bit misleading.
First there is Sea Ice Extent: Polar Portal map I posted previously, and pay special attention to the area from the North pole along 160 degrees east, remember the ice cover and compare with map nr two:
The new map I found on Sea Ice Thickness and Volume: Polar Portal Notice the extend of the ice is greater than on the previous map, especially along the 160 degree mark between the two Russian Islands
Apparently the first map from Polar Portal made by OSI-SAF showing sea ice extend neglects ice covers in the low end, say 10-20 %, but then again this is not ice free conditions. Moreover it seems more inaccurate when it comes to the seas north of Russia, where even spots of dense ice cover are neglected. OSI SAF has a website OSI SAF | Observing oceans from space from where Polar Portal gets their maps. About the accuracy they say on Global Sea Ice Concentration (AMSR-2) | OSI SAF
| Thresold accuracy | 20 % |
|---|---|
| Target accuracy | 10 % for NH-product. 15 % for SH-product |
| Optimal accuracy | 10 % |
| Verification/validation method | Comparison with high resolution manual ice charts |
And again the Russian map from Charts of ice conditions which is responsible for the northern sea route navigation. Green is 1/10-6/10 red is 7/10-10/10 coverage:
In an attempt to solve the doubts about the quality of the data on the above maps, I found the page of the Norwegian Ice Service on Ice Information Portal It is surprisingly detailed.
Compared with the Russian map they are close, but perhaps the Russian map is slightly more conservative, I have gone back and forth many times comparing the perspective, but this seems to be the case. I assume any ship moving in this area would use the Norwegian maps.
The Canadian ice service also offers maps at Canadian sea ice concentration map - Canada.ca Comparing with the Russian map it appears similar, the coding is slightly different, but it does not change much. Both the Norwegian and the Canadian maps are very limited in the area they cover.
Then I visited the U.S. National Ice Center, Naval Ice Center at U.S. NIC Products and then went to their library of maps: U.S. NIC where todays maps of the Arctic Ice shows a picture where the projection appears to be pretty close to having the North Pole in the center although the perspective is different from the Russian map.
When I compare this last American map with the first sea ice extend map from OSI-SAF it almost appears as if they have removed the yellow areas on the US map and with a broad brush smoothed out the edges around the red areas and called that the extent of Arctic ice cover. Now they have their own satellites, but this is the impression. When I compare the US map with the sea ice thickness map on Polar Portal there is more correspondence.
If we go back to the the Russian page, they have four areas for which they offer more detailed maps if ice is present:
Kara Sea
Laptev Sea
East-Siberian Sea
Chukchi Sea is ice free
For the Kara Sea there is this map:
And to the east of the above map there is the Laptev sea:
The above two maps clearly indicate that one has to sail close the shore and watch out for the ice bergs that still appears to be floating around.
For the East-Siberian Sea there is this map, which gives details that the big maps can only cover with approximation:
The above area looks safe at the present if one sails close to the shore. At the end of the day, it appears that if there is a choice between relying on data only based on satellite images like the OSI DAF and Polar Portal estimates of sea ice thickness and then those made by people responsible for sea navigation, I would rather rely on the latter, as they, besides satellite data, are likely to take the conditions observed in the areas where ice is present into greater consideration, and probably receive surface feedback all the time, but since some areas are not accessible, one has to study both kinds of information.
I almost can't believe this small excercise got this complicated, but doubts have been put to rest, and if anyone dares to pull out the OSI-SAF maps posted on Polar Portal to prove there is hardly any ice left in the Arctic, then there is some good data available from many sources to show those maps are a bit misleading.
Potatoes and Tomatoes
Jedi Master
I was so pleased to read this on SOTT today...the backlash against the 'settled science' seems to be gathering pace. I doubt it will be given too much MSM coverage, but posting on social media seems to garner some raised eyebrows and a little panic in some cases!
 principia-scientific.org
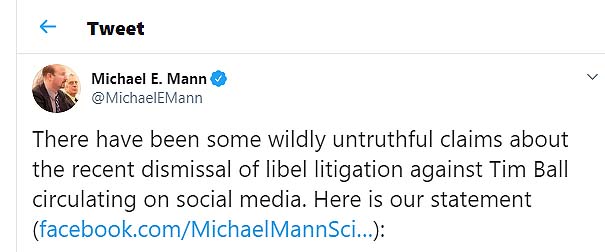
Breaking News: Dr Tim Ball Defeats Michael Mann’s Climate Lawsuit!
Supreme Court of British Columbia dismisses Dr Michael Mann’s defamation lawsuit versus Canadian skeptic climatologist, Dr Tim Ball. Full legal costs are awarded to Dr Ball, the defendant in the ca…
principia-scientific.org
It is to be seen if anything will come out of the fallout:I was so pleased to read this on SOTT today...the backlash against the 'settled science' seems to be gathering pace. I doubt it will be given too much MSM coverage, but posting on social media seems to garner some raised eyebrows and a little panic in some cases!
Breaking News: Dr Tim Ball Defeats Michael Mann’s Climate Lawsuit!
Supreme Court of British Columbia dismisses Dr Michael Mann’s defamation lawsuit versus Canadian skeptic climatologist, Dr Tim Ball. Full legal costs are awarded to Dr Ball, the defendant in the ca…

RICO Racketeering Probe Beckons after Michael Mann’s Court Defeat | Principia Scientific Intl.
Michael Mann’s defeat in the Supreme Court of British Columbia in the ‘science trial of the century’ may be about to have criminal repercussions south of the border in the United States.
principia-scientific.org
The gift the arrogant Michael Mann gave skeptics was his arrogance and naivety in legal matters. His filing of that absurd libel suit against Dr Ball for comically stating that Mann belonged in “the state penn, not Penn State” was priceless.
Those words will go down in the annals of history as they will be seen as the key that unlocked the door into the sordid conspiracy of the trillion dollar climate change Ponzi scheme.
The plaintiff lost the Mann-v-Ball case because, as we expected, he refused to show his secret science in court.
Anyone familiar with the legal system will know there are strict rules about the discovery of evidence and the penalties for hiding/destroying evidence.
Hiding or destroying key evidence is a desperate villain’s tactic addressed every day by judges, lawyers and juries in our courts.
angelburst29
The Living Force
Northern Fleet’s hydrographers confirm five new islands in the Arctic

© Nikolai Malyshev/TASS
MURMANSK, August 27, 2019 - The Northern Fleet's hydro-graphers confirmed five new islands in the course of an expedition to the Franz Josef Land Archipelago, the fleet’s press service said on Tuesday.
"The islands are between 900 and 54,500 square meters," the press service said.
The Northern Fleet’s specialists have been using the Earth’s remote sensing data. Between 2015 and 2018, the experts confirmed more than 30 new islands, capes and bays. The information obtained through topographic surveying is double-checked and then is added to maps and navigation materials and instructions.
The fleet’s specialists made topographic pictures and descriptions of the new islands.
Arctic expedition
The Northern Fleet’s expedition, organized in association with the Russian Geographical Society’s Center on Northern Fleet, its scientists and the media, began on August 15 onboard the Altai rescue tug. Participants in the unique project follow the routes of Julius von Payer’s expedition of 1874, Frederick Jackson’s expedition of 1897, the expeditions by Evelyn Baldwin and Georgy Brusilov, and others. They have been conducting scientific and environmental studies and exploring Soviet military infrastructure and traces of past centuries’ expeditions.
The crew have sailed about 2,000 miles across the Barents and Kara Seas, carrying out research on the Pakhtusov Island, Vise and Blagopoluchiye Bays. They examined the remains of the weather station, which was destroyed in 1943 by Germany’s U-711 submarine.
The expedition has explored the Hooker Island’s southern coastline and made a few glacier observations. The Altai tug followed the route of the Sedov icebreaking steamer, which brought a Soviet expedition to Franz Josef Land in 1929.
Trending content
-

-
Thread 'Coronavirus Pandemic: Apocalypse Now! Or exaggerated scare story?'
- wanderingthomas
Replies: 30K -

-