The Ice Age Cometh! Forget Global Warming!

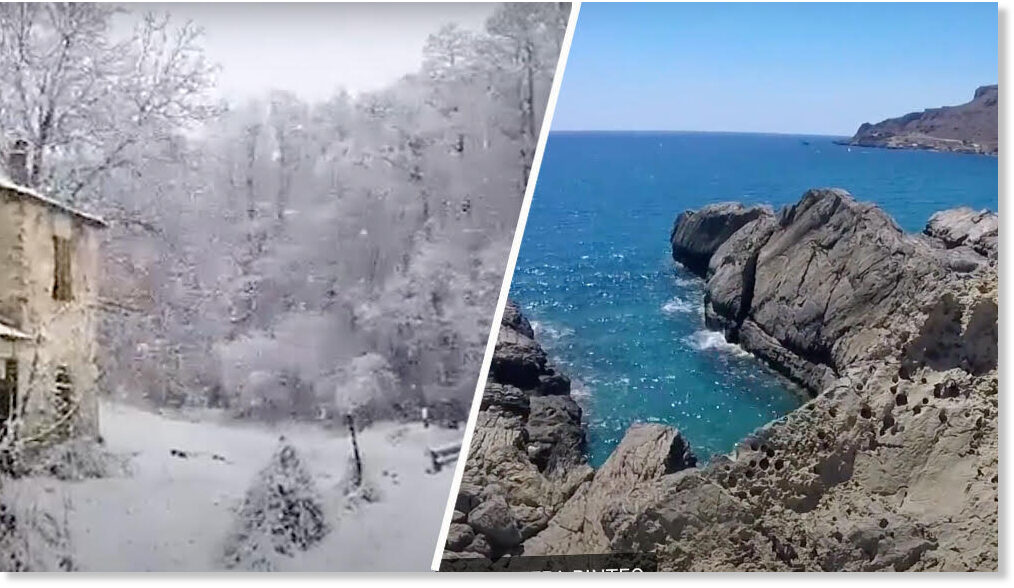
A recent publication, including two photos of (1) current frost weathering in the USA and (2) an estimate of permafrost extent during the Last Glacial Maximum (LGM). Of particular note is the LGM permafrost boundary. There's no timescale, or indication of phases or progression of glaciation, but as a snapshot it is worth looking at.

Study: Effects of Past Ice Ages More Widespread Than Previously Thought

"Cold temperatures, prevalent during glacial periods, had a significant impact on past and modern unglaciated landscapes across much of North America, according to a recent study by University of Arkansas geologist Jill A. Marshall. "​


The findings help shape understanding of the earth’s “Critical Zone,” the relatively thin layer of the planet that extends from where vegetation meets the atmosphere to the lowermost extent of weathered bedrock. “Climate and ecosystems determine how quickly bedrock weathers, how soil is produced, how sediment moves on land and in rivers and other factors that shape the landscape,” the authors wrote.

In cold lands, such as Alaska today, frost can crack or weather rock that is at or near the surface of the earth – making it more porous and turning solid rock into sediment. By applying a frost-weathering model to North America paleoclimate simulations tracking temperatures during the Last Glacial Maximum approximately 21,000 years ago, Marshall and her team determined that a large swath of North America, from Oregon to Georgia and as far south as Texas and Arkansas, were likely affected by such periglacial processes.

While permafrost landscapes like the modern Arctic experience frozen ground for two years or more, periglacial landscapes, though not permanently frozen, experience below-freezing temperature for much of the year. Though the evidence of past periglacial processes is easily hidden by vegetation and/or erased by subsequent geological processes, the teams’ results suggest that frost weathering (and by extent other periglacial processes) covered an area about 3.5 times larger than the mapped extent of permafrost during the Last Glacial Maximum. This predicted influence of past cold climates on below ground weathering may significantly influence modern landscape attributes that we depend on such as soil thickness and water storage.

“Based on the widespread occurrence of glacial-period frost weathering over meter-scale depths, we suggest that past cold climates have had a significant impact on modern landscapes, both through lingering impact on subsurface pathways for water and thus chemical weathering, and the rock damage that contributes to the rate at which rock disaggregates into sediment and potential instability due to non-steady rates of hillslope and river processes,” the paper states.


1614184402945.png
 
The Jet stream is doing some nice displays. After reading the following on the Wiki:
The strongest jet streams are the polar jets, at 9–12 km (30,000–39,000 ft) above sea level, and the higher altitude and somewhat weaker subtropical jets at 10–16 km (33,000–52,000 ft). The Northern Hemisphere and the Southern Hemisphere each have a polar jet and a subtropical jet. The northern hemisphere polar jet flows over the middle to northern latitudes of North America, Europe, and Asia and their intervening oceans, while the southern hemisphere polar jet mostly circles Antarctica all year round. [...].[2]
I continued to Ventusky.com to look at the wind speed at an altitude of 300 hPa (9000 m):
1614190549216.png
Today we there were having up to 13 degrees in Southern Scandinavia, while the temperatures in large parts of Russia are blisteringly cold.

1614190921101.png
One difference between North America and Asia is that North America is generally closer to warm seas. I begin to understand the possibility that an ice age would come from Asia.
 
Germany recorded the largest temperature drop in history

Climatologists from the German Meteorological Service on Tuesday, February 23, said that the country had never experienced temperature fluctuations like those recorded by the station in Göttingen.

During the week, the temperature changed by 41.9 degrees.


On February 14, the minimum was -23.8, and seven days later, on the 21st, the maximum value was +18.1.

Nature set the previous record in this area in the spring of 1880, at the very beginning of the history of meteorological accounting. According to the representative of the meteorological service, then the temperature rose by 41 degrees in a week.

On 22 February, two local heat records were also set in northern Germany. In Quickbourne, the temperature maximum reached +18.9 degrees Celsius, breaking the previous 17.8-degree record recorded in 2019. In the Hamburg area at the Neuviedenthal meteorological station on the same day, the equipment registered +21.1. In 2020 at this time, the record was +18.1.

Thus, for the first time in the history of meteorological observations in Germany, the temperature in Hamburg in the winter period exceeded +20 degrees Celsius.

 
I just got my latest Ben Davidson book in the mail
''THE NEXT END OF THE WORLD ''
The Rebirth of Catastrophism

he has some interesting bits I was not aware before

page 69
the symbolism of the Apollo mission is another matter . Why name the lunar mission ''Apollo''?
Apollo had nothing to do with the moon , as he was a solar deity.
The overall mission logo appears to show the four horsemen of the Apocalypse, with one being the sun itself,more or less in their appropriate colors.
image of logo
1614173298820.png
1 white,wearing a crown
2 red, stealing the civility of the people
3 black, holding the scales of justice
4 pale, and hell follows him
the changing magnetic field of earth is going to change how we see light from space; light is an electromagnetic wave. The filtering of various color spectra is diminished under the ongoing weakening of earth's field, such that the yellow sun now appears so brightly white at the top of the sky that it has brilliant rays radially shooting out-like its wearing a crown.
If the solar output slows down or accumulation builds in the sun's atmosphere, it will turn red, and through fear and panic , the people will lose much of their humanity.
When accumulation overcomes the sun and ''blocks the pressure vent'', it will look black ,and its equatorial electric field will glow visibly around its equator, appearing like a tipping scale used in antiquity .
When the internal solar pressure builds and finally blasts off the accumulated outer shell in the micro nova , we will peer through the dust and gas and plasma and once-again see that familiar pale yellow hue, but hell follows with it.......

Ben also looks into the flash frozen mammoth issue and if the crust will shift as well as the magnetic field
 
Interesting article about the Beaufort Gyre and the fresh water transport it causes when it releases. Could be the final blow for the already weak gulf stream system

The Beaufort Gyre is a clockwise wind pattern in the western Arctic Ocean that causes freshwater to accumulate at the ocean’s surface. When those winds relax, the freshwater drains not through Fram Strait, but through the narrow channels of the Canadian Archipelago to reach the Labrador Sea, off the coast of Canada’s Newfoundland and Labrador
The Beaufort Sea, which is the largest Arctic Ocean freshwater reservoir, has increased its freshwater content by 40% over the past two decades”

The volume of freshwater now in the Beaufort Sea is about twice the size of the case studied, at more than 23,300 cubic kilometers, or more than 5,500 cubic miles.

Record-high Arctic freshwater will flow through Canadian waters, affecting marine environment and Atlantic ocean currents​

Hannah Hickey
UW News
Colored map of the North Atlantic and Arctic

A simulated red dye tracer released from the Beaufort Gyre in the Artic Ocean (center top) shows freshwater transport through the Canadian Arctic Archipelago, along Baffin Island to the western Labrador Sea, off the coast of Newfoundland and Labrador, where it reduces surface salinity. At the lower left is Newfoundland (triangular land mass) surrounded by orange for fresher water, with Canada’s Gulf of St. Lawrence above colored yellow.Francesca Samsel and Greg Abram
Freshwater is accumulating in the Arctic Ocean. The Beaufort Sea, which is the largest Arctic Ocean freshwater reservoir, has increased its freshwater content by 40% over the past two decades. How and where this water will flow into the Atlantic Ocean is important for local and global ocean conditions.

A study from the University of Washington, Los Alamos National Laboratory and the National Oceanic and Atmospheric Administration shows that this freshwater travels through the Canadian Archipelago to reach the Labrador Sea, rather than through the wider marine passageways that connect to seas in Northern Europe. The open-access study was published Feb. 23 in Nature Communications.

“The Canadian Archipelago is a major conduit between the Arctic and the North Atlantic,” said lead author Jiaxu Zhang, a UW postdoctoral researcher at the Cooperative Institute for Climate, Ocean and Ecosystem Studies. “In the future, if the winds get weaker and the freshwater gets released, there is a potential for this high amount of water to have a big influence in the Labrador Sea region.”

The finding has implications for the Labrador Sea marine environment, since Arctic water tends to be fresher but also rich in nutrients. This pathway also affects larger oceanic currents, namely a conveyor-belt circulation in the Atlantic Ocean in which colder, heavier water sinks in the North Atlantic and comes back along the surface as the Gulf Stream. Fresher, lighter water entering the Labrador Sea could slow that overturning circulation.

“We know that the Arctic Ocean has one of the biggest climate change signals,” said co-author Wei Cheng at the UW-based Cooperative Institute for Climate, Ocean and Atmosphere Studies. “Right now this freshwater is still trapped in the Arctic. But once it gets out, it can have a very large impact.”

map showing relevant sites

The Beaufort Gyre is a clockwise wind pattern in the western Arctic Ocean that causes freshwater to accumulate at the ocean’s surface. When those winds relax, the freshwater drains not through Fram Strait, but through the narrow channels of the Canadian Archipelago to reach the Labrador Sea, off the coast of Canada’s Newfoundland and Labrador.
Fresher water reaches the Arctic Ocean through rain, snow, rivers, inflows from the relatively fresher Pacific Ocean, as well as the recent melting of Arctic Ocean sea ice. Fresher, lighter water floats at the top, and clockwise winds in the Beaufort Sea push that lighter water together to create a dome.

When those winds relax, the dome will flatten and the freshwater gets released into the North Atlantic.

“People have already spent a lot of time studying why the Beaufort Sea freshwater has gotten so high in the past few decades,” said Zhang, who began the work at Los Alamos National Laboratory. “But they rarely care where the freshwater goes, and we think that’s a much more important problem.”

Using a technique Zhang developed to track ocean salinity, the researchers simulated the ocean circulation and followed the Beaufort Sea freshwater’s spread in a past event that occurred from 1983 to 1995.

colored map showing salinity

This map shows the study region of the Beaufort Gyre and nearby waters, with colors showing the average surface salinity for 1983-2008. Labels show the Labrador Sea’s exit region, Nares Strait, Lancaster Sound, Davis Strait and Fram Strait.Zhang et al./Nature Communications
Their experiment showed that most of the freshwater reached the Labrador Sea through the Canadian Archipelago, a complex set of narrow passages between Canada and Greenland. This region is poorly studied and was thought to be less important for freshwater flow than the much wider Fram Strait, which connects to the Northern European seas.

In the model, the 1983-1995 freshwater release traveled mostly along the North American route and significantly reduced the salinities in the Labrador Sea — a freshening of 0.2 parts per thousand on its shallower western edge, off the coast of Newfoundland and Labrador, and of 0.4 parts per thousand inside the Labrador Current.

The volume of freshwater now in the Beaufort Sea is about twice the size of the case studied, at more than 23,300 cubic kilometers, or more than 5,500 cubic miles. This volume of freshwater released into the North Atlantic could have significant effects. The exact impact is unknown. The study focused on past events, and current research is looking at where today’s freshwater buildup might end up and what changes it could trigger.

“A freshwater release of this size into the subpolar North Atlantic could impact a critical circulation pattern, called the Atlantic Meridional Overturning Circulation, which has a significant influence on Northern Hemisphere climate,” said co-author Wilbert Weijer at Los Alamos National Lab.

This research was funded by the Department of Energy, the National Science Foundation, Los Alamos National Laboratory, and NOAA. Other authors are Mike Steele at the UW Applied Physics Laboratory and Tarun Verma and Milena Veneziani at Los Alamos National Lab

Warming The below article has a bias towards the whole global warming scam

Gulf Stream System at its weakest in over a millennium​


Gulf Stream System at its weakest in over a millennium​


02/25/2021 - Never before in over 1000 years the Atlantic Meridional Overturning Circulation (AMOC), also known as Gulf Stream System, has been as weak as in the last decades. This is the result of a new study by scientists from Ireland, Britain and Germany. The researchers compiled so-called proxy data – taken mainly from natural archives like ocean sediments or ice cores – reaching back many hundreds of years to reconstruct the flow history of the AMOC. They found consistent evidence that its slowdown in the 20th century is unprecedented in the past millennium – it is likely linked to human-caused climate change. The giant ocean circulation is relevant for weather patterns in Europe and regional sea-levels in the US; its slowdown is also associated with an observed ‘cold blob’ in the northern Atlantic.
Gulf Stream System at its weakest in over a millennium
Graphik: Levke Caesar.
“The Gulf Stream System works like a giant conveyor belt, carrying warm surface water from the equator up north, and sending cold, low-salinity deep water back down south. It moves nearly 20 million cubic meters of water per second, almost a hundred times the Amazon flow,” explains Stefan Rahmstorf from the Potsdam Institute for Climate Impact Research PIK, initiator of the study published in Nature Geoscience. Previous studies by Rahmstorf and colleagues showed a slowdown of the ocean current of about 15 percent since the mid-20th century, linking this to human-caused global warming, but a robust picture about its long-term development has up to now been missing: This is what the researchers provide with their review of results of proxy data studies.
“For the first time, we have combined a range of previous studies and found they provide a consistent picture of the AMOC evolution over the past 1600 years,” says Rahmstorf. “The study results suggest that it has been relatively stable until the late 19th century. With the end of the little ice age in about 1850, the ocean currents began to decline, with a second, more drastic decline following since the mid-20th century.” Already the 2019 special report on the oceans of the Intergovernmental Panel on Climate Change (IPCC) concluded with medium confidence ‘that the Atlantic Meridional Overturning Circulation (AMOC) has weakened relative to 1850–1900.’ “The new study provides further independent evidence for this conclusion and puts it into a longer-term paleoclimatic context,” Rahmstorf adds.
From temperature to flow speed changes: the art of reconstructing past climate changes
Because ongoing direct AMOC measurements only started in 2004, the researchers applied an indirect approach, using so-called proxy data, to find out more about the long-term perspective of its decline. Proxy data, as witnesses of the past, consist of information gathered from natural environmental archives such as tree rings, ice cores, ocean sediments, and corals, as well as from historical data, for instance from ship logs.
“We used a combination of three different types of data to obtain information about the ocean currents: temperature patterns in the Atlantic Ocean, subsurface water mass properties and deep-sea sediment grain sizes, dating back from 100 to ca. 1600 years. While the individual proxy data is imperfect in representing the AMOC evolution, the combination of them revealed a robust picture of the overturning circulation,” explains Levke Caesar, part of the Irish Climate Analysis and Research Unit at Maynooth University and guest scientist at PIK.
As proxy records in general are subject to uncertainties, statistician Niamh Cahill from Maynooth University in Ireland tested the robustness of the results in consideration of these. She found that in 9 of the 11 data sets considered, the modern AMOC weakness is statistically significant. “Assuming that the processes measured in proxy records reflect changes in AMOC, they provide a consistent picture, despite the different locations and time scales represented in the data. The AMOC has weakened unprecedentedly in over 1000 years” she says.
Why is the AMOC slowing down?
An AMOC slowdown has long been predicted by climate models as a response to global warming caused by greenhouse gases – according to a number of studies, this is likely the reason for the observed weakening. The Atlantic overturning is driven by what the scientists call deep convection, triggered by the differences in the density of the ocean water: Warm and salty water moves from the south to the north where it cools down and thus gets denser. When it is heavy enough the water sinks to deeper ocean layers and flows back to the south. Global warming disturbs this mechanism: Increased rainfall and enhanced melting of the Greenland Ice Sheet add fresh water to the surface ocean. This reduces the salinity and thus the density of the water, inhibiting the sinking and thus weakening the flow of the AMOC.
Its weakening has also been linked to a unique substantial cooling of the northern Atlantic over the past hundred years. This so-called ‘cold blob’ was predicted by climate models as a result of a weakening AMOC, which transports less heat into this region.
The consequences of the AMOC slowdown could be manifold for people living on both sides of the Atlantic as Levke Caesar explains: “The northward surface flow of the AMOC leads to a deflection of water masses to the right, away from the US east coast. This is due to Earth’s rotation that diverts moving objects such as currents to the right in the northern hemisphere and to the left in the southern hemisphere. As the current slows down, this effect weakens and more water can pile up at the US east coast, leading to an enhanced sea level rise.” In Europe, a further slowdown of the AMOC could imply more extreme weather events like a change of the winter storm track coming off the Atlantic, possibly intensifying them. Other studies found possible consequences being extreme heat waves or a decrease in summer rainfall. Exactly what the further consequences are is the subject of current research; scientists also aim to resolve which components and pathways of the AMOC have changed how and for what reasons.
“If we continue to drive global warming, the Gulf Stream System will weaken further – by 34 to 45 percent by 2100 according to the latest generation of climate models,“ concludes Rahmstorf. “This could bring us dangerously close to the tipping point at which the flow becomes unstable.”
 
Very beautiful video. What might be the mechanisms for such a thing to break off? The cracks are huge and 9/10 are not even seen. It goes down really deep.

SOTT covered the story here and the editors comment:

Comment: As noted in the following article, calving, whereby an ice berg splits off from a glacier, is caused by glacial expansion, and thus a process associated with cooling, not warming: Iceberg the size of London calves off Antarctica - Caused by a glacier EXPANDING, not melting

I had missed the article on SOTT and it was shared on social media today.
 
Continued from above post.

Turkey:


Bulgaria:


Thank heavens for social media.

Also in south east Europe -


Last edited:
Here are two titles with abstracts, along with one book, that demonstrate our weather and climate fluctuate more easily than we traditionally have been told by the media and in our schools even over short periods of time.
Article about the reception of a putative volcanic dust veil across Europe in September 1465 and the hypothesis it might be the infamous Kuwae eruption, long time dated to 1452, now recently to 1458. The contribution aims to reconstruct the possible impact of the eruption in the second half of the 1460s, but makes also clear that it might be wrong to assume all volcanic mega eruptions behaved like Tambora 1815. Finally the article puts forward the assumption (and gives examples) that volcanic events of the kind might be a good starting point for a medieval environmental history with global aspects. Bauch, Martin, The Day the Sun Turned Blue. A Volcanic Eruption in the Early 1460s and its Possible Climatic Impact – a Natural Disaster Perceived Globally in the Late Middle Ages?, in: Schenk, Gerrit J. (Hg.), Historical Disaster Experiences. A Comparative and Transcultural Survey between Asia and Europe, Heidelberg 2017, S. 107-138. See full volume here: Historical Disaster Experiences - Towards a Comparative and Transcultural History of Disasters Across Asia and Europe | Gerrit Jasper Schenk | Springer
One comment one could ask is that while volcanic eruptions leading to cooling so far happen rarely, there is still, even at the present frequency rates, a chance that two blow at about the same time, thus compounding the effect on the climate.

The link to the book, following the last bolded title, leads to a summary:
Historical disaster research is still a young field. This book discusses the experiences of natural disasters in different cultures, from Europe across the Near East to Asia. It focuses on the pre-industrial era and on the question of similarities, differences and transcultural dynamics in the cultural handling of natural disasters. Which long-lasting cultural patterns of perception, interpretation and handling of disasters can be determined? Have specific types of disasters changed the affected societies? What have people learned from disasters and what not? What adaptation and coping strategies existed? Which natural, societal and economic parameters play a part? The book not only reveals the historical depth of present practices, but also reveals possible comparisons that show globalization processes, entanglements and exchanges of ideas and practices in pre-modern times.
If anyone is interested in particular chapters of this book, I imagine one could try to find them on one of the research communities under the name of the authors.

The next article was what led me to collect and post the abstract of these papers.
Changes in climate affected human societies throughout the last millennium. While European cold periods in the 17th and 18th century have been assessed in detail, earlier cold periods received much less attention due to sparse information available. New evidence from proxy archives, historical documentary sources and climate model simulations permit us to provide an interdisciplinary, systematic assessment of an exceptionally cold period in the 15th century. Our assessment includes the role of internal, unforced climate variability and external forcing in shaping extreme climatic conditions and the impacts on and responses of the medieval society in northwestern and central Europe. Climate reconstructions from a multitude of natural and anthropogenic archives indicate that the 1430s were the coldest decade in northwestern and central Europe in the 15th century. This decade is characterised by cold winters and average to warm summers resulting in a strong seasonal cycle in temperature. Results from comprehensive climate models indicate consistently that these conditions occurred by chance due to the partly chaotic internal variability within the climate system. External forcing like volcanic eruptions tends to reduce simulated temperature seasonality and cannot explain the reconstructions. The strong seasonal cycle in temperature reduced food production and led to increasing food prices, a subsistence crisis and a famine in parts of Europe. Societies were not prepared to cope with failing markets and interrupted trade routes. In response to the crisis, authorities implemented numerous measures of supply policy and adaptation such as the installation of grain storage capacities to be prepared for future food production shortfalls.
The above paper should mean that the yearly average could be "normal", but within this normal, there can be devastating fluctuations.

The impression I have from the above papers as a whole is that serious weather-induced upsets of the social and economic systems are inevitable from time to time and occur more frequently than people in government plan for. There is an increasing amount of research from different fields, that confirm our already existing concerns, and while society is being geared to green and greener, the obvious is being ignored.

I don't know, if we need a new thread for this kind of papers, or if we should just enjoy and post them here with comments, as they surface from time to time?
 
It is rather worrying that preparations for possible/probable ice age conditions are not being made. I predict that things are going to get very serious and very chaotic rather quickly. But then, about anybody with two firing neurons can see that, so no cigar!
 
It is rather worrying that preparations for possible/probable ice age conditions are not being made. I predict that things are going to get very serious and very chaotic rather quickly. But then, about anybody with two firing neurons can see that, so no cigar!

And Bill Gates is going to make it happen! :-O

 
It is rather worrying that preparations for possible/probable ice age conditions are not being made. I predict that things are going to get very serious and very chaotic rather quickly. But then, about anybody with two firing neurons can see that, so no cigar!
I recall one session where the Cs said something like (and I am paraphrasing) "Ice ages come on much much much faster than scientists think". The current "scientific consensus" is that the transition into an ice age takes "thousands of years". I always interpreted the use of the word "much" by the Cs to mean a factor of 10. So "much much much" is 1,000 times faster... This means that the transition into an ice age takes "years" and not "thousands of years".
 
Back
Top Bottom