Earth Changes and the Human-Cosmic Connection

Hey guys. Since the book is currently being translated into german, I thought it might be a good idea to create a fast accessible and changeable data base while going trough it, for the important data in the book, so that we can publish the book with the most up to date data/graphs.

I'll share it here, since it is also translated into other languages right now and they could use it as well. Of course if you bring the important data in the book up to the current date, you need to change the text in those passages accordingly as well. It is not that much work, even though it sounds like it.

I just think it would be nice that german readers will get the newest and cutting edge data when the the book gets published. I also decided to add a bit of data here and there, while translating, because since the book was written more has been discovered, I hope that this is alright for you Pierre? If not, I can also leave it as it is... I just think it would be good that we have the data and the text in the book as much up to date as possible when it gets published.

So with this data sheet, you can quickly bring the important data from the book up to date, plus you can quickly create the appropriate graphs for the book:
https://docs.google.com/spreadsheets/d/1VbfoSiEr2Ou8dKl_OoPI5fPvV_upcwIbtJlpUuVYDXk/edit?usp=sharing

Notice that in some tables I already included a rough graph. I'm not an expert in creating graphs, so maybe somebody else can create them there correctly?

Also in regards to the NASA Budget, I couldn't really find coherent data from 2007 until 2015 yet. The thing is, that NASA has those numbers in three different status: (Request/Actual/Enacted) and I can't find reliably all the data for one of those status sections. I guess if we could find all the "enacted" data from 2007 until 2015, that would be nice... The problem is that NASA did not put out the Data coherently from 2007 until 2015, so in one year you can find only one status section and in the other year the other one. Maybe somebody can help out with that?

When the new data is found, the table has just to be updated...

If somebody wants to have direct access to the data above, for creating up to date data for the book, and/or for helping out to create the graphs, just send me a PM and I'll enable you to access it and work on it....
 
Pashalis said:
Hey guys. Since the book is currently being translated into german, I thought it might be a good idea to create a fast accessible and changeable data base while going trough it, for the important data in the book, so that we can publish the book with the most up to date data/graphs.

I'll share it here, since it is also translated into other languages right now and they could use it as well. Of course if you bring the important data in the book up to the current date, you need to change the text in those passages accordingly as well. It is not that much work, even though it sounds like it.

I just think it would be nice that german readers will get the newest and cutting edge data when the the book gets published. I also decided to add a bit of data here and there, while translating, because since the book was written more has been discovered, I hope that this is alright for you Pierre? If not, I can also leave it as it is... I just think it would be good that we have the data and the text in the book as much up to date as possible when it gets published.

So with this data sheet, you can quickly bring the important data from the book up to date, plus you can quickly create the appropriate graphs for the book:
https://docs.google.com/spreadsheets/d/1VbfoSiEr2Ou8dKl_OoPI5fPvV_upcwIbtJlpUuVYDXk/edit?usp=sharing

Notice that in some tables I already included a rough graph. I'm not an expert in creating graphs, so maybe somebody else can create them there correctly?

Also in regards to the NASA Budget, I couldn't really find coherent data from 2007 until 2015 yet. The thing is, that NASA has those numbers in three different status: (Request/Actual/Enacted) and I can't find reliably all the data for one of those status sections. I guess if we could find all the "enacted" data from 2007 until 2015, that would be nice... The problem is that NASA did not put out the Data coherently from 2007 until 2015, so in one year you can find only one status section and in the other year the other one. Maybe somebody can help out with that?

When the new data is found, the table has just to be updated...

If somebody wants to have direct access to the data above, for creating up to date data for the book, and/or for helping out to create the graphs, just send me a PM and I'll enable you to access it and work on it....

That's a good idea. The only caveat is that the comments relating to graphs may have to be updated too in order to 1/ integrate new data 2/ explain possible trend changes.
 
Pierre said:
Pashalis said:
Hey guys. Since the book is currently being translated into german, I thought it might be a good idea to create a fast accessible and changeable data base while going trough it, for the important data in the book, so that we can publish the book with the most up to date data/graphs.

I'll share it here, since it is also translated into other languages right now and they could use it as well. Of course if you bring the important data in the book up to the current date, you need to change the text in those passages accordingly as well. It is not that much work, even though it sounds like it.

I just think it would be nice that german readers will get the newest and cutting edge data when the the book gets published. I also decided to add a bit of data here and there, while translating, because since the book was written more has been discovered, I hope that this is alright for you Pierre? If not, I can also leave it as it is... I just think it would be good that we have the data and the text in the book as much up to date as possible when it gets published.

So with this data sheet, you can quickly bring the important data from the book up to date, plus you can quickly create the appropriate graphs for the book:
https://docs.google.com/spreadsheets/d/1VbfoSiEr2Ou8dKl_OoPI5fPvV_upcwIbtJlpUuVYDXk/edit?usp=sharing

Notice that in some tables I already included a rough graph. I'm not an expert in creating graphs, so maybe somebody else can create them there correctly?

Also in regards to the NASA Budget, I couldn't really find coherent data from 2007 until 2015 yet. The thing is, that NASA has those numbers in three different status: (Request/Actual/Enacted) and I can't find reliably all the data for one of those status sections. I guess if we could find all the "enacted" data from 2007 until 2015, that would be nice... The problem is that NASA did not put out the Data coherently from 2007 until 2015, so in one year you can find only one status section and in the other year the other one. Maybe somebody can help out with that?

When the new data is found, the table has just to be updated...

If somebody wants to have direct access to the data above, for creating up to date data for the book, and/or for helping out to create the graphs, just send me a PM and I'll enable you to access it and work on it....
That's a good idea. The only caveat is that the comments relating to graphs may have to be updated too in order to 1/ integrate new data 2/ explain possible trend changes.

Thanks!

Shouldn't be to much of a problem as of yet because currently those updated data don't require very much changes to the actual text, since overall all trends you described there seem to continue in that way (as of chapter 21, where I'm at right now). But yes those who want to update that stuff for the book, have to make sure to carefully update and change the text accordingly in those paragraphs.
 
Pierre said:
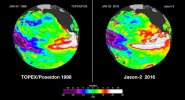
That's indeed an important point. El Nino is currently stronger than it's ever been over the past 70 years and it's still growing.

It seems to be the spike mentioned in a 1998 transcript.

Some additional figures have been recently released concerning the ongoing El Nino spike. The Oceanic Nino Index (ONI) broke the all time record in December 2015, coming in at 2.38°C above average, surpassing December 1997’s 2.24°C.

The Nov-Dec-Jan average also establishes the current El Niño as the strongest on record. Nov-Dec-Jan ONI = +2.31, eclipsing the previous record: +2.26 in OND 1997.

Also, the current El Nino covers way more surface and extends further West compared to the 97/98 El Nino (see picture below)
 

Attachments

  • el nino.jpg
    el nino.jpg
    40.2 KB · Views: 231
I read an article about the decrease of the earth magnetic field who says this :

The question of the diminution of the Ground magnetic field is bound(connected) thus confidentially to the respective position of the whirlwind and the anomaly in the South Atlantic. The simulations predict that these will remain bound(connected) one to another in the century to come.
Under the influence of the strong side drift which the whirlwind creates in the equatorial regions of the Atlantic Ocean, the anomaly and the whirlwind itself would also be pushed about 3000 kilometers westward (on the surface of the Earth) in the next 100 years.

_http://www.notre-planete.info/actualites/4422-champ-magnetique-inversion-Terre

It just makes me think about the anomaly almost in the same place about 'the cosmic rays thing' that you mentionned in a previous session.
 
Odyssey said:
More on the El Nino destruction on the Pacific Coast with cliff erosion so bad in Pacifica CA that apartment buildings are in danger of falling into the ocean.
El Nino wreaking havoc on Pacific Coast from Chile to California

And regarding ocean depths (or heights in this case): NASA just launched the Jason-3 satellite to measure ocean heights.
Meet Jason-3, NASA's newest ocean monitoring satellite

The joint US-European oceanographic satellite is tasked with measuring ocean topography, monitor hurricanes, and supplement data for forecasting. That sounds a bit funny because isn't sea level, well, level?

But the ocean isn't flat. Wind and waves create tiny frantic ripples up through graceful undulations, while the moon pulls up enormous tidal bulges. Water contracts and expands with temperature, and gets piled up by impatient currents. It all adds up to sea surfaces that can vary by as much as 6.5 feet (2 meters). (And that's before dealing with the relative rise and fall of coastlines themselves making "sea level" an almost laughably inconsistent standard.

But why bother measuring how sea surface heights change?

Hello Odyssey, sea surface heights are very important to shipping inasfar as the navigators need to keep their ships off any reefs or shallow bits, witness the hullabaloo over that Italian ship that ran aground and capsized.
I took part in surveying the waters around the port of Dampier in Australia, and also the northern and eastern coasts of Papua New Guinea. So you can develop tidal charts and use them with confidence.
 
Pierre said:
interestingly, the 1998 transcript mentioned the El Nino spike in relation to an hypothetic 10.4 quake in the north East pacific:

session 4/7/1998 said:
A: In Florida now, where to next? How about a shattering subduction quake in Pacific Northwest of U.S.? We estimate 10.4 on the Richter scale. We have warned of Rainier. Imagine a 150 meter high tsunami in Puget Sound...
Q: (L) Does this subduction quake have anything to do with that UFO that buried itself in the Pacific?
A: All are interconnected.
Q: (L) The information I got on that was that it was about 600 mile north and east of Hawaii. A couple of submersibles were sent down and disappeared or were destroyed or didn't come back... it is
supposedly giving off a lot of energy. Any comment?
A: No.
Q: (L) Should I follow that direction?
A: All directions lead to lessons.
Q: (L) Now, you have mentioned this earthquake. I know that you don't usually give predictions, why have you done so now?
A: We do not give time tables.
Q: (L) Anything else other than a tsunami in Puget Sound and a big subduction quake... 10.4 on the Richter scale is almost inconceivable.
A: Rainier... caldera.
Q: (L) What about the caldera?
A: Expect one.

Q: (L) Other than floods, anything else for Florida upcoming?
A: All areas experience accelerating "freak weather patterns."
Q: (L) Okay, all of these freaky weather patterns and bizarre things going on the planet, how does it relate to the comet cluster and the brown star? Is it related?
A: Human experiential cycle intersects.
Q: (L) Any specific physical manifestation of either this brown star or this comet cluster or this realm border, that is related to these events on the planet?
A: Approach of wave stimulates precursor activity which in turn causes effects which in turn stimulates further "heating up" of activity...
Q: (L) I thought it was curious that you used the term 'birth of the spike.' Is there something or someone that was born at that particular time?
A: No. Spike is as on a graph...
Q: (L) Okay, is there anyway we could graph this ourselves, and if so, what types of events would we include to create the background data?
A: "El Nino, La Nina," etc...

No Caldera yet at Mount Rainier but a series of small tremors were recorded on 12/2/16.
 
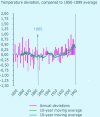
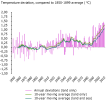
There is another error in the book. The legend of the image 123 is not complete. Check the images attached. We'll fix it.

Source of the original image: _http://www.eea.europa.eu/data-and-maps/figures/european-annual-average-temperature-deviations-1850-2008-relative-to-the-1850-1899-average-in-oc-the-lines-refer-to-10-year-moving-average-the-bars-to-the-annual-land-only-european-average-1/image_xlarge
 

Attachments

  • bookimage.jpg
    bookimage.jpg
    62.6 KB · Views: 182
  • originalimage.png
    originalimage.png
    181.7 KB · Views: 182
Here is another possible error in chapter 30.

However, for mainstream science, Earth’s obliquity (i.e. its axial tilt angle) has always been there
and is gently oscillating between 22°1 and 24°2 every 40,000 years, on average.

The "22°1 and 24°2" are not correct. I guess it should be "22.1° and 24.5°".

See here: _http://earthobservatory.nasa.gov/Features/Milankovitch/milankovitch_2.php
 
Altair said:
Here is another possible error in chapter 30.

However, for mainstream science, Earth’s obliquity (i.e. its axial tilt angle) has always been there
and is gently oscillating between 22°1 and 24°2 every 40,000 years, on average.

The "22°1 and 24°2" are not correct. I guess it should be "22.1° and 24.5°".

See here: _http://earthobservatory.nasa.gov/Features/Milankovitch/milankovitch_2.php

Yes you're right. Good find!
 
Altair said:
There is another error in the book. The legend of the image 123 is not complete. Check the images attached. We'll fix it.

Source of the original image: _http://www.eea.europa.eu/data-and-maps/figures/european-annual-average-temperature-deviations-1850-2008-relative-to-the-1850-1899-average-in-oc-the-lines-refer-to-10-year-moving-average-the-bars-to-the-annual-land-only-european-average-1/image_xlarge

Indeed one curve is land+ ocean temperature while the other one is land temperature.
 
Pashalis said:
Pierre said:
Pashalis said:
Hey guys. Since the book is currently being translated into german, I thought it might be a good idea to create a fast accessible and changeable data base while going trough it, for the important data in the book, so that we can publish the book with the most up to date data/graphs.

I'll share it here, since it is also translated into other languages right now and they could use it as well. Of course if you bring the important data in the book up to the current date, you need to change the text in those passages accordingly as well. It is not that much work, even though it sounds like it.

I just think it would be nice that german readers will get the newest and cutting edge data when the the book gets published. I also decided to add a bit of data here and there, while translating, because since the book was written more has been discovered, I hope that this is alright for you Pierre? If not, I can also leave it as it is... I just think it would be good that we have the data and the text in the book as much up to date as possible when it gets published.

So with this data sheet, you can quickly bring the important data from the book up to date, plus you can quickly create the appropriate graphs for the book:
https://docs.google.com/spreadsheets/d/1VbfoSiEr2Ou8dKl_OoPI5fPvV_upcwIbtJlpUuVYDXk/edit?usp=sharing

Notice that in some tables I already included a rough graph. I'm not an expert in creating graphs, so maybe somebody else can create them there correctly?

Also in regards to the NASA Budget, I couldn't really find coherent data from 2007 until 2015 yet. The thing is, that NASA has those numbers in three different status: (Request/Actual/Enacted) and I can't find reliably all the data for one of those status sections. I guess if we could find all the "enacted" data from 2007 until 2015, that would be nice... The problem is that NASA did not put out the Data coherently from 2007 until 2015, so in one year you can find only one status section and in the other year the other one. Maybe somebody can help out with that?

When the new data is found, the table has just to be updated...

If somebody wants to have direct access to the data above, for creating up to date data for the book, and/or for helping out to create the graphs, just send me a PM and I'll enable you to access it and work on it....
That's a good idea. The only caveat is that the comments relating to graphs may have to be updated too in order to 1/ integrate new data 2/ explain possible trend changes.

Thanks!

Shouldn't be to much of a problem as of yet because currently those updated data don't require very much changes to the actual text, since overall all trends you described there seem to continue in that way (as of chapter 21, where I'm at right now). But yes those who want to update that stuff for the book, have to make sure to carefully update and change the text accordingly in those paragraphs.

Pierre, could you provide us these text adjusments? Should we do it on our own in German and Russian versions or just leave it at that?

Thank you
 
Altair said:
Pashalis said:
Pierre said:
Pashalis said:
Hey guys. Since the book is currently being translated into german, I thought it might be a good idea to create a fast accessible and changeable data base while going trough it, for the important data in the book, so that we can publish the book with the most up to date data/graphs.

I'll share it here, since it is also translated into other languages right now and they could use it as well. Of course if you bring the important data in the book up to the current date, you need to change the text in those passages accordingly as well. It is not that much work, even though it sounds like it.

I just think it would be nice that german readers will get the newest and cutting edge data when the the book gets published. I also decided to add a bit of data here and there, while translating, because since the book was written more has been discovered, I hope that this is alright for you Pierre? If not, I can also leave it as it is... I just think it would be good that we have the data and the text in the book as much up to date as possible when it gets published.

So with this data sheet, you can quickly bring the important data from the book up to date, plus you can quickly create the appropriate graphs for the book:
https://docs.google.com/spreadsheets/d/1VbfoSiEr2Ou8dKl_OoPI5fPvV_upcwIbtJlpUuVYDXk/edit?usp=sharing

Notice that in some tables I already included a rough graph. I'm not an expert in creating graphs, so maybe somebody else can create them there correctly?

Also in regards to the NASA Budget, I couldn't really find coherent data from 2007 until 2015 yet. The thing is, that NASA has those numbers in three different status: (Request/Actual/Enacted) and I can't find reliably all the data for one of those status sections. I guess if we could find all the "enacted" data from 2007 until 2015, that would be nice... The problem is that NASA did not put out the Data coherently from 2007 until 2015, so in one year you can find only one status section and in the other year the other one. Maybe somebody can help out with that?

When the new data is found, the table has just to be updated...

If somebody wants to have direct access to the data above, for creating up to date data for the book, and/or for helping out to create the graphs, just send me a PM and I'll enable you to access it and work on it....

That's a good idea. The only caveat is that the comments relating to graphs may have to be updated too in order to 1/ integrate new data 2/ explain possible trend changes.

Thanks!

Shouldn't be to much of a problem as of yet because currently those updated data don't require very much changes to the actual text, since overall all trends you described there seem to continue in that way (as of chapter 21, where I'm at right now). But yes those who want to update that stuff for the book, have to make sure to carefully update and change the text accordingly in those paragraphs.

Pierre, could you provide us these text adjusments? Should we do it on our own in German and Russian versions or just leave it at that?

Thank you

If you want to do that, you just have to use the new data provided above and change the graphs as described above, according to that data. Then you need to read those two chapters carefully again and adjust the new numbers/data into those text passages. It sounds much, but it isn't, if you carefully go through those two chapters again including the source data...

By the way Pierre: http://sonotaco.jp/doc/SNM/index.html just published their data for 2015 as well. The problem now is, if we update that data until 2015 as well, that te premise that there is a increase in that time frame is probably not there anymore, as originally stated in the book back then for that data. That would then also apply to the footnote to that graph. So what should we do there?

I'm still not sure if the Sonota Data is as objective as the AMS data, because of they way they gather their data compared to the Sonota data...

All other data in those two chapters still fits with your analysis of back then (that there is an overall increase)...
 
Pashalis said:
If you want to do that, you just have to use the new data provided above and change the graphs as described above, according to that data. Then you need to read those two chapters carefully again and adjust the new numbers/data into those text passages. It sounds much, but it isn't, if you carefully go through those two chapters again including the source data...

Exactly

Pashalis said:
By the way Pierre: http://sonotaco.jp/doc/SNM/index.html just published their data for 2015 as well. The problem now is, if we update that data until 2015 as well, that te premise that there is a increase in that time frame is probably not there anymore, as originally stated in the book back then for that data. That would then also apply to the footnote to that graph. So what should we do there?

I'm still not sure if the Sonota Data is as objective as the AMS data, because of they way they gather their data compared to the Sonota data...

All other data in those two chapters still fits with your analysis of back then (that there is an overall increase)...

Indeed we still can mention an overall increase. Actually, I would not be surprised if we crossed a first cluster ( roughly 2010-2013) then experienced a temporary slowdown before entering a second cluster. Meteor density is not homogeneous. Maybe that could be added in a footnote.
 
Pierre said:
Indeed we still can mention an overall increase. Actually, I would not be surprised if we crossed a first cluster ( roughly 2011-2014) then experienced a temporary slowdown before entering a second cluster. Meteor density is not homogeneous. Maybe that could be added in a footnote.

Thank you for that precision Pierre. I was wondering lately on where our planet would be in relation to those clusters. And I agree with your asessment above. The next cluster will be a harbringer I feel?! Or in a way maybe I hope? Whichever way the cluster arrives, it will be a suprise suprise suprise moment after the current lull, even tough there is the uptick, it is still not so present in our minds or being mentionned anywhere as such!

Thank you all for this great thread!
 
Back
Top Bottom