Cosmic Rays Continue to Intensify
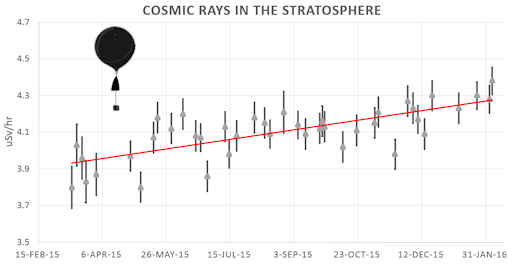
Last month, we reported that cosmic rays are intensifying. Measurements so far in February indicate that the trend is continuing. In fact, the latest balloon flight over California on Feb. 5th detected the highest value yet:
The data show that cosmic rays in the mid-latitude stratosphere
now are approximately 10% stronger than they were one year ago. All of these measurements were collected by Spaceweather.com and the students of Earth to Sky Calculus.
Cosmic rays, which are accelerated toward Earth by distant supernova explosions and other violent events, are an important form of space weather. They can seed clouds, trigger lightning, and penetrate commercial airplanes. Indeed, our measurements show that someone flying back and forth across the continental USA, just once, can absorb as much ionizing cosmic radiation as 2 to 5 dental X-rays. Likewise, cosmic rays can affect mountain climbers, high-altitude drones, and astronauts onboard the International Space Station.
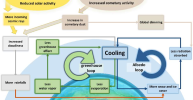
This type of radiation is modulated by solar activity. Solar storms and CMEs tend to sweep aside cosmic rays, making it more difficult for cosmic rays to reach Earth. On the other hand,
low solar activity allows an extra dose of cosmic rays to reach our planet. Indeed, the ongoing increase in cosmic ray intensity is probably due to a decline in the solar cycle. Solar Maximum has passed and we are heading toward a new Solar Minimum. Forecasters expect solar activity to drop sharply in the years ahead, and cosmic rays are poised to increase accordingly. Stay tuned for more radiation.