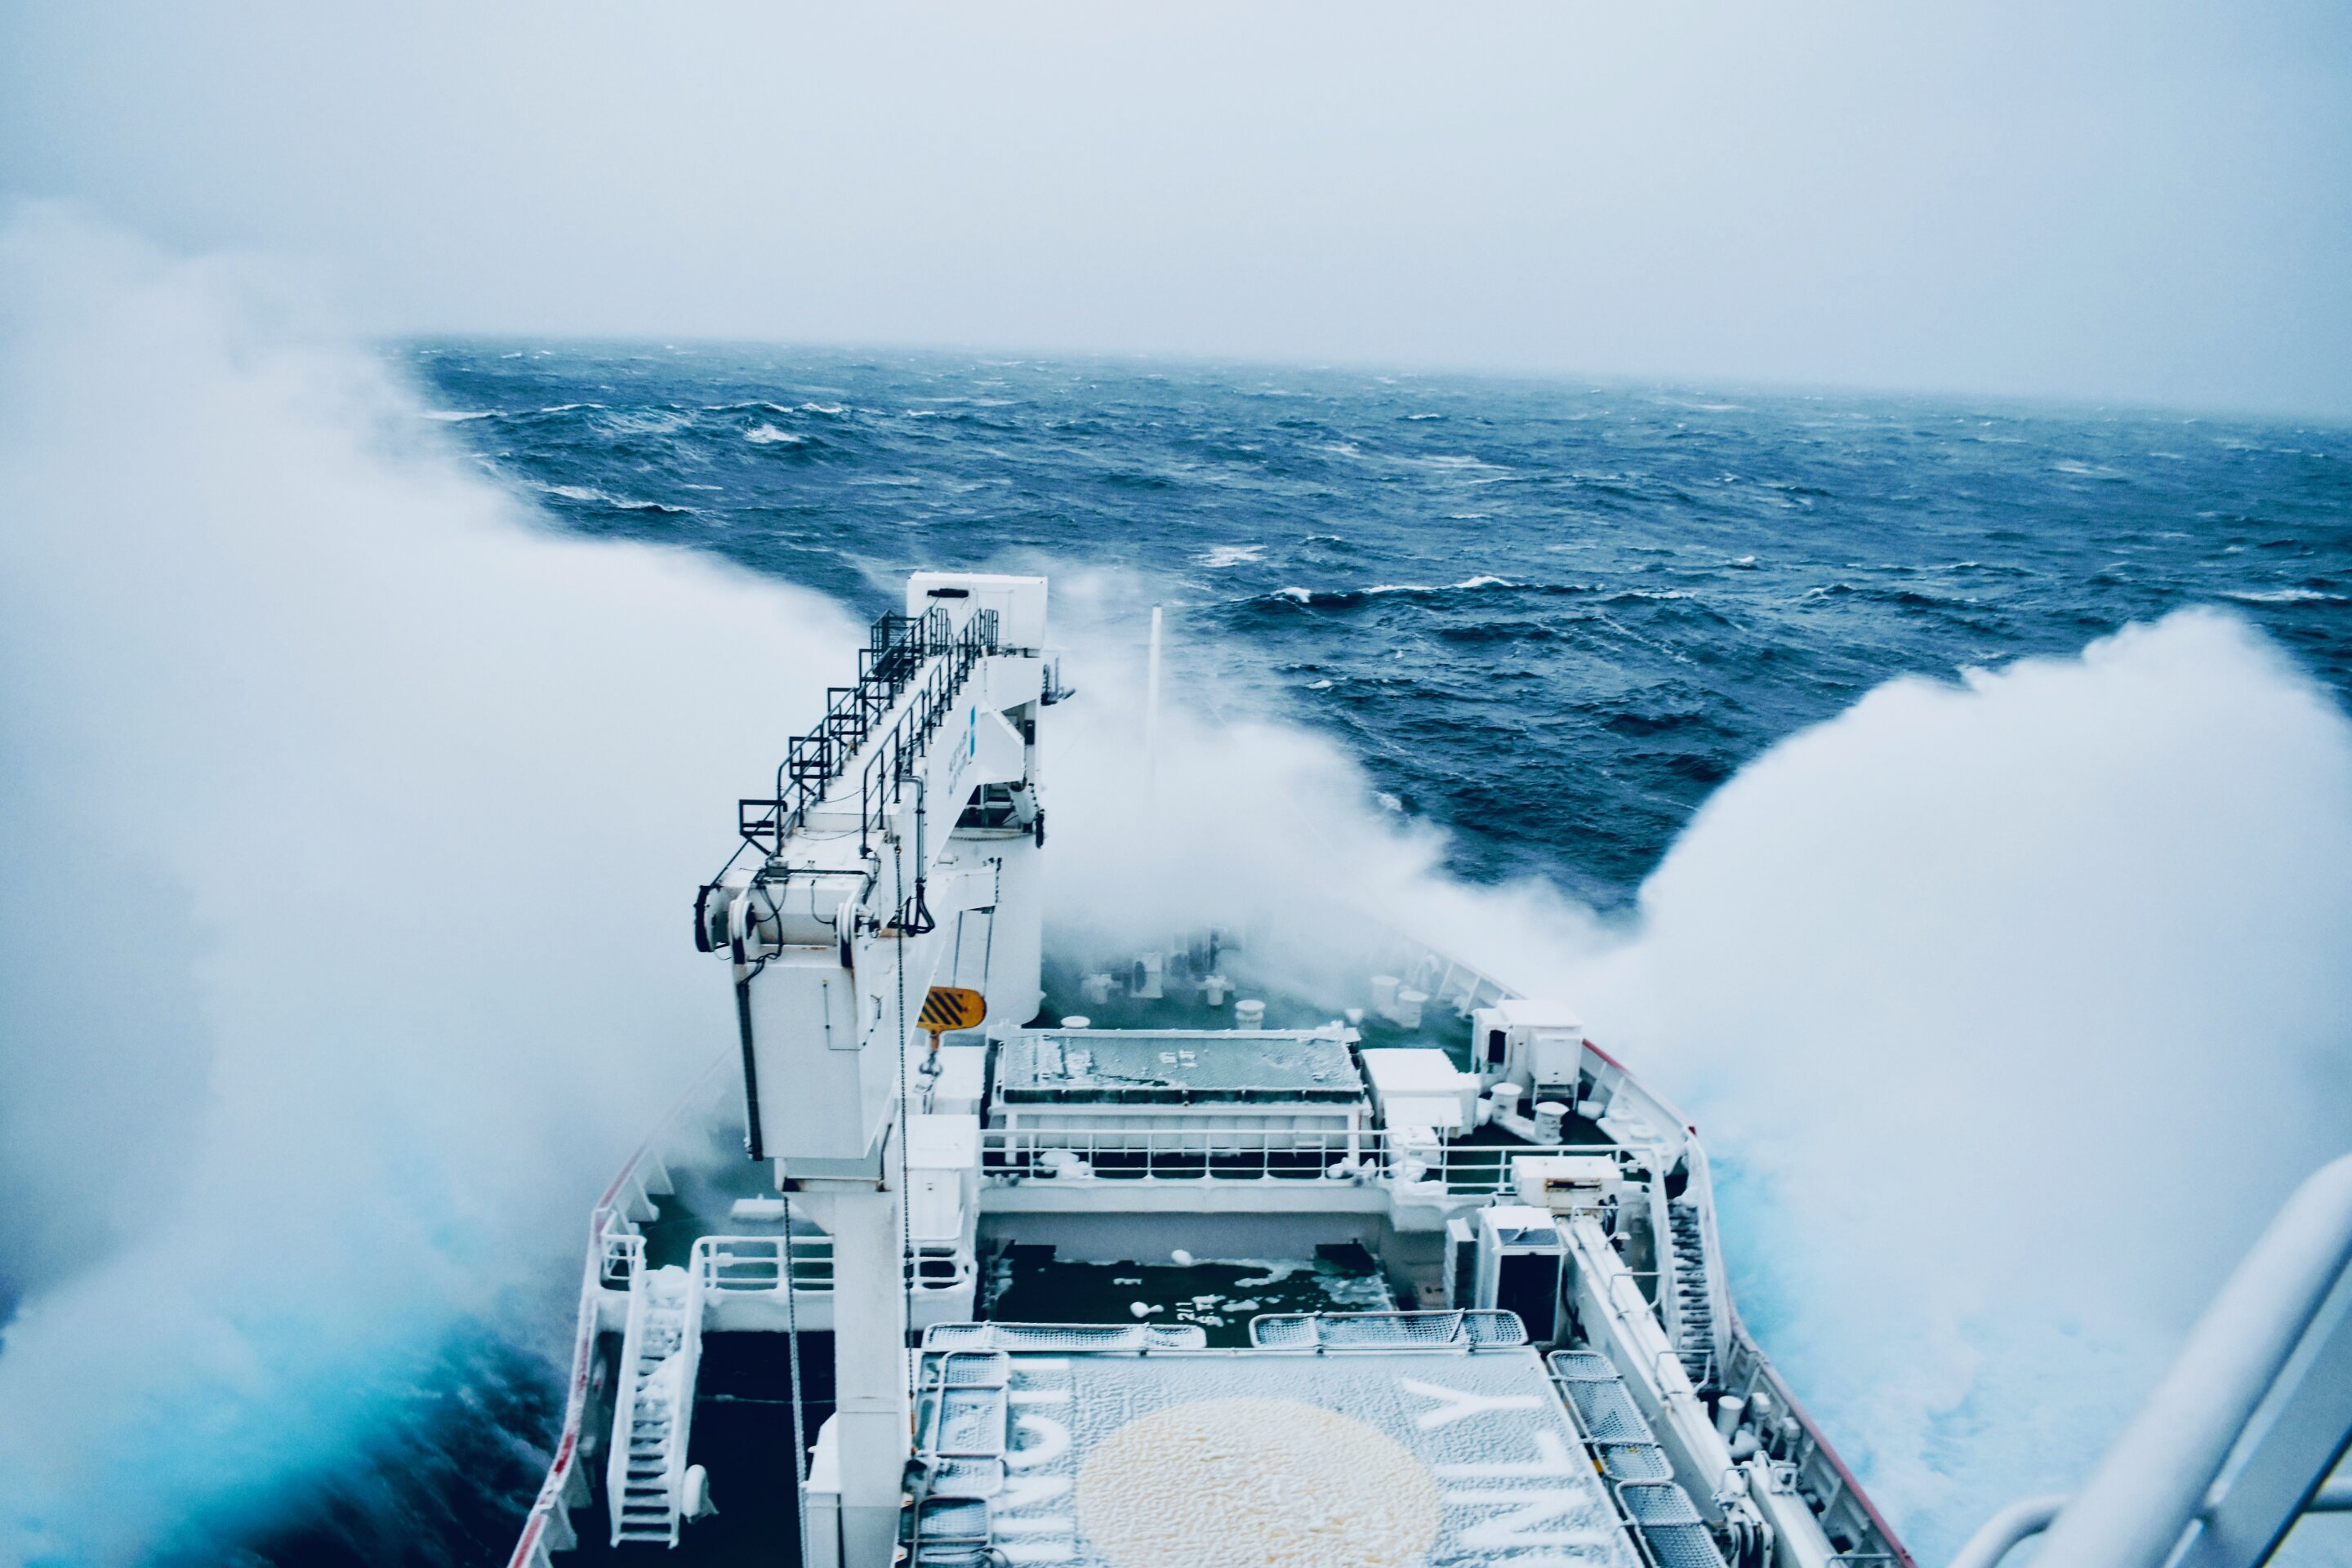
Impact? Massive wave anomaly in the South Atlantic moving North

New study from University of Melbourne says it just all wind. :lol: Nothing to see here folks...Note the study publication date - 12th April! Link below to the article at Phys Org.
 
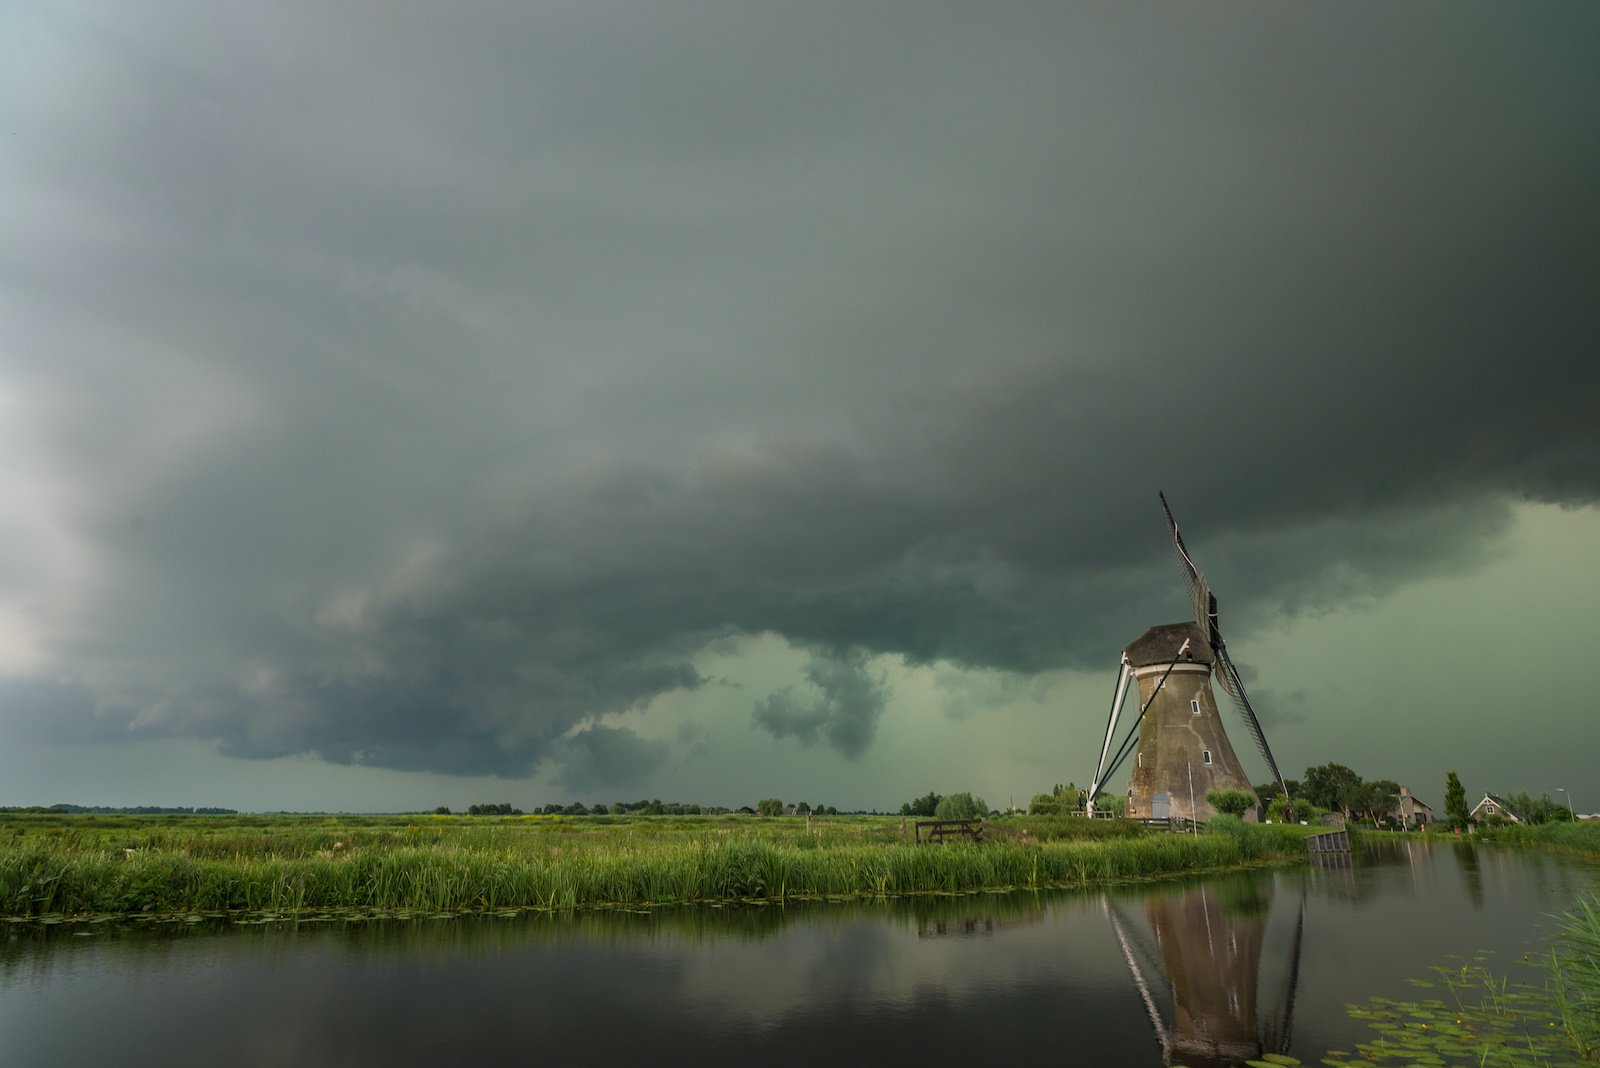
Any idea what might cause this green color during the major rainfall in Dubai today? Was wondering if it might be methane :wizard:

Ive seen many of these scary ominous GREEN storms.
We called them derechos, when I was growing up in Northern Alberta.
I’ve learned that is all about light retraction, and large amounts of suspended water in the atmosphere.
Here’s a little picture explanation:
F9268DF2-6687-450C-A8F4-791CD19F2AC2.jpeg

Here’s a pretty good article about them, if your interested.
 
Any idea what might cause this green color during the major rainfall in Dubai today? Was wondering if it might be methane :wizard:


Ive seen many of these scary ominous GREEN storms.
We called them derechos, when I was growing up in Northern Alberta.
I’ve learned that is all about light retraction, and large amounts of suspended water in the atmosphere.
Here’s a little picture explanation:
View attachment 94470

Here’s a pretty good article about them, if your interested.

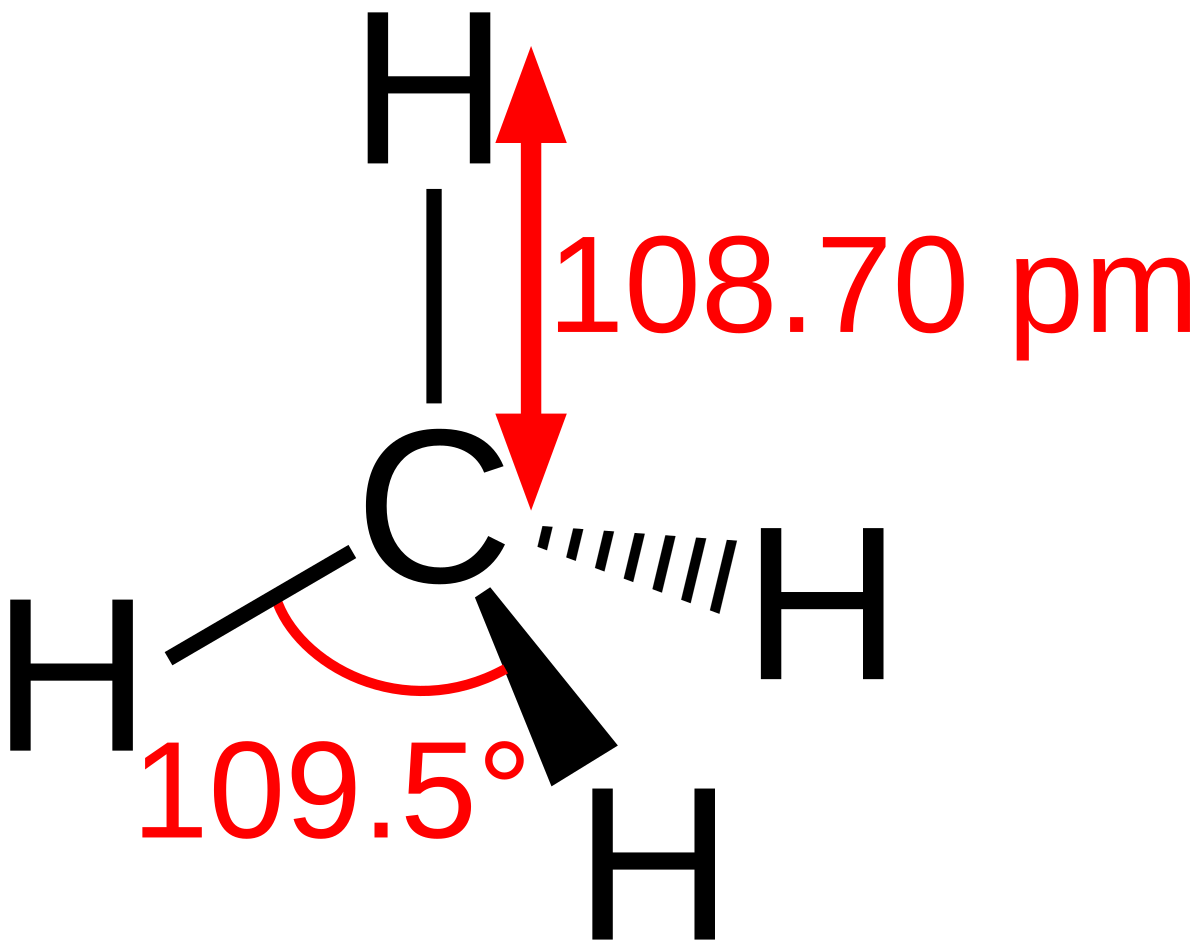
Apart from what Debra suggested I think it might be possible that some amount of Methane in the air could have contributed to the green color. Light refraction is kind of a tricky thing to work out in the atmosphere because there are so many variables to consider such as sun angle, exact atmospheric composition at that point in time etc.

At least according to the following links large methane concentrations in the atmosphere make light look turquoise (bluish with a greenish cast). But how that would look if the atmosphere is far less saturated with methane is anyone’s guess, I would think:


Edit: Spelling
 
Last edited:
At least according to the following links large methane concentrations in the atmosphere make light look turquoise (bluish with a with a greenish cast). But how that would look if the atmosphere is far less saturated with methane is anyone’s guess I would think:
If the >=blue light wavelengths were scattered more by the storm, and a higher methane content was absorbing the red end of the visible spectrum, that could explain why the atmosphere looked so green. The following article states that typical green skies are usually associated with storms at the beginning or end of the day (when the upper visible spectrum scatter is enhanced), but the Dubai storms were during the main portion of the day. So, that suggests for the extra scattering to occur, an additional element should be present. A higher methane concentration could explain this.

 
On a more general note, not having looked too closely into it yet, I would say:

- If it is correct that the anomaly just showed up quickly, more or less in an instant, that many of the publically available, searchable and viewable satellite data sets cover much larger timeframe segments. In other words: They only seem to display timeframes as little as hours. In still other words: If that is the case, for publically viewable data, anomalies that happen quickly and more or less instantly, like for example, an impact of a smaller comet fragment, likely won't show up on those images, even though it happened! For example, I tried to see if I can find/see the mentioned anomaly on the earth.nullschool website, at the reported time and place, without success. But, if you look closely, you can see that the minimal displaying time is 3 hours there. So, in other words: the image is updated (and/or captured/displayed) only every 3 hours. Which means that an event that happens quickly in a time span of less than 3 hours isn't likely to show up, even though it happened. The after effects might show up, though. That might also be the case for other data sets that are not recorded via satellite, such as buoy data. I also think it is likely that there are datasets that are not available to the public where they can record/see everything that happens on earth pretty much in real time. It would be interesting to see those data sets, but, most likely, we will never see them.
What time did you look for? Pretty sure the anomaly recorded lasted over 24 hours (Tuesday, the 9th, 2:00pm, to Thursday, the 11th, 2:00am), so if there were physical effects detectable by other satellites, I'm guessing those would show up.

 
What time did you look for? Pretty sure the anomaly recorded lasted over 24 hours (Tuesday, the 9th, 2:00pm, to Thursday, the 11th, 2:00am), so if there were physical effects detectable by other satellites, I'm guessing those would show up.

I'm pretty sure I have covered that time frame when I looked at it and looked an extra day or so before and after, just to be sure because of time differences and stuff. Couldn't see anything of significance there. I just did it again, with the same result. That is, in terms of waves at sea height.
 
While doing a rough search, there seem to be two satellites that can detect methane emissions on the globe. One is called EMIT and the other one MethaneSAT. The last one is in space already, but data hasn't been sent yet (later in the year it starts). EMIT has data, but as usual with satellite data, it seems to be pretty much impossible for a layperson to get to that data. I would be very surprised if there are not also quite a number of other official and unofficial satellites that track methane emissions and other gas emissions. What I find quite funny: it seems like the more or less publically available satellite data from EMIT only seems to show emissions on the land masses. In other words: you can't see what is going on in the oceans! I'm pretty sure they have that data as well but don't show it, probably because what could be seen is kinda staggering and politically incorrect because methane is a MUCH more potent greenhouse gas than CO2 (even theoretically) could ever be.
 
Apart from what Debra suggested I think it might be possible that some amount of Methane in the air could have contributed to the green color

Not sure about the color, but methane in the atmosphere does, apparently, significantly increase water vapor through oxidation. So I wonder if this downpour in UAE might be linked to that outgassing. The downpour happened about 6 days after the outgassing. Prevailing winds could have taken that long to arrive in the UAE. I also wonder if the heatwave in the Sahel last month, as reported here.


In late March and early April, days and nights of extreme heat above 40° Celsius (104°F) gripped many West African countries. Temperatures soared so high in Mali and Burkina Faso they equated to a once in 200-year event, according to the report on the Sahel region by World Weather Attribution (WWA).

could be linked to the similar outgassing on Feb 21st. You had a "once in 200 years" heat event in the Sahel and then a "once in 75 years" rainfall event in Dubai, both coinciding (roughly) with 2 major outgassings of methane in the S. Atlantic.

Just speculating of course.
 
Last edited:
Not sure about the color, but methane in the atmosphere does, apparently, significantly increase water vapor through oxidation. So I wonder if this downpour in UAE might be linked to that outgassing. The downpour happened about 6 days after the outgassing. Prevailing winds could have taken that long to arrive in the UAE. I also wonder if the heatwave in the Sahel last month, as reported here.


could be linked to the similar outgassing on Feb 21st. You had a "once in 200 years" heat event in the Sahel and then a "once in 75 years" rainfall event in Dubai, both coinciding (roughly) with 2 major outgassing of methane in the S. Atlantic.

Just speculating of course.

A valid speculation in my book.
 
I wonder why Ventusky showed the anomaly, but other similar models and programs showed nothing. Is it that Ventusky uses a specific sensor that was more amenable to detecting this, while other organizaations have different sensors? Or do all these programs use the same sensors, but their programs collect and use the data differently?
 

Evidence for massive methane hydrate destabilization during the penultimate interglacial warming

Interesting article here that explains how methane release from that general area off SW Africa is caused by a weakening of the AMOC (Atlantic Meridional Overturning Circulation).

Basically, warming causes Greenland etc. ice sheet melt and that influx of fresh water into the salty N. Atlantic decreases the salinity, and thus the density, of surface water to the point that it is no longer able to sink and make the return journey to the equator.

This causes intermediate waters at the equator area (and below) to warm which causes dissociation of shallow subsurface methane hydrates and the release of methane (which we saw recently). Methane in the atmosphere causes more global warming in a feedback loop.

This process has been blamed for the "younger dryas" cooling, but we suspect there were far more significant impacts involved, in the form of, well, impacts.... of space rocks, that ushered in a new ice age.

These guys think that will lead to "runaway global warming", but global warming (and as noted, methane itself) dramatically increases atmospheric water vapor which, according to the Cs "moves the belt of great precipitation much farther north", which then leads to a lot of NH precipitation which leads to rapid ice sheet build up and a fairly sudden new ice age.

Q: So, Atlantis existed during the ice age?

A: Largely, yes. And the world's climate was scarcely any colder away from the ice sheets than it is today.

Q: Well, how could that be? What caused these glaciers?

A: Global warming.

Q: How does global warming cause glaciers?

A: Increases precipitation dramatically. Then moves the belt of great precipitation much farther north. This causes rapid buildup of ice sheets, followed by increasingly rapid and intense glacial rebound.

(Daniel) About the weather here in Canada... It's been fluctuating between hot and cold this summer, and in the winter time. And we were just wondering, is the way the ice age is going to occur, will the summers just start to get cooler and cooler with the precipitation as time goes on over the next few years?

A: No, glacial rebound will fall within months when the tipping point is reached.
 
Last edited:
I know nothing about chemistry, but hereafter, for the record, a post by @Puma shared on yesterday in the Crazy Storm Weather and and Lightning - Global thread:
With its millions of petrodollars, the United Arab Emirates has enough money to play God

United Arab Emirates is using cloud seeding tech to make it rain​

  • In the 1990s, the UAE introduced a rain enhancement methodology called cloud seeding.
  • Cloud seeding is the process of increasing the amount of rain produced from the clouds above, which is designed to improve water shortage issues in arid regions around the emirate.
  • By the early 2000s, Sheikh Mansour Bin Zayed Al Nahyan, the vice president of the UAE, allocated up to $20 million for research into cloud seeding.
  • The UAE partnered with the National Center for Atmospheric Research in Colorado and NASA to set up the methodology for the cloud seeding program.
[...]The NCM said it does not use any harmful chemicals in its operations. "Our specialized aircrafts only use natural salts, and no harmful chemicals," the organization told CNBC.


Could there be some reaction between salt (as cloud seeding component) and atmospheric methane (and perhaps 'more' so on the methane in ocean)?

I found this study published in January 2017 (albeit the so-called 'global warming' purpose, it could be of interest) that might talk about it -note however that the salt is 'iron salt'.

Climate engineering by mimicking natural dust climate control: The iron salt aerosol method


Abstract. Power stations, ships and air traffic are among the most potent greenhouse gas emitters and are primarily responsible for global warming. Iron salt aerosols (ISAs), composed partly of iron and chloride, exert a cooling effect on climate in several ways. This article aims firstly to examine all direct and indirect natural climate cooling mechanisms driven by ISA tropospheric aerosol particles, showing their cooperation and interaction within the different environmental compartments. Secondly, it looks at a proposal to enhance the cooling effects of ISA in order to reach the optimistic target of the Paris climate agreement to limit the global temperature increase between 1.5 and 2 ◦C.

Mineral dust played an important role during the glacial periods; by using mineral dust as a natural analogue tool and by mimicking the same method used in nature, the proposed ISA method might be able to reduce and stop climate warming. The first estimations made in this article show that by doubling the current natural iron emissions by ISA into the troposphere, i.e., by about 0.3 Tg Fe yr−1, artificial ISA would enable the prevention or even reversal of global warming. The ISA method proposed integrates technical and economically feasible tools.
[...]

Conclusion. In ideal circumstances the ocean acts as an optimum transport medium for CO2 carbon from the atmosphere into the ocean crust. Such circumstances are present when the vertical cycling components between the ocean surface and ocean bottom are undisturbed.

Any stratification event disturbs this cycling and interrupts CO2 transport. Climate warming can induce stratification events by producing huge amounts of meltwater. Recent research found signs of at least a regional development of a beginning stratification.

The numerous climate cooling effects of natural dust shown in this review, according to its soluble-iron content, demonstrate that dust is of a central significance as a steering element of this carbon transport from the atmosphere into the ocean crust.

This review article demonstrates the enormous effects of atmospheric iron dusts and focuses first on the tropospheric aerosol particles composed partly of iron and chloride
(iron salt aerosols, ISAs), showing their cooperation and interactions with several components of the atmosphere, for instance with CH4, as the chlorine atom is responsible for the removal of a significant part of this GHG (3 to 4% of CH4) in the troposphere (Allan et al., 2007; Graedel and Keene, 1996). This article summarizes a dozen of other possible direct and indirect natural climate cooling mechanisms induced by iron biogeochemistry in all the Earth compartments: the atmosphere, oceans, land (surface, soil), the sediment and the crust.

These dozen possible climate cooling effects due to the multistage chemistry of iron within the atmosphere, hydrosphere, geosphere and lithosphere are described together for the first time and are summarized in Table 3, which shows the most probable climate cooling effects of ISA. They include the ocean fertilization effect, which allows enhanced algal and phytoplankton growth, which in turn removes mineral CO2 from the atmosphere and transforms it in organic carbon, part of which can sink to the bottom of the oceans and be stored for long periods of time by the different mechanisms that are described.
[...]

While the iron biogeochemical cycle between the atmosphere and the ocean is considered in numerous publications, the treatment of key processes and feedbacks within the terrestrial compartment has been rather limited, and further development is urgently needed.

Mineral dust aerosols containing iron and other important nutrients or micronutrients are well-studied components of the iron biogeochemical cycle in the atmosphere and the oceans, but the absence of recent publications about the full iron biogeochemical cycle over terrestrial landscapes, soils, wetlands and all clear-water compartments (glaciers, ice, snow, lakes and groundwater) points to a lack of an up-to-date overview. In our opinion, atmospheric chemistry models need to incorporate all relevant interaction compartments of the Fe cycle with sun radiation, chlorine, sulfur, nitrogen, oxygen, carbon and water in order to model several planetary cooling effects of the iron cycle.
[...]

Simplified chemical reaction scheme of the generation of chlorine radicals by iron salt aerosols under sunlight radiation and the reaction of the chlorine radicals with atmospheric methane.
Simplified chemical reaction scheme of the generation of chlorine radicals by iron salt aerosols.png

Process of tropospheric cooling by direct and indirect increasing of the quantity of different cloud condensation nuclei (CCN) inducing albedo increase by cloud formation at low supersaturation, cloud whitening and cloud life elongation.
Process of tropospheric cooling by direct and indirect increasing of the quantity of different...png


Possibly, they wanted rain, they had 'deluge'. Careful what you wish?
 
I wonder why Ventusky showed the anomaly, but other similar models and programs showed nothing. Is it that Ventusky uses a specific sensor that was more amenable to detecting this, while other organizaations have different sensors? Or do all these programs use the same sensors, but their programs collect and use the data differently?
My take is that probably others have some input filtering enabled and are considering anomalous data, a sensor malfunction that is not fed into models, or maybe some input smoothing that was rejecting transient values. Ventusky's provider, on the other hand, maybe didn't have that kind of safeguard, and the model wasn't even prepared for that kind of events. So they were kind of right in saying that this was a model error, but the general public interpreted this as "everything is fine", as everything today is black or white, with no grey in between...
 
This causes intermediate waters at the equator area (and below) to warm which causes dissociation of shallow subsurface methane hydrates
According to a few different bathymetry maps, the depth in that area of the South Atlantic could be up to 5km deep, unless it mostly occurred from shallower ridge areas around the islands. But the size of the anomaly on VentuSky suggests to me it was in a deeper part of the ocean. If the deep ocean has warmed that much, then this could just be the beginning of these sorts of events.
 

Trending content

Back
Top Bottom