Near-Earth objects and close calls

Imagine the panic and consider the possible test runs which have been active lately.
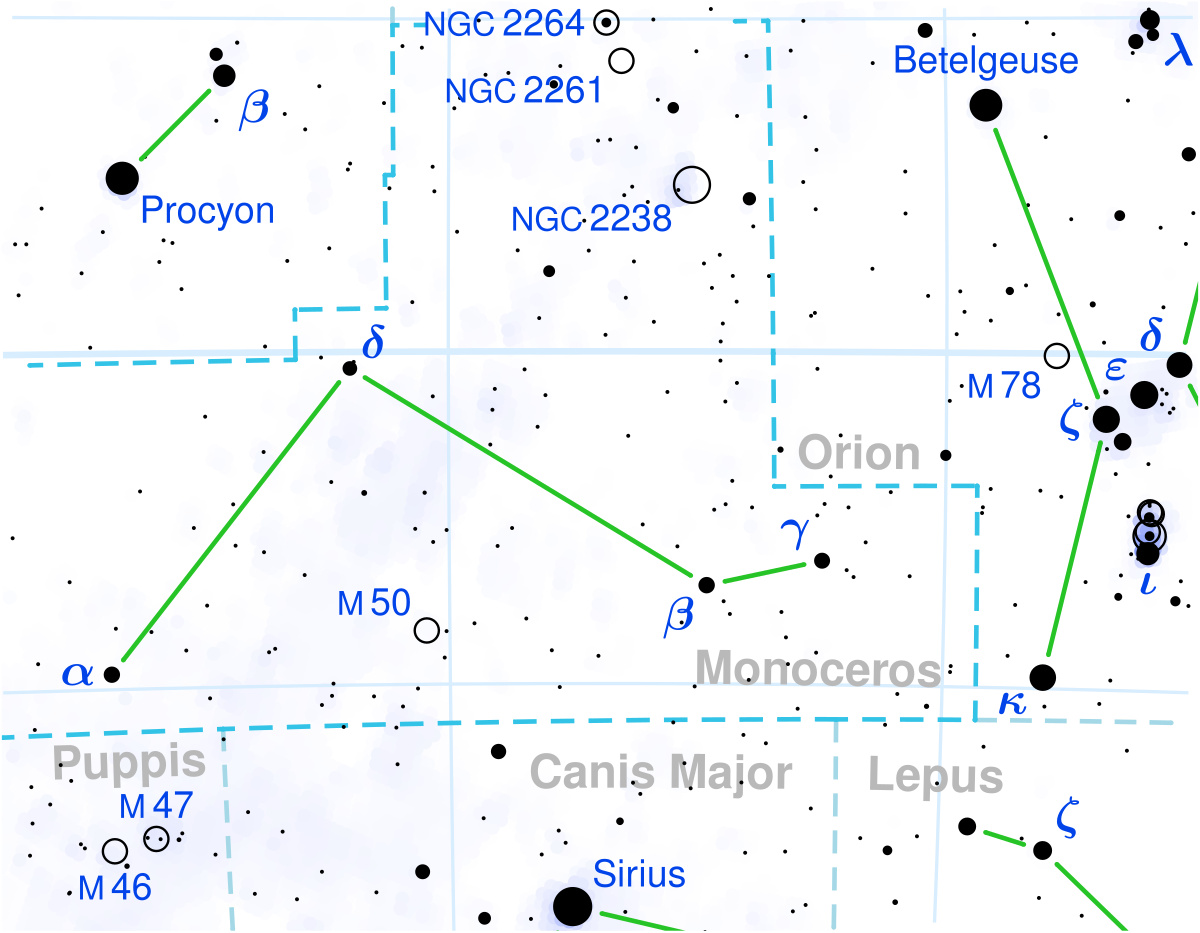


From Cometografía on Comet C / 2017 T2

Snip:
They discovered on October 2, 2017 by the robotic telescope surveillance Pan-STARRS in Hawaii (USA) when the comet was magnitude 20 and was on the constellation Eridanus, in the days following observations made by different observers reported a comma of up to 12 " diameter and the presence of a small tail 20 "long.

The C / 2017 T2 (Pan - STARRS) is a new comet coming from the outermost portion of the Oort Cloud. It will reach its perihelion on May 4, 2020 at a distance of 1.62 AU from the Sun, before will have a first approach to Earth on December 29 at the distance of 1.52 AU from our planet, and a subsequent approach the May 28, 2020 at a distance of 1.66 AU. Available observations to date determine a light curve with approximate parameters of absolute magnitude of m 0= 6 which corresponds with a core of about 3 km in diameter and an increased rate of activity of n = 3. The kite will have its maximum apparent brightness in May 2020 when it could reach a visual magnitude close to 8 being observable then through binoculars from the Northern Hemisphere, but will be observable by small telescopes or binoculars giant above magnitude 9 throughout the first half of 2020.
Report: Forecast Visibility: Location:


I am looking at the Asteroid 2015VW172 with Wide Field Camera 3 for on Sun, 03 Nov 2019 14:14:31 -05:00
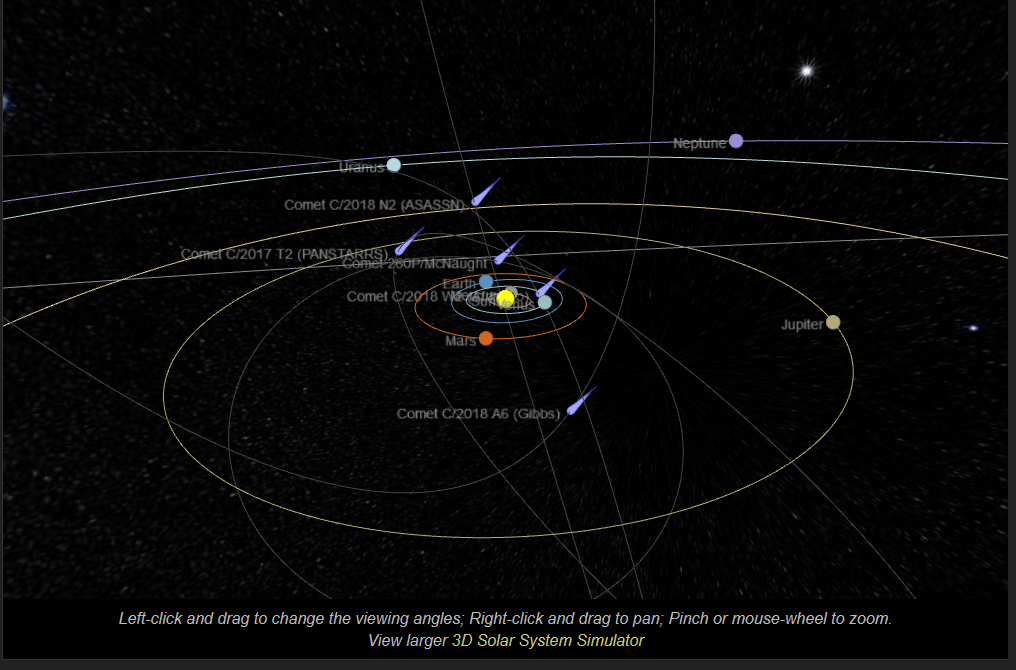
Current Solar System Configuration
This interactive 3D model shows the today's configuration of the major bodies of the Solar System along their orbits. It is an experimental feature and it requires a WebGL enabled browser. For more advanced features, check out our 3D Solar System Simulator.
Please provide us feedback!

These are the brightest comets currently visible in the sky. The Observed Magnitude and Coma Diameter values are derived from the Comet Observers Database by averaging the values reported in recent observations (more recent than 4 days), when available.

The Estimated Magnitude comes from the JPL Horizons ephemerides service and might be inaccurate given the highly dynamic and unpredictable behvior of comets. When available please refer to the Observed Magnitude value and consider the Estimated Magnitude as a directional indication.
a7ef9c8f239cb288a1dfccc245fedca1.png


Bright Comets Today

These are the brightest comets currently visible in the sky. The Observed Magnitude and Coma Diameter values are derived from the Comet Observers Database by averaging the values reported in recent observations (more recent than 4 days), when available. The Estimated Magnitude comes from the JPL Horizons ephemerides service and might be inaccurate given the highly dynamic and unpredictable behvior of comets. When available please refer to the Observed Magnitude value and consider the Estimated Magnitude as a directional indication.


The Solar System Origins Legacy Survey
info
Proposal 15648 (STScI Edit Number: 3, Created: Thursday, August 15, 2019 at 4:05:35 PM Eastern Standard Time) - Overview
 
Thanks for the responses - in further thought I realised the questions are theoretical or philosophical and I do not wish to hijack the thread as it's one of science and perhaps my comments belong elsewhere. I'll reply here for now, but to the administrators, I'm happy for it to be moved.

@MikeJoseph82 ,

Yes, I think we have always had to make "assumptions" based on very poor data and our means of measurement.

Session 3 December 1994:
-----
I would say we know very little about our "planetary realm" and lack the instruments to measure the known much less the unknown.

Session 1 March 1997:
-----
I think there may be "objects" near earth that are not even "natural". They may not be comets, asteroids or meteors.

Session 4 December 1999:
-----
Even though the Cs say the government is aware of this "object" they may be clueless about the details.

Session 21 December 2012:
-----
I really doubt that we really know "what we are witnessing right now" so even that sense of "normal" could be way off.

I did try looking for photos relating to this reference 'Millennium Group site, there are some photographs that seem to indicate that there IS something anomalous in orbit around the Sun' but came up blank. It was 1999 so perhaps the page or group no longer exists. Near the sun would be a sneaky place to hide though; the Chelyabinsk metor(ite) was missed because it came from the direction of the sun, or so the excuse goes. It's a good get-out-of-jail-for-free card for agencies and other experts looking for future objects heading our way that they fail to forecast - if they can't see it directly, how can they predict it?

So, citizens logging fireball sightings have certainly been on the increase, not scientists (maybe some) or gov agencies. So it's not down to technology, per se; it could be that more people are aware of the website and therefore more reports are logged; maybe an AMS app was released allowing easier reporting, etc... I don't have the answers to those. Certainly, while technology seems to be advancing even faster with each passing year, can we assign the increases in just over a few years to technological advances?

That's related to my question, and almost a chicken-and-egg type question. Are the reports increasing because they are actually happening and increasing in frequency, or are more people noticing them more frequently because new technology allows them to share what they have noticed, perpetuating the likelihood of further increases in reporting frequency?

There are other events happening on our planet which point to great changes that are not considered normal. These events also support theories that explain why we're seeing an increase in fireballs: we have the 'Grand' Solar minimum (they have records going back hundreds of years); the discovery of 2 rare interstellar objects in quick succession; 6 galaxies under going rapid transformation; the gulf stream is slowing down; the jet stream is changing; our atmosphere is showing signs of what could be increased cometary dust loading; Saturn has a load more 'moons', and so on. One such theory that can explain at least some of these events above is our Sun's companion Nemesis, and it could also be responsible for throwing more rocks our way.

Yes, and to be clear, I'm not denying any of this is being observed, or that we are witnessing increases in these things. Going back to my original thought, is it because we have the ability now to record this information in a way that hasn't existed for the past few millennia? Is what we are witnessing strange relative to our lifetimes versus the 100s, 1Ks, 1Ms of years that some cycles exist within?

This is the only forum I feel comfortable in asking questions without being trolled, and I sincerely am not looking for a fight or argument. I do think it's important (at least to me) in determining if what is being witnessed and measured currently is rare or not. Perhaps it's not possible to determine this conclusively from our scale and may never be.
 
Yes, and to be clear, I'm not denying any of this is being observed, or that we are witnessing increases in these things. Going back to my original thought, is it because we have the ability now to record this information in a way that hasn't existed for the past few millennia? Is what we are witnessing strange relative to our lifetimes versus the 100s, 1Ks, 1Ms of years that some cycles exist within?

@MikeJoseph82 ,

I think one of the best sources may be the thread on Randall Carlson's work. He seems to be able to pull together the ancient history accounts that seem to represent the astronomy of early civilizations (and also the study of geological formations) while attempting to verify those findings with many of the new technologies.

Randall Carlson's Work: Striking similarities (Comets, Geology, Catastrophism etc.)
 
Are the reports increasing because they are actually happening and increasing in frequency, or are more people noticing them more frequently because new technology allows them to share what they have noticed, perpetuating the likelihood of further increases in reporting frequency?

As it happens, a couple of days before you asked your question, I started to get curious about apparent recent influx of objects coming fairly close to earth. Up front, it should be stated that the subject matter, of really putting a hard undeniable finger on whether an increase is happening is a very complex subject matter because of the very nature of the subject. You would also have to define what exactly "normal" is in that context. There are so many variables and uncertanties involved, not just on the technical dimension, but also on the human dimension, that it is pretty much impossible at the moment to say anything for certain or with "100% proof".

Having said that, from my pretty extensive dive into the subject for years, I can tell you that the idea that there is a fairly stark influx of comet/asteroid bodies both in the solar system as a whole, as well as close to earth recently, is a fairly good estimate that is supported by many data points and seems to be true. As itellsya pointed out though, this estimation is based on a whole set of areas. If you want to have one source of data that conclusively proofs or disproofs this idea, I can tell you that this is pretty much impossible with this subject matter at hand.

If however, one wants to put a finger on it, that might come to a rough approximation of the current state of affairs, I think the Data-Sets provided by the American Meteor Society are the most reliable in terms of a single source showing what most likely is going on at the moment. A old table (last updated 2017) including graphics can be found here. A new updated table that includes 2017 and 2018 looks like this now, and can be found here:

Unbenannt das.jpg

One of the reasons I think the AMS data is probably closest to the truth in terms of single source is the way the data is gathered, selected and processed. It is based on people reporting seeing fireballs in the atmosphere of the earth. This de facto makes the argument of "improved technology" rather hard to defend in explaining this exponential increase. As Pierre also pointed out in his book "Earthchances and the Human Cosmic Connection", that dataset is hard to explain by improved technology, especially considering the significant dips in reports in 2015 and 2018 (while climbing up before and afterwards), while still being orders of magnitude higher than just 10 years earlier.

How likely is it that people within the US all of a sudden started to look more into the sky, considering all the distractions, including cellphones and light pollution, that makes seeing things in the sky more difficult? How likely is it that more people take notice of what is happening in the sky around them and therefore report more of this? In fact, if anything, the exact reverse seems to be happening; ever more people seem to take less notice of what is happening above their heads and instead looks at their screens. So how can this explain the exponential increase? And are we to assume that the technology wained down in 2015 and 2018 respectively or that people in those years where just less interested in looking above their heads?

There is also a pretty consistent exponential increase noticeable in pretty much every other data-set you can look at, that closely parallels with this fireball increase. Just a coincidence and explainable with "improved technology"? In itellsya post, you can find some of those data sets, that go beyond just earth itself, out into the solar system. And then we also have all the new moons around the outer planets being discovered. Here also, Pierre made some good arguments in his book that speak against the idea that this all might be due just do to "better technology" over the years. Also thorbions posts above is important in understanding the complex nature of the subject as well as the vast distances and spaces involved.

Which brings me to what I originally wanted to post about; Close encounters with NEO's since the record began till present and future and how that might compare to all of this other data. Even more interesting though, are the questions and conclusions that could be drawn from the data-set I'm about to present below and possible ways to discover connections with the fireball data (observed by people on earth) and things happening on the globe in other areas.

See next post.
 
Last edited:
First off, here is the table I created over the last weeks, which will be the basis of what follows. Feel free to play around with it as you wish.

Since we have seen what seems to be so many close encounters of the comet/asteroid type recently, I thought it might be worthwhile to compile all this data into a table in which each column can be chronologically ordered and specific data points gathered out of it. As source, I used this official database by NASA, in which all Near Earth Object's (NEO's) that were ever discovered are listed. As criterion, I thought it might be interesting to just use all the objects that came closer to earth than 1 Lunar Distance. Which means that in the table only those objects that came closer to earth than the moons orbit (and will come closer in the future) are listed. The original thought behind creating this table was based on wanting to know how far ahead in time each object was discovered before it made its close approach to earth. Turns out the result is rather shocking but not surprising. See table.

During the creation of the table I discovered that nowhere on that NASA page you can actually find out when an object was first observed, aka discovered! I found that out when it was time to put in the data for "2019 ok", a big object that recently slipped by earth. On the NASA page you can only find "first obs. used" which is dated at 2017 for "2019 OK"! It is a fact though that "2019 ok" was first observed just a day earlier. Took me a while to figure out that this date presented by NASA is actually the back calculated date from the assumed first reliable point in the trajectory of the object! Not the discovery date! Long story short, the only place I could find on the internet, where you can find the actual date of discovery of each object and by which observatory, is this page. So I had to search for each object manually there to get that date data points. The results you can see in the above table in the column "Date Discovered". With this data-set it was possible to create the column "Days notice" in which you can see how far ahead in time (or back in time) an object was discovered before its close approach to earth. As you can see, everything marked orange in that column means, the object was discovered either on the same day as its close approach happened or later in time, after the fact of the close approach. Quite interesting (or rather, dismaying) results right there!

Here is a short explanation of each markings on each column:

- Column A "Object" = Name of the NEO Object: Marked cells in this column are the same objects listed more than once in the data table. Use "sort this column from A - Z" or reverse, to see results. Or use the "Filter" to filter out specific information.

- Column B "Date Discovered" = The actual date of first discovery/observation: No markings, because it is not really needed. Use "sort this column from A - Z" or reverse, to see results. Or use the "Filter" to filter out specific information.

- Column C "Close-Approach (CA) Date" = Date when the object came closest to earth: Marked cells in this column are close approach dates that will happen in the future. All others (non marked cells) are therefore close approach dates in the past. Use "sort this column from A - Z" or reverse, to see results. Or use the "Filter" to filter out specific information.

- Column D "Close-Approach (CA) Time " = Time of day when the object came closest to earth: No markings, because it is not really needed. Use "sort this column from A - Z" or reverse, to see results. Or use the "Filter" to filter out specific information.

- Column E "Days Notice " = Days elapsed between first observation and close approach: Orange marked cells in this column are close approaches that happened on the same day of the first observation or after the close approach already happened. Everything under "0" (including "0") therefore pretty much happened without any forewarning possible. Use "sort this column from A - Z" or reverse, to see results. Or use the "Filter" to filter out specific information.

- Column F "CA Distance Nominal (LD | au)" = The most likely close approach distance [Earth center to NEO center) in LD (Lunar Distance; aka distance from earth to moon) and au (Astronomical Units; aka distance between sun and earth)]: This column has a color scale in which the red marked cells are the closest approaches of objects and white the farthest away. For red I picked the distance of 0.09 LD or less, since the furthest satellites that circle the earth are situated in approx. this distance. Three additional colors are in the color scale between the white and the red. Use "sort this column from A - Z" or reverse, to see results. Or use the "Filter" to filter out specific information.

- Columns G and H are the "Low. Estimated Diameter (m)" and "High. Estimated Diameter (m)" respectively = "The Lowest estimated Diameter in meters for each object" and "The Highest estimated Diameter in meters for each object". Both column have the same color scale in which the most reddish marked cells are the biggest objects. Use "sort this column from A - Z" or reverse, to see results. Or use the "Filter" to filter out specific information.

Data, Questions and graphs that can be gathered from this table will follow soon.
 
Last edited:
First off, here is the table I created over the last weeks, which will be the basis of what follows. Feel free to play around with it as you wish.

Data, Questions and graphs that can be gathered from this table will follow soon.

First off, you can find the short version of what follows here and in the main table (already mentioned) out of which all of it is derived here. You can adjust the tables and graphs as you like, nothing will happen since I've secured that only I can edit it.

- From the table we can see a total of 566 NEO objects that were ever discovered that have and will reach the earth closer than the moon. We can also see that the first object of this kind was only discovered in 1991 (1991 BA) via the "Date Discovered" column! The earlier dates are calculated approaches of the objects that must have happened in the past (aka. before 1991).

- Out of those 566 NEO objects 548 close encounters have already happened, the rest (48), will happen in the future. So there is a total of 596 close encounters listed in the table, including the future. The close encounters till present (548), excluding the future approaches, happened in this sequence:

Unbenannt das.jpg


Notice that the numbers started to pick up out of the norm (reaching back to 1910) exponentially around 2003 until it ended up orders of magnitude higher in the last four years, while 2018 and 2019 (which hasn't ended yet) are the highest of them all. Now compare this overall trend with the fireball data and other data points. A very close match! Also notice the dips in 2012, 2013 and 2015 respectively! Here again we can ask, how can that be explained by "improved technology"? Also notice the missing years in which no close encounter as far as we know happened.

We can also summarize that 500 out of those 548 close encounters happened since 2003 till present. Or in other words; over 91% of those close encounters happened since 2003.

- In the following graph we can see a sequence comprising the same 548 close encounters, ordered by the date of discovery (first observation) of those objects. Remember the first of those objects was only discovered in 1991 (1991 BA):

Unbenannt das.jpg


A very similar picture... Also notice the dips again and compare them with the dips in the fireball data. So we can summarize that 542 out of those 548 close encounters were discovered since 2002. Or in other words; Almost 99% of those close encounters were discovered since 2002. Also notice that in the 11 years from 1991 to 2001, a sum of only 6 such objects were discovered, while there are 6 years in that time frame where a total of 0 were discovered (1992, 1995, 1996, 1997, 1999, 2000)!

We can then also ask why in those years (1992, 1995, 1996, 1997, 1999, 2000) not one single telescope on earth discovered even one such object, although they are usually pretty close to earth and thus theoretically better to spot? Was the technology back then really so much worse? Were there no telescopes looking at the sky all around earth? I think the far more likely and logical reason is because the space around earth was far less crowded with objects back then.

Also, we can summarize now; in the whole history of mankind up to 1991, not one single object of that kind was ever discovered (ZERO!). Or in other words: In all the years into, through and out of the age of reason, through the industrial revolution, in and out of WWI and WWII, deep into and out of the cold war and deep into the space age, a sum of ZERO such objects were ever discovered up until the year 1991! Now, compare this to last year, in which a staggering number of 78 such objects were discovered in just that single year! How likely is this due to "bad technology back tan", especially if you compare it with the orders in magnitude of increase starting in 2002? It is just such a staggering discrepancy (especially if you compare it with similar data from other areas) that I think the likelihood that this is just caused by "improved technology" is pretty slim in comparison with the simple idea that immediate environment around earth has gotten much more crowded with objects.

There is a further reason I say immediate environment around earth (besides the fact that we are only looking at objects in this inquiry that have come and will come closer to us than the moon). If we look at the table, we discover something else quite interesting (also in terms of the idea "bad technology back then" and "improved technology now).

- Again we use the 548 close approaches till present as basis. Out of those 548 close approaches. 330 were discovered after they already passed closest to earth, or on the same day as the close approach happened. Which means that over 60% of those (548) close encounters were discovered after their closest approach to earth. So we can ask; Were the telescopes before 1991 and after 1991 so bad that they couldn't discover those 330 encounters that happened so close to earth (and thus argumentatively easier to spot) at the time of their closest approach?

Further, an additional number of 140 out of the total of 548 close encounters were spotted just 1 to 2 days before their close approach. That makes 25.5% out of those 548 encounters. Then we have a flopping number of 68 out of those 548 encounters that were spotted a max amount of 13 days prior (out of which 53 close encounters (or almost 78% ) were spotted just 3 - 5 days prior) or 12.4% out of the total of 548 encounters.

So that leaves us with a number of (330 + 140 + 68=) 538 close encounters out of the total of 548 that were discovered either much, much later than their close approach, or at most, 13 days prior to their close approach, which is a staggering number of over 98%. The flopping remaining number of 10 close encounters (under 2%) were spotted between 192 days and 3649 days prior to their close approach. Of those 10, the biggest object was a max estimated diameter of 250 Meters, while another 2 objects out of those 10 were a max estimated diameter between 94 meters and 110 meters; the remaining 7 of those close encounters were a max estimated diameter between 7.5 meters and 43 meters. While one of those smaller ones (max. diameter of 18 Meters) was discovered the max amount of 3649 days (in that 548 encounter list) prior, as opposed to the biggest one out of those 10 (max. diameter of 250 Meters) that was discovered much later; 2141 days prior.

So we can summarize: The 538 close encounters on record, that were discovered either much, much later as their close approach, or a maximum of 13 days before the fact (aka. almost ZERO forewarning or almost ZERO observation prior), include the biggest object (2011 MD5), the third biggest object (2002 CU11) and the fifth biggest object (1998 KJ1)) in the whole list, with a max estimated diameter of "1600 meters", "1200 meters" and "780 Meters" respectively. Since those three apparently slipped by earth in their close encounter in the years "1918" , "1925" and "1914" respectively, we can indeed argue that that could have been due to "bad technology".

- However, since the year 1991 we have experienced a total number of 511 close encounters with the following size distributions, sorted chronologically since the first observation of such objects in 1991:

Unbenannt das.jpg

Here you can find the whole graph expanded to see each diameter better. Notice that huge chucks flew by earth all throughout that period (notice also the peak ones) and how a whole number of those were discovered literally in a whole series of successions in 2017, 2018 and 2019. However, the last graph above is a bit misleading IMO to get to know if there is an increase both in sizes and numbers.

The reason for that is for example that in 2001 only a total two objects flew by earth that close, namely (2001 BA16), with an estimated max diameter of 38 meters, and (2017 VW13) with an estimated max diameter of 430 meters, compared with 2018 for example, in which a total of 78 such objects flew by earth. This means that the year 2001 stands out in the last graph above by the fact alone that only two objects were discovered, while 2018 doesn't stand out because 78 such objects were discovered. Or in other words; in the last graph above the number of discoveries as well as the sizes of those objects are not accounted for in determining an increase or decrease because both variables are not correlated with each other.

There is however a better (and more trustworthy) way IMO to include both variables in the equation in order to show a more realistic trend both in terms of sizes and numbers. For that I've totaled up all max estimated object sizes for each year (not mathematically all that correct, I know. Mass would be better, but we don't have that), to arrive at a hypothetical "total diameter" for each year, with the following result for the exact same time period seen in the last graph above:

Unbenannt das.jpg

That means that the total diameter (or rather, total volume or mass of all object combined in each year) also increased in a similar exponential fashion since 1991.

One last note for now, for a better perspective: In 2017 we have seen for example a total of 5 close encounters over 40 meters in size with max estimated diameters between 41 meters and 82 meters. In 2018 we have seen a total of 6 close encounters over 40 meters in size, 3 of which had max estimated diameters between 41 meters and 62 meters, 2 of which had max estimated diameters between 100 meters and 110 meters and 1 of which had a max estimated diameter of 190 meters. So far in 2019 we have seen a total of 5 close encounters over 40 meters in size, 3 of which had max estimated diameters between 41 meters and 66 meters, while the other 2 close encounters had max estimated diameters between 120 meters and 130 meters.

Out of those 16 objects mentioned in the last paragraph above (over 40 meters in size between 2017 and 2019), only 1 was discovered far ahead of time, namely a 110m object that was spotted 2723 days earlier. While 1 of those objects (41 Meters in size) was discovered 13 days prior; 1 of those objects (62 Meters in size) was discovered 6 days prior; 2 of those objects (66 and 120 Meters in size respectively) wer discovered 3 days prior; 2 of those objects (100 and 130 Meters in size respectively) wer discovered 1 day prior, while the remaining 9 objects were all discovered after they already made their close approach, in the following sequenze: 1 day to late (45m), 2 days to late (41m), 2 days to late (75m), 2 days to late (82m), 2 days to late (190m), 4 days to late (41m), 4 days to late (49m), 6 days to late (57m), 546 days to late (61m).

You can find all the graphs above in more detail here as well as the main table from which all of this is derived here. There is a lot more interesting data that can be pulled out. For example, we haven't even mentioned the future encounters or how the past ones might relate to happenings on earth.
 
Last edited:
Thanks for sharing @Pashalis.

If you look at the first chart, there's a 7-year cycle in NEO close approaches with peaks in 2004, 2011 and 2018, which are then followed by a drop in the following 1-2 years before picking up again. There is no data for 1997 and the figures before 1991 are calculated so hard to say if it's just a coincidence. Don't know what it could be related to though.

Notice that it all started getting wild just a couple of years after 2001, 9-11 and all that. A response to humanity's madness?

Yes, the number of discovered approaches rises almost exponentially from 2002 onwards. The cosmos is sending us a message, and it couldn't be clearer!
 
I just had a short glance at the most up to date NASA raw data and since I‘ve created the table and graphs above at least three more NEOs (all new discoveries I presume from that glance) have slipped by earth. All of those came a good deal closer to earth than 0.50 LD with the closest one slipping by at 0.36 LD. Obviously I‘ll update all the above data accordingly in intervals in the future. If it continues like that, 2019 will probably beat 2018 in the all time high.
 
I wonder how those numbers correlate with earthquakes and volcanic eruptions?

I think it should be possible to derive such and similar interesting data points from the table and especially when combined and cross referenced with the fireball data from AMS and at least one other pretty interesting source about measured kt impacts from fireballs on the globe till present, including where on the globe they exploded.

If all three could somehow be correlated/compared and automated (as far as possible) against eachother, I think very interesting stuff could maybe be seen. Theoretically it should even be possible to create a more or less reliable warning system out of that and look at things that have happened on the globe from possibly a somehow related angle.

One thing that might also be possible to presume out of all this data are other possible objects that either haven’t been spotted yet and/or are known but not made public.

As of now I think it could be altogether quite possible that they already spotted at least one object (or more) that will likely impact earth in the (near) future according to their predictions, but those likely have been classified or something. Thus, not included in the list.

That they come in swarms and dust clouds more often than not it seems, makes the close approaches in the table even more interesting. Depending on how broad the swarm debris are spread, even a not so close encounter (let’s say between 0.99 LD and 0.50 LD) could lead to rather noticeable encounters from unnoticed chunks and debris leading to fireballs and other effects on earth.
 
I wonder how those numbers correlate with earthquakes and volcanic eruptions? Notice that it all started getting wild just a couple of years after 2001, 9-11 and all that. A response to humanity's madness?

Earthquake of magnitude M5 occurred in France 40 minutes ago at a depth of 2 km Damage has been recorded in the street furniture, although we do not have to regret any personal damage at the moment https://emsc-csem.org/Earthquake/ear

Depth 10 km updated from earlier post.
Earthquake, Magnitude 4.9 - FRANCE - 2019 November 11, 10:52:45 UTC

 
Nice EM diagrams in the book I'm currently reading:
Lethbridge's Ghost and Divining Rod, where he proves that all small objects have electromagnetic fields that extends far and wide away from them, far up and deep down.
Lethbridge shows in diagrams, how far EM-fields extend from trees [strongest at the trunk] and how intense is the "psychic"-field = EM from even one human.
Imagine how large an EM-field humanity generates - combined - and how strong it must be extending way beyond Earth as it probably mixes and combines with our electrically charged planet's own, immense EM-field. By describing how his pendulum goes crazy over objects composed of a specifically calibrated/targeted matter, Lethbridge shows there is strong interaction between the human bio-electric (psychic) fields and the EM fields of objects.
Imagine larger space rocks containing metals and water and probably charged with electricity, how big their cone-shaped - oblong - EM fields must be in both directions of their movement. When they zip by, relatively close to Earth "in large EM-distances" - but still far away by our human measurements, as we measure how long a street or a city is. So the two immense EM-fields crash into each other in space... but these fields are connected to their emitters, the asteroid and Earth+humanity, all connecting, how strong that crash must interact with us - already from afar, since the asteroid's extended EM-field touches our planet's EM field way-way ahead of any atmospheric contact. Here, I made a diagram, using Lethbridge's illustration:
 

Attachments

  • EM fields crashing.png
    EM fields crashing.png
    383.4 KB · Views: 15
Last edited:
I just had a short glance at the most up to date NASA raw data and since I‘ve created the table and graphs above at least three more NEOs (all new discoveries I presume from that glance) have slipped by earth. All of those came a good deal closer to earth than 0.50 LD with the closest one slipping by at 0.36 LD. Obviously I‘ll update all the above data accordingly in intervals in the future. If it continues like that, 2019 will probably beat 2018 in the all time high.

Just did a more thorough check. Since the creation of the table and graphs above a total of 3 more NEO‘s have come closer to earth than the moon. + Another one was added that made its close approach at the end of October. So, four additional ones in total. With this we have officially reached the mark of 600 objects of this kind that have been discovered since the first observation of such close NEO‘s (less than 1 LD) in 1991. With this we are 2 objects away from the record year 2018 in terms of discovered objects of that kind. And we still have over 1.5 months to go in this year. Towards the end of this or start of next year I‘ll update the table and graphs accordingly.
 
Last edited:
Back
Top Bottom