The Ice Age Cometh! Forget Global Warming!

The above site from the Ice Age Farmer wiki, there is a great resource called Strategic Relocation which consists of a pretty large set of maps.

It is full of maps detailing historical risk factors, such as fires, volcanoes, seismic activity, ice sheet extent etc. It also has maps for water resources available. It might be a useful site to check out if you thinking about relocating. The following gives a list of the maps:

One of the maps caught my eye, which was the volcanic hazard map of America based on the last 15000 years.

volcano.gif


In a recent session the C's mentioned that California would soon be hell. That can of course mean many things as hell can be many things. Living in a postmodernist SJW state for example can without doubt be considered as hell.

A seismic map gives another view which is not favorable to California:

800px-MAP_-_USA_Earthquake_Hazard_Map_%28USGS%2C_2014%29.jpg


Wildfire activity from 1994-2013 in the US tells again a story:
servlet.FileDownload
 
Found a map of the temperature anomalies for February 2019 from Maps of monthly means and anomalies of meteorological values over the Northern hemisphere for the previous month Over all warmer, though some spots like the western US and Canada including part of the Pacific ocean were colder. In the US areas respectively warmer and colder than usual were close to each other. This would favour more precipitation like in the form of snow. It is going to be interesting to see what it will look like on the map that will show the month of March.

29630
The following is showing anomalies in the air temperature at the 500 mb level:
29631
The layout of these maps is different from what I'm used to, perhaps one can learn something by following the trends month after month.
 
Regarding NASA and their possible manipulation of data there is this post: Fabricating A Warming: NASA Now Altering ‘Unadjusted” Data To Create New, Warmer ‘Unadjusted’ Data

By P Gosselin on 31. March 2019

By Kirye
and Pierre Gosselin

One fellow climate blogger recently wrote on how he’s been been looking at GHCN ‘unadjusted’ data and noticed that scientists at NASA appear to have been altering them: “This is a fairly disturbing development,” he wrote.
Heating up Reykjavik and Nuuk
Cited as an example is Reykyavik, Iceland. According to Tony Heller here, “The current version V4 has massively cooled the past, to make it look like Iceland is warming.”
Heller then posted a chart showing the difference between v2 unadjusted and the new v4 ‘unadjusted’ for the Reykjavik station:

Spreadsheet
Heller also found here that the same appears to be the case for Nuuk, Greenland as well.

Hachijojima, Japan
With this in mind, we checked the Japanese station Hachijojima, which is situated on a small island in the Pacific well off the coast of Japan. Also here we see that the unadjusted data have been altered, too. The original v3 data depicted by the green curve are compared to the new “unadjusted” v4 data shown by the blue curve:

Data source: https://data.giss.nasa.gov/cgi-bin/gistemp/stdata_show.cgi?id=210476780000&dt=1&ds=7 … and https://data.giss.nasa.gov/cgi-bin/gistemp/stdata_show_v4.cgi?id=JAXLT529315&ds=15&dt=1 …
The new “unadjusted” v4 data have been clearly altered to cool a part of the past and thus enhance the appearance of warming. There appears to be a system behind all the adjustments: Every time the adjustments create more warming.

Antarctica
We also checked over the NASA GISS UHCN data for Syowa, Antarctica:

GHCN V3 Unadjusted: https://data.giss.nasa.gov/cgi-bin/gistemp/stdata_show.cgi?id=700895320008&dt=1&ds=7 … GHCN V4 Unadjusted: https://data.giss.nasa.gov/cgi-bin/gistemp/stdata_show_v4.cgi?id=AYM00089532&dt=1&ds=15 …
Also see an animated comparison here. Here as well we see that the data have been altered.

Edinburgh
The same is found in Edinburgh, Scotland as well:

Edinburgh(Airport GHCN V3 Unadjusted: https://data.giss.nasa.gov/cgi-bin/gistemp/stdata_show.cgi?id=651031600000&ds=7&dt=1 … / GHCN V4 Unadjusted: https://data.giss.nasa.gov/cgi-bin/gistemp/stdata_show_v4.cgi?id=UKXLT476306&ds=15&dt=1 …
Obviously the history contradicts the global warming theory, and so a group of activist scientists at NASA GISS have taken it upon themselves to rewrite it.
 
A few year ago, the following researchers: Robert Twardosz from Institute of Geography and Spatial Management Jagiellonian University Krakow Poland and Urszula Kossowska-Cezak from Department of Climatology, Faculty of Geography and Regional Studies Warsaw University Warsaw Poland, published a study in: Theoretical and Applied Climatology July 2016, Volume 125, Issue 1–2, pp 399–411| Cite as Exceptionally cold and mild winters in Europe (1951–2010). The abstract reads:
Extreme thermal conditions appear to occupy an important place among research subjects at a time of climate warming. This study investigates the frequency, duration and spatial extent of thermally anomalous winters in Europe during the 60 years between 1951 and 2010. Exceptionally cold winters (ECWs) and exceptionally mild winters (EMWs) were identified using the statistical criterion of plus/minus two standard deviations from the long-term winter temperature (January–December) recorded at 60 weather stations. It was demonstrated that ECWs have occurred more frequently and covered larger territories than EMWs and that they may occur anywhere in Europe, while EMWs were limited to its southern and western parts. ECWs are characterised by greater absolute temperature anomalies, as anomalies greater than |6.0 °C| account for 35 % of ECWs, but only for 8 % of EMWs. The greatest anomalies are found in the east of the continent. The largest territory affected by an ECW included 24 stations in 1962/1963, while the equivalent among the EMWs included 11 stations in 2006/2007. The study also confirmed an expected trend whereby ECWs diminished in frequency in favour of EMWs in the second half of the 60-year study period.
The idea for their study is a review of historical records of the past several hundred years:
[QUOTE]In the temperate climate zone, which covers most of the European continent, winter has the most variable thermal conditions of all the seasons. These are the result of the typical pattern of atmospheric circulation dominant at the time, which alternates between air mass advection from over the Atlantic Ocean, which favours mild winters, and a build-up of stationary high pressure systems that block such advection and allow inflow of cold air from the north or east and lead to very low temperatures and very cold winters (e.g. Kossowska-Cezak 1997; Jaagus 2006; Bardin 2007; Ugryumov and Khar’kova 2008; Van den Besselaar et al. 2010). The occurrence of such severe winters, as well as shorter winter spells with very low temperatures and, to a lesser extent of very mild winter seasons, has long been the object of universal attention as they have affected all the populations of the territories in question and have had a multifaceted influence on their lives (Błażejczyk and McGregor 2007; Maignan et al. 2008).

Accounts of such exceptional winters can be found in historic chronicles. A study by R. Girguś and W. Strupczewski (Wyjątki…, 1965) offers valuable information in this respect, including the following examples:
In the year of our Lord 1076, a very severe winter befell the lands and their largest rivers, such as the Saone, Rhone, Rhine and Loire in Gaul; the Elbe, Vistula and Danube in Germania; and the Po in Italia which were seized by ice so strong that they fell silent immediately after the smaller ones and the astounded local population went over them as if on solid ground (Wyjątki…, 1965, p. 17).
The winter [1306] was so severe that between the Danish mainland, its islands and Sweden all the seas turned into permanent bridges for fourteen weeks and even longer (Wyjątki…, 1965, p. 26).
The winter of 1322/1323:
Also between Norway, England and France many ships were caught by ice in the open seas, so that merchants walked on the ice to pay visits to each other for entertainment” (Wyjątki…, 1965, p. 30).
On the following page:
During the time between St. Andrew’s Day [30 November 1322] and Laetare Sunday [6 March 1323], the weather was so cold that merchants carried their goods on carts across the sea from Norway to Sweden and back and there were inns and taverns on the seas where they consumed their beer and food. Also merchants visited from ports in Prussia and Livonia and there were also taverns in the marketplace (Wyjątki…, 1965, p. 31).
Late that year (1556) and at the beginning of the following one, winter [in Poland] was very persistent: great snows and severe colds lasted from St. Hedwig’s Day [15 October] without a break until Annunciation Day [25 March] (Wyjątki…, 1965, p. 146).

Mild winters were much rarer:
Winter of that year [1412] was exceptionally warm without ground frost or any frost in general to the extent that even in Lithuania, a cold and frosty land, people already had vegetables to eat and flowers around Presentation Day [2 February], which was regarded as a great wonder and a veritable miracle (Wyjątki…, 1965, p. 41).
In that year [1493], the winter in January and February was so mild that trees blossomed in orchards, grass grew tall, birds nested, but in March frost destroyed everything (Wyjątki…, 1965, p. 85–86).
These are just a sample of numerous accounts of particularly severe winter seasons, which ceased to occur in Europe due to the period of climate-warming observed since the mid-nineteenth century. Nevertheless, anomalously cold winters still occur with serious consequences ranging from affecting daily life, disorganising the economy to even influencing historic events, such as a series of three exceptionally cold winters during the Second World War. In this last example, in January 1942, the temperature in the war zone in Russia dropped to −56 °C (Brönnimann 2005). On the other hand, exceptionally mild winters can also have adverse effects as they disturb the cycle of natural processes (Maignan et al. 2008).[/QUOTE]
After the introduction they move to their research hypothesis:
This study pursues this still current topic and focuses on the frequency, duration and spatial extent of anomalous winter seasons in Europe between the mid-twentieth century and 2010.

The research hypothesis adopted here proposes that the observed increase in winter temperature is expressed by a decline of the frequency of ECWs and an increase in the frequency of EMWs. This paper continues from previous studies by the authors (Twardosz and Kossowska-Cezak 2013a, b, 2015a, b) on exceptionally hot and cold summer seasons in Europe. The intention is to provide comprehensive understanding of thermal anomalies in winter using a single method of their identification, long-term observation data and covering the whole of Europe, as opposed to a wide body of fragmented research targeting different areas and periods (e.g. Baur 1954; Graham et al. 2006; Hirschi and Sinha 2007; Hirschi 2008; Cattiaux et al. 2010; Wang et al. 2010; Ouzeau et al. 2011; Buchan et al. 2014).
Their conclusions include:
1. ECWs are more frequent across Europe, while EMWs appear only in the south and west of the continent (they were only recorded by half of the stations).
2. ECWs are recorded more frequently than EMWs—18 and 13 winters respectively in the 60 years.
3. In extreme cases, ECWs cover larger areas than EMWs. Even though a high proportion of anomalous winters are recorded by one or two stations (out of the 60 stations)—this applies to 7 out of 18 ECWs and 7 out of 13 EMWs—the number of anomalous winters recorded by at least 6 stations (i.e. 10 % of the stations) was 7 and 2, respectively, with the most extensive ECW covering 24 stations, while for EMW it was only 11 stations.
4. ECWs are characterised by the greatest absolute temperature anomalies: anomalies up to −3.0 °C apply to 21 % of the cases, and those exceeding −6.0 °C to 35 %, while for EMWs, anomalies up to +3.0 °C represent 68 % of the cases and those exceeding +6.0 °C only 8 %.
5. A vast majority of the ECWs (82.5 %) were characterised by at least one exceptionally cold month, and in extreme cases, as many as three winter months are ECMs (5 cases). During the EMWs, EMMs were less frequent (62.5 %) and were recorded exclusively by a single station (there were only five cases of EMWs with two EMMs and only in the southernmost parts of Europe).
6. The above comparison indicates that the numerous historical accounts of very severe winters and few accounts of mild winters are not accidental but rather indicative, among other things, of a significant characteristic of Europe’s current climate. Even though the second half of the six decades saw fewer ECWs and more EMWs (1951/1952–1979/1980: 11 ECWs, 3 EMWs, 1980/1981–2009/2010: 7 and 10, respectively), one may always expect spells of temperature well below zero, short or long lasting, notably in the east and north of the continent. This results from the nature of the circulation of air over Europe which is dominated by advection of warm air masses from over the Atlantic, with intermittent periodic blocks causing the forced descent of cold Arctic or continental polar air from the north or the east (positive or negative NAO phase). In addition, the prolonged presence of high-pressure systems in winter time contributes to further radiative cooling of the air during long cloudless winter nights (especially in the north). This pattern is confirmed by an increased frequency of ECWs in the early part of the study period when the negative NAO phase was also more frequent (Hurrell and National Center for Atmospheric Research Staff 2014).
7. In the light of the authors’ previous study on exceptionally hot and cool summers (Twardosz and Kossowska-Cezak 2015b) exceptionally cold winters occurred less frequently than exceptionally hot summers (18 vs. 24 over the 60-year period), but on average covered larger areas (6 vs. 4 stations; exceptionally mild winters and exceptionally cool summers accounted for 3 each). In the second half of the 60-year period, exceptionally cold winters became increasingly rare and their spatial coverage began to shrink, as opposed to exceptionally hot summers, which recorded gains in both frequency and spatial coverage.
I find this study rather interesting. It shows that although the exceptionally cold winters became more rare in the second half, of the 60 year period, that would mean from 1981 until 2010, over all if it gets really cold in Europe then it is more difficult to shake it off again. In a parallel manner, ice ages tend to last longer than the interglacial periods, one of which we live in at present.
 
Below is a Russian analysis of the monthly anomalies: Карты среднемесячных значений и аномалий метеовеличин по Северному полушарию за прошедший месяц Apparently North America has been slightly colder and the Arctic mostly warmer.
29666

Compared to a map of the anomalies of the surface air pressure, there has also been lower air pressures than normal over the Northern areas:
29667
A lower than usual pressure over the Arctic might have helped to move in cold, but relatively warmer air from the South.
 
Was reading from mainstream on how (it was suggested) it is now the warmest in the Arctic that it has been for 10,000 years - oh, and not reported was this (and a million other things):

Inconvenient stumps

Anthony Watts / 8 hours ago April 12, 2019


Climate alarmists tell us that the Earth has never been warmer, and that we can tell by looking at tree rings, treelines, and other proxy indicators of climate.
mann-tree-rings-572x720.jpg

Climate scientists claim the warmth is unprecedented.
hockey_stick_chart_ipcc_large1.png

We’ve been told it is warming so fast, we have only 12 years left!
12-years-cnn-720x457.png

Yet nature seems to not be paying attention to such pronouncements, as this discovery shows.
tree-stump-climate.jpg

This photo shows a tree stump of White Spruce that was radiocarbon dated at 5000 years old. It was located 100 km north of the current tree line in extreme Northwest Canada.
The area is now frozen tundra, but it was once warm enough to support significant tree growth like this.
If climate was this warm in the past, how did that happen before we started using the fossil fuels that supposedly made our current climate unprecedentedly warm?
 
This is old - from November 2018, and if people don't know who Mark Carney is, he is the Gov-Bank of England (ex-Bank of Canada Gov) and now a UK citizen. And in this G20 fireside camera talk, the two were chatting and congratulating each other. What was interesting were Carney's brief words on Climate Change to one of the Global cheerleaders - related to the wheels of banking being at the ready, ready to demand 'disclosure' from the private sector (any quote errors are my transcribing).

Justin Trudeau meets with Mark Carney
Prime Minister Justin Trudeau met with Bank of England governor Mark Carney at the G20 summit in Buenos Aires, Argentina on Friday.
Nov 30, 2018, 6:42 PM


Mark Carney - "Well Prime Minister it is always a pleasure to see you and I want to commend you today, especially on the signing of the Canada Mexican US trade agreement; I believe, I believe its called, but also on your leadership, your leadership on the issues on financial stability, and thinking ahead about how we use a more stable financial system to help all of our economies; small businesses, cross border businesses, ah, and your leadership on climate change as well, and I think its, as you know, the initiatives of the Canadian G7 is there has now been a Quantium leap in terms of the size of financial firms that want the disclosure from private companies, ah, about how they are managing climate risk and seasoned opportunities in the transition to a low carbon economy and your leadership in the G7 has been tabled (tailored) to that, and I think when we all sit down tomorrow with the G20 and talk about climate it will be a very private sector orientated conversation, because the building blocks are in place."

Justin Trudeau meets with Mark Carney
https://toronto.citynews.ca/video/2018/11/30/justin-trudeau-meets-with-mark-carney/

Indeed, the 'blocks' are in place and there is no going back as their cards are committed in play and fully on the table. Truth of these matters means nothing to them, as is known. There is no conversation a person can have these day (although individuals are starting to question the narratives) without being dismissed out of hand. Whatever the case, there was a great deal of nodding by Justin hearing all those favorable words coming from Carney.

Rolling ahead five months, things are ramping up generally unopposed.
 
They say that end of April had the lowest sea ice cover measured:
But some places are actually cool, like Grande Reviere in Quebec, where the old May record of -14.4 was beaten as it now stands as -22.6 and this is also 10 days later than the previous record for measuring anything below - 20 C.
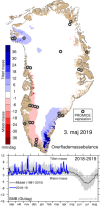
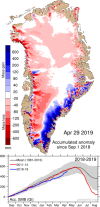
Attached are a couple of maps of Greenland from Polarportal.dk One shows the snow melt or gain on May 4, the other the alleged accumulation, which shows Greenland had more snow at the end of the season.
 

Attachments

  • 1556970323980.png
    1556970323980.png
    119.7 KB · Views: 4
  • 1556970424110.png
    1556970424110.png
    177.8 KB · Views: 4

Winter makes a comeback in the Northeast, bringing snow and record-breaking cold
May 15, 2019 Snip of a 10-13 minute Read:
A winterlike weather pattern moved over the northeastern United States early this week, bringing with cooler conditions, rain and even snow in several northern locations.

Many living in the Northeast experienced lower-than-average temperatures on Monday. A low temperature of 42 degrees Fahrenheit was recorded in New York City's Central Park, according to the National Weather Service. This temperature fell 3 degrees shy of the all-time low for May 13: 39 F set in 1895.

But the all-time low high temperature of 49 F for May 13, set way back in 1914, was shattered on Monday when the mercury in Central Park only climbed to 48 F. Temperatures on Monday in the Big Apple were about 15-20 degrees below average

About 6 to 8 inches of snow blanketed Killington and Mount Snow in Vermont, estimates AccuWeather Meteorologist and Social Media Manager Jesse Ferrell. This snowfall will help the Killington Ski Resort remain in operation.

"Killington's season is still going strong on limited terrain," said AccuWeather Broadcast Meteorologist Brittany Boyer. "They are closed during the week but they reopen on weekends. They have been open 200-plus days this season. They are trying to make it to June."
Killington provides live webcams on its website that allow users to view the current conditions.


Curious, they don't know how to explain what they didn't expect to find with their research, that the glacier is thickening.

https://m.esa.int/Our_Activities/Observing_the_Earth/Space_for_our_climate/Jakobshavn_Isbrae_Glacier_bucks_the_trend said:
JAKOBSHAVN ISBRAE GLACIER BUCKS THE TREND

Our planet works in mysterious ways. We are all used to hearing about the world’s ice being the first casualty of climate change and, indeed, it is declining fast. However, recent findings show that one glacier is not conforming to the norm – it’s actually been flowing more slowly and getting thicker.

In recent years, Greenland has been losing more ice through the Jakobshavn Isbrae Glacier than from anywhere else on this huge ice sheet.

Various types of satellite data have been used to understand and monitor the glacier’s flow over the last 20 years, in particular, through ESA’s Climate Change Initiative. This revealed that the glacier was flowing at its fastest and losing the most ice in 2012–13. In places, the main trunk of the glacier was deflating by 10 m a year as it adjusted dynamically to ice loss and melting.

Complementary information from the European Commission’s Copernicus Sentinel-1 radar mission and Sentinel-2 optical mission along with ESA’s CryoSat satellite are currently being used to keep a close eye on this critical glacier.

30237
In particular, scientists are applying a new swath processing technique to CryoSat’s altimeter data. This differs from conventional radar altimetry so that broad swaths, rather than single points, of elevations can be computed – yielding better detail on glacial change.

This new high-resolution dataset has revealed that, between 2013 and 2017, the ice at terminus of the glacier stopped decreasing in height, and started to thicken. The overall effect is that Jakobshavn Isbrae is now flowing more slowly, thickening, and advancing toward the ocean instead of retreating farther inland.

Even so, the glacier’s drainage basin as a whole is still losing more ice to the ocean than it gains as snowfall, therefore still contributing to global sea-level rise, albeit at a slower rate.

Scientists are discussing this phenomenon at this week’s Living Planet Symposium in Milan. Anna Hogg, researcher in the Centre for Polar Observation and Modelling at the University of Leeds in the UK, said, “The dynamic speedup of Jakobshavn Isbrae observed from the late 2000’s to 2013 was triggered by warm ocean waters in Disko Bay, entering Jakobshavn Fjord and melting ice at the glacier terminus.

“In recent years, however, temperature measurements show that ocean water in Disko Bay has experienced a series of cooler years – more than one degree lower than mean temperature previously observed. This has reduced the rate of ice melt on Jakobshavn Isbrae.”

However, glaciers interact with both the ocean and the atmosphere. Following the extreme surface melt event across the whole of Greenland in 2012, the ice sheet experienced very low levels of surface melt the following year.

Research suggests that it is the complex interaction of both ocean and atmospheric forcing that have driven the changes on this glacier.

Dr Hogg added, “The key question we need to answer now is whether the slowdown of Jakobshavn Isbrae just a pause, or is it more permanent? We will use ESA satellite observations combined with models to monitor change and predict this colossal glacier’s future evolution.”

ESA’s Mark Drinkwater noted, “The balance of the cryosphere is clearly delicate, and we see large seasonal and year-to-year variability in the dynamics of the Jakobshavn Isbrae Glacier, which can easily hide the longer-term climate trend in ice loss.

“Further data is needed on the regional influence of ocean temperatures on tidewater glaciers in Greenland to better understand to what extent this process influences regional ice-mass losses.”
...
 
The media is absolutely clueless about the direction and implications of climate change. Here's a recent example:

Climate change to make Earth spin FASTER and create POWERFUL storms
.

The article is bonkers because the Earth isn't actually warming up, but instead it's been cooling slightly for about 20 years and will be cooling more for approximately 10 to 50 years or thereabouts. Or possibly longer.

However, because the Earth is cooling its rotation will speed up some, whereas it wouldn't really speed up if the Earth was actually warming.

If the Earth was warming, the polar ice caps would melt, as the article says, but that would move water mass outward, from the poles to the equator, which would slow the Earth's rotation slightly.

Instead, since the Earth is cooling, that will move water mass towards the poles, into the ice caps, creating the spinning ice skater effect, thus slightly increasing the speed of Earth's rotation.

Thus we can expect to see negative leap seconds for awhile.
 
Back
Top Bottom