I have a question. C mentioned 1000 yrs of transition, is that the length of the mini ice age?
I am not an expert but the cold periods move in cycles like the Dalton minimum 2020!
I have a question. C mentioned 1000 yrs of transition, is that the length of the mini ice age?
What’s Shaping the Weather?
We are currently transitioning from Solar Cycle 24 to Solar Cycle 25. Cycle 24 was the smallest in more than 100 years and possibly the smallest since the Dalton Minimum in the early 1800s, while Cycle 25 is expected to also bring very low solar activity.
Although low levels of solar activity have historically been associated with cooler temperatures, on average, across Earth, we believe that rising temperature trends mean that the winter will not be extremely cold.
For the United States, we predict that recent warming trends will dominate in the eastern and northern parts of the United States in the coming winter, with below-normal average temperatures limited to the western portion of the nation. Most of Canada will have a cold and snowy winter. However, rising temperature trends mean that the winter will not bring extreme cold; instead, it will be closer to normal.
U.S. WINTER WEATHER FORECAST 2020-2021
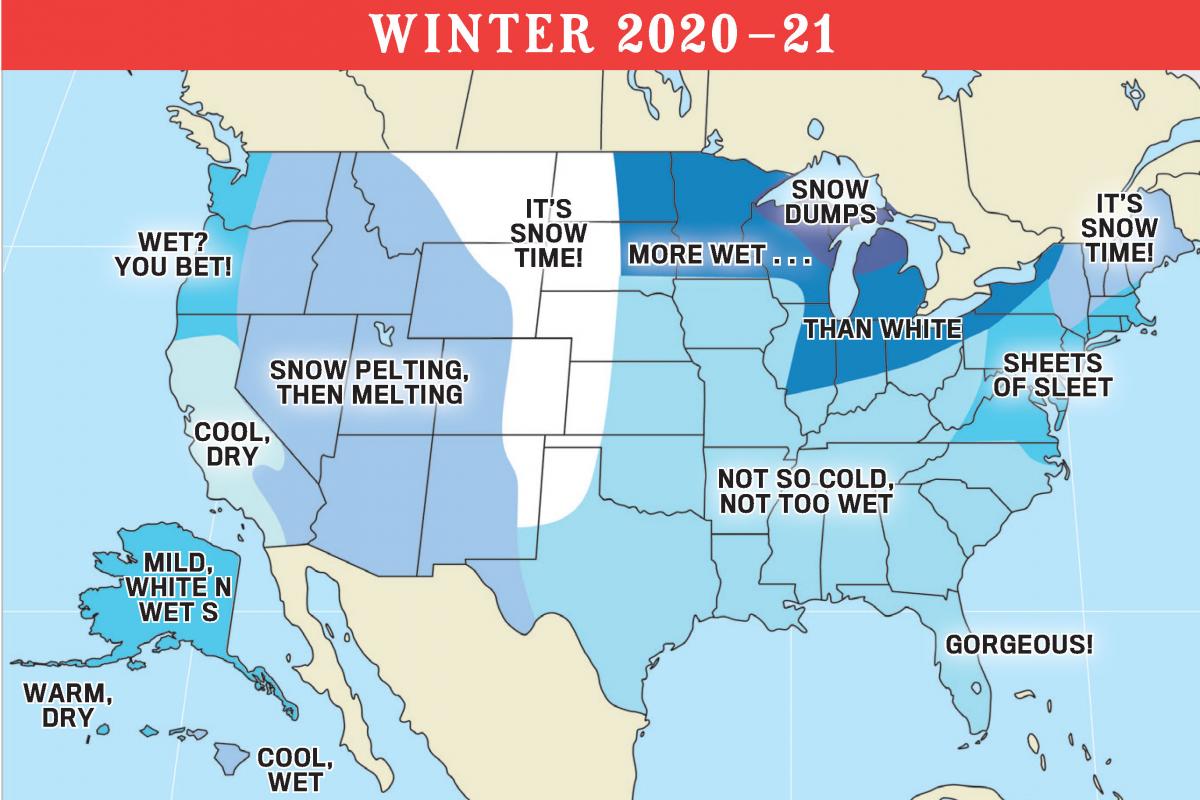
If you were hoping for a reprieve from harsh winter weather this year, we have some news that just might make you smile. We’re predicting a light winter for most of us here in the United States, with warmer-than-normal temperatures in the forecast for a large part of the country.
Uncommonly chilly temperatures will be limited mostly to the western states and northeastern New England. Specifically, winter will be colder than normal in Maine; the Intermountain, Desert Southwest, and Pacific Southwest regions; and eastern Hawaii and above normal elsewhere.
On the precipitation side of things, expect “wet” to be a wintertime constant, with rain or average to below-average snowfall to be the standard throughout most of the country.
Specifically, precipitation will be below normal from Delmarva into North Carolina; in the southern Appalachians, Georgia, and Florida from the Ohio Valley westward to the Pacific and southward to the Gulf and Mexico; and in western Hawaii and above or near normal elsewhere.
Snowfall will be greater than normal in the Northeast, Wisconsin, Upper Michigan, the High Plains, and northern Alaska and below normal in most other areas that receive snow.
Canadian Winter Weather Forecast 2020-2021
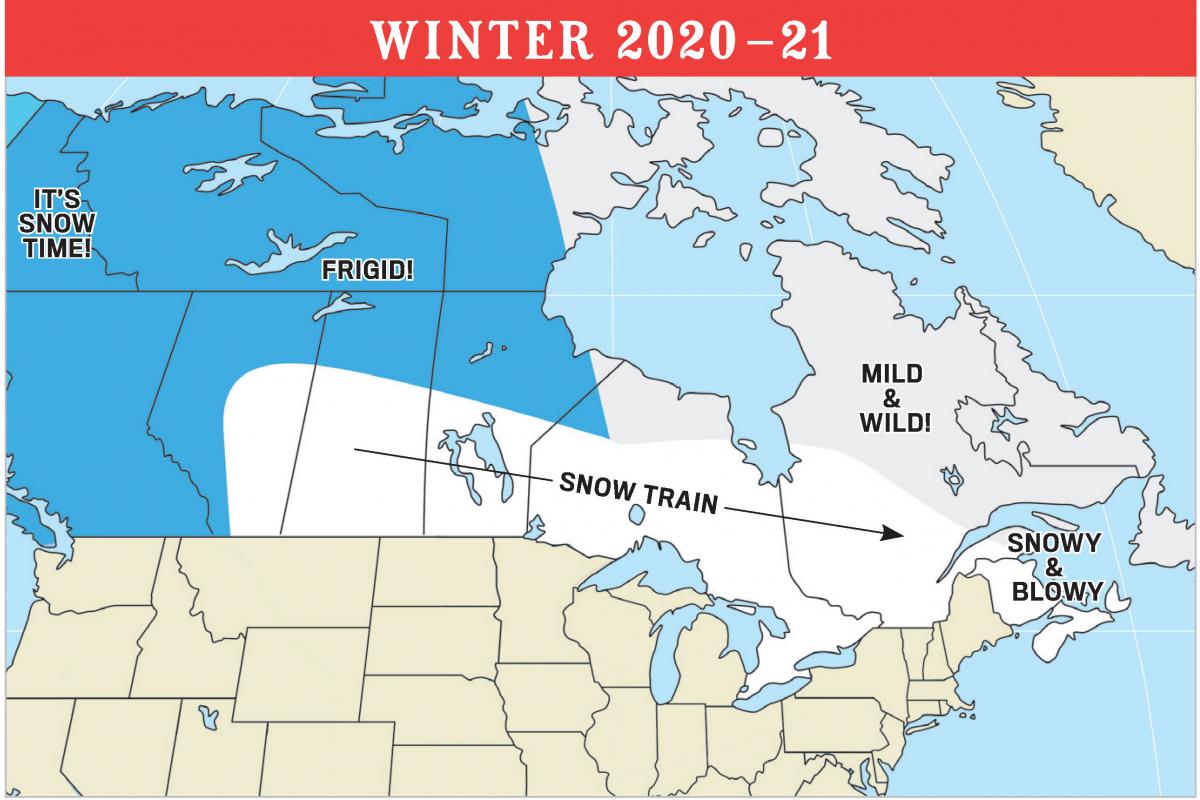
The 2021 Old Farmer’s Almanac Canadian Edition is calling for below-normal winter temperatures through most of the country. However, it’s still winter and expect frigid and frosty weather!
The exception will be in Atlantic Canada and the Prairies, which will experience above-normal temperatures.
Precipitation will be above normal in all of the Commonwealth. Snowfall will be much greater than normal from Quebec westward through most of the Prairies and close to normal elsewhere.
So, while the Atlantic Canada and the Prairies may feel some relief from winter’s chill, they–like the rest of the country—will see lots of rain, snow, and sleet.
Areas from Alberta eastward to Quebec should brace for a virtually continual “Snow Train” that will be carrying a series of winter storms throughout the season.


We are currently transitioning from Solar Cycle 24 to Solar Cycle 25. Cycle 24 was the smallest in more than 100 years and possibly the smallest since the Dalton Minimum in the early 1800s, while Cycle 25 is expected to also bring very low solar activity.
New scientific study finds we could be entering the next Grand Solar Minimum
"Galactic Cosmic Radiation in Interplanetary Space Through a Modern Secular Minimum" is a new paper just published in the journal Space Weather.
The paper's abstract opens with: "Recent solar conditions indicate a persistent decline in solar activity‐‐‐possibly similar to the past solar grand minima. During such periods of low solar activity, the fluxes of galactic cosmic rays (GCRs) increase remarkably..." From here, the researchers' primary focus is on the impact low solar activity and increasing GCRs have on interplanetary space missions (well how else would it have gotten published), however, they do leave a number of GSM truth-bombs along the way, and their conclusion is an admissible one: "GCRs are bad-and they're only going to get worse".
"During the next solar cycle, we could see cosmic ray dose rates increase by as much as 75%," says lead author Fatemeh Rahmanifard of the University of New Hampshire's Space Science Center. This spells bad news for astronauts, limiting the time they can work safely in interplanetary space (from 1000 days back in the 1990s to just 290 days for men and 204 days for women).
Why are cosmic rays growing stronger? "Blame the sun," writes Dr Tony Phillips in his excellent article over at the always excellent spaceweather.com.
The sun's magnetic field wraps the entire solar system in a protective bubble, normally shielding us from cosmic rays. In recent decades, however, that shield has been growing weaker-a result of the sputtering solar cycle.
Solar activity isn't what it used to be, continues Dr Phillips. In the 1950s through 1990s, the sun routinely produced intense Solar Maxima with lots of sunspots and strong solar magnetic fields. Now look at the plot (below). Since the heyday of the late 20th century, the 11-year solar cycle has weakened, and the sun's magnetic field has weakened with it:
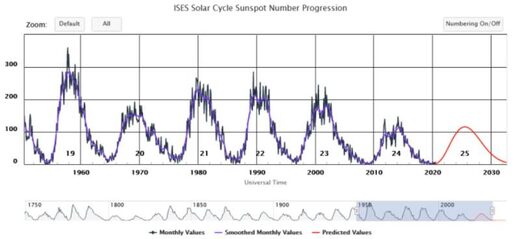
Rahmanifard and colleagues believe we could be entering a Grand Solar Minimum-a long, slow dampening of the 11-year solar cycle, which can suppress sunspot counts for decades and, as concluded by NASA, can results in a sharp cooling of the planet. The most famous example of a Grand Minimum is the Maunder Minimum of the 17th century when sunspots practically vanished for 70 years.
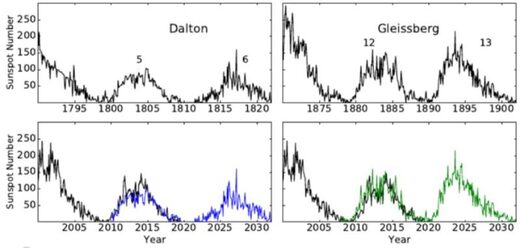
"We are not in a Maunder Minimum," stresses Rahmanifard. "The current situation more closely resembles the Dalton minimum of 1790-1830 or the Gleissberg minimum of 1890-1920." During those lesser Grand Minima, the solar cycle became weak, but didn't completely go away.
Nevertheless, the Dalton still brought-about immense suffering and misery to the people of the time. Like the deeper Maunder and Spörer Minimums preceding it, the Dalton brought on a period of lower-than-average global temperatures. The Oberlach Station in Germany, for example, experienced a 2C decline over 20 years, which devastated the country's food production.
The Year Without a Summer also occurred during the Dalton Minimum, in 1816. It was caused by a combination of already low temperatures plus the aftereffects of the second largest volcanic eruption in 2000 years: Mount Tambora's VEI 7 on April 10, 1815 (for more on the link between reduced solar activity, cosmic rays and volcanic/seismic upticks click here).
One Virginia resident recalled, "In June another snowfall came and folks went sleighing. On July 4, 1816 water froze in cisterns and snow fell again, with Independence Day celebrants moving inside churches where hearth fires warmed things a mite."
Clothes froze on the line in New England, ice on ponds and lakes was reported in northwestern Pennsylvania in both July and August, and Virginia had frosts in August. The temperature occasionally got into the 90s, but then would drop to nearly freezing in just a few hours.
Crops that had managed to sprout were frozen out in early June, replanted, and frozen again in July. Very few crops were actually harvested, and of those that were, the yields were very poor. In turn, food and grain prices skyrocketed — for example, in 1815, oats sold for $0.12 a bushel but by the next year, a bushel would set you back $0.92.
And the story was similar across the world — for more:
NASA PREDICTS NEXT SOLAR CYCLE WILL BE LOWEST IN 200 YEARS (DALTON MINIMUM LEVELS) + THE IMPLICATIONS
In the below plots, Rahmanifard et al compare the Dalton and Gleissberg minima (top panels) to recent solar cycles (bottom panels).
For years, researchers have been monitoring cosmic rays using CRaTER, a sensor orbiting the Moon on board NASA's Lunar Reconnaissance Orbiter (LRO). Recent data show that cosmic rays are at very high levels-the highest since LRO was launched in 2009. (See Figure 1 in their paper.)
"We took the latest readings from CRaTER and extrapolated them forward into Solar Cycle 25 (the next solar cycle)," says Rahmanifard. "We found that radiation doses will probably exceed already-high values by 34% for a Gleissberg-like minimum to 75% for a Dalton-like minimum."
Rahmanifard's paper may primarily focus on the ramifications low solar activity has on interplanetary space missions, but what it also forewarns is that this solar shutdown will extend through solar cycle 25 (at least), and as we know thanks to historical documentation, the 400-year sunspot record, and research at NASA: what that likely means is a return of the COLD TIMES. Exactly how cold (how low we sink) will be determined by the progression of solar cycle 25. Most indicators point to it being substantially lower than even the historically weak solar cycle 24 (just gone)... but only time will tell.
Stay tuned for updates.
The mid-latitudes appear to be REFREEZING in line with historically low solar activity, cloud-nucleating Cosmic Rays, and a meridional jet stream flow.
NASA have said this upcoming solar cycle (25) will be "the weakest of the past 200 years," and the agency have correlated previous solar shutdowns to prolonged periods of global cooling here.
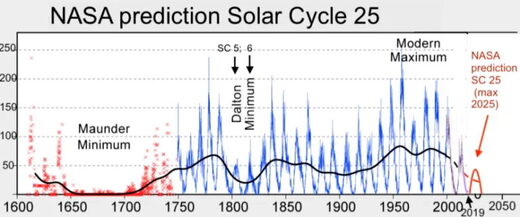
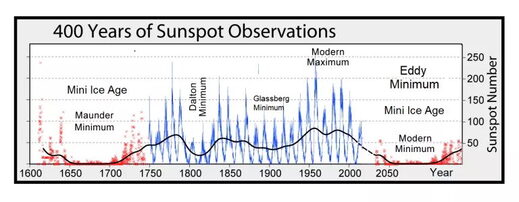
Don't fall for bogus, warm-mongering political agendas.
Prepare for the upcoming solar-driven chill — learn the facts, relocate if need be, and grow your own.
Guest post by David Archibald,
The solar plasma temperature has plunged to a new low for the instrument record. Coincidentally or not, the temperature of the southern hemisphere has also plunged over the last couple of weeks. When do we start worrying?
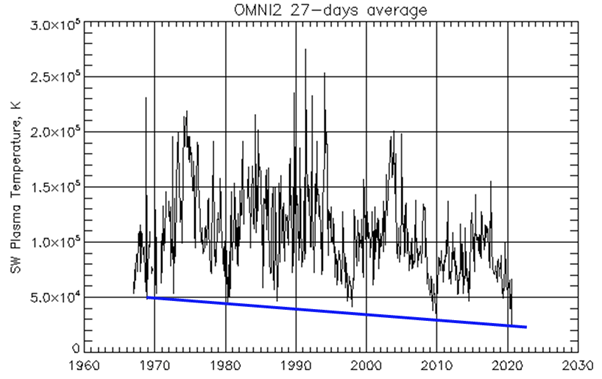
Figure 1: Temperature of the solar wind plasma
As Figure 1 shows, the temperature of the solar wind has hit a new low for the instrument record. As it is energy from the Sun that keeps the Earth from looking like Pluto, the lower plasma temperature indicates that the Sun’s surface is cooling. Surely the Earth’s surface will follow.
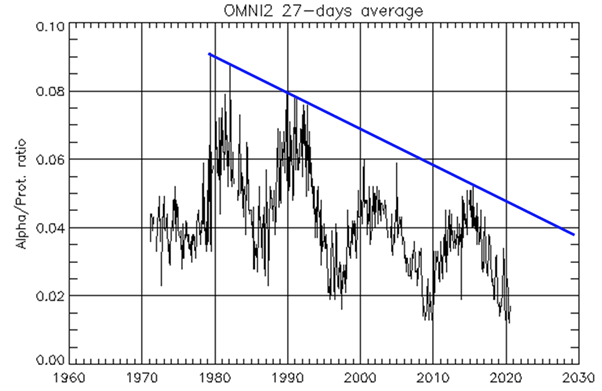
Figure 2: Alpha particle to proton ratio in the solar wind
Similarly the alpha particle to proton ratio has hit a new low for the almost 50 years of the instrument record. The decline for the peak ratio in each solar cycle is even more dramatic. The question that naturally arises is this: Is there a lower bound for this ratio?
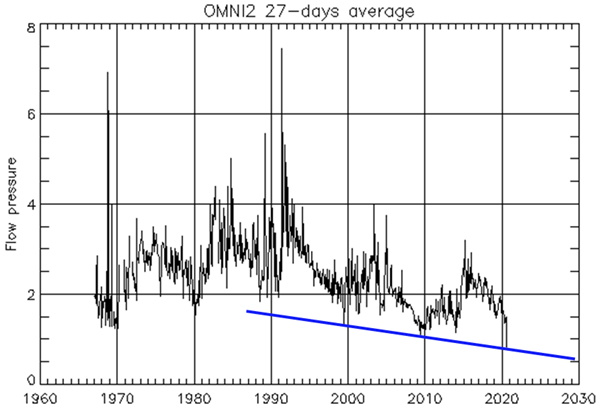
Figure 3: Solar wind flow pressure
Solar wind flow pressure has hit a new low for the instrument record. There a couple of interesting things about this chart. Note that the lows for the last three solar cycles are aligned as indicated by the blue line. This implies that there is a disciplined process involved. Note also the low activity in the late 1960s that set up the 1970s cooling period.
It is the solar wind flow pressure combined with the Sun’s magnetic field that reduces the flux of galactic cosmic rays reaching the Earth. As these two parameters we can expect a spike in the neutron flux about a year from now. In turn that is expected to increase cloud cover and the Earth’s albedo.
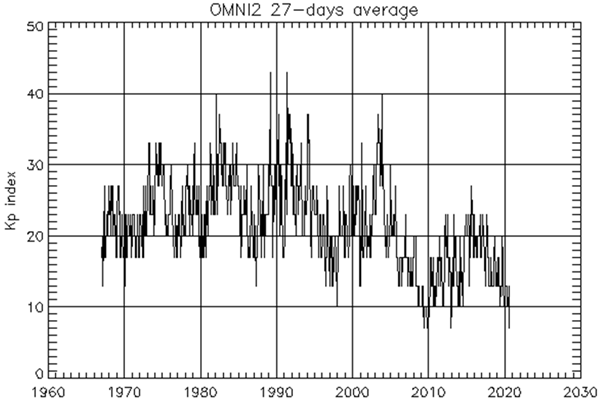
Figure 4: Kp Index
The Kp–index is a global auroral activity indicator on a scale from 0 to 9. What is evident in this graph is the change in regime from the Modern Warm Period that ended in 2006 and the New Cold Period.
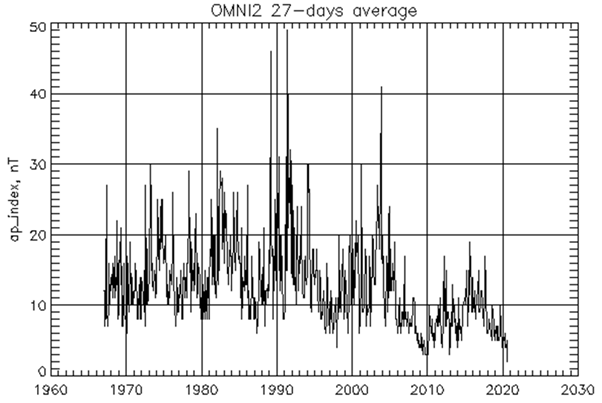
Figure 5: Ap Index 1967 to 2020
According to Omniweb’s data the Ap Index has also hit a new low for its data record.
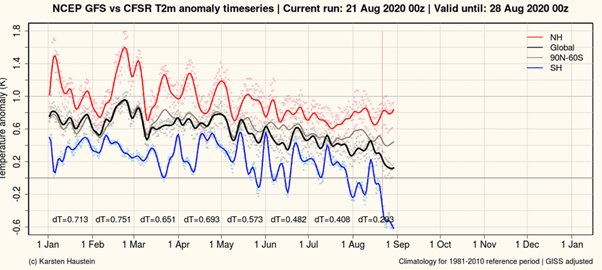
Figure 6: 2 metre temperature anomaly for 2020
Figure 6 is from Oxford academic Karsten Haustein’s website. It is updated daily. It shows that the temperature of the southern hemisphere (the blue line) has plunged 0.6°C in the last couple of weeks and is continuing to plunge. Could it be that the new lows for some solar parameters is having an instant response? The Antarctic plateau is the Earth’s refrigerator.
David Archibald is the author of The Anticancer Garden in Australia.
Wow - That photo is awesome and terrifying!Solar Plasma Temperature is plunging – should we worry?
The following, along with the drama of the current hurricane season in the Atlantic which strongly reminds me of "The Day After Tomorrow", should give us pause to think.
Notice what is said about the Solar Wind Flow Pressure: "As these two parameters we can expect a spike in the neutron flux about a year from now. In turn that is expected to increase cloud cover and the Earth’s albedo."
Could it be that all the Covid nonsense is about this? The onset of an Ice Age?
As Victor Clube pointed out, one needs a Cold War to hide Celestial Intentions... and the whole Covid lockdown is pretty much a "cold war" against humanity.
The photo below: Gulf of Mexico 8/20/2020 - south of Port Fourchon, Louisiana.
View attachment 38513

They are calling the extreme lightning event a Magnetar Burst:What was freaking them out yesterday was a massive up-tick in global extreme lightning events since last year, and they were hypothesizing that if next year has the same level of year-on-year increase, then it is an indicator that we have at most about 10 years before the magnetic field collapses...
Professor Valentina Zharkova: "We entered the 'modern' Grand Solar Minimum on June 8, 2020"
A new editorial paper has landed from professor Valentina Zharkova, entitled: "Modern Grand Solar Minimum will Lead to Terrestrial Cooling". Published on August 4, 2020, Zharkova's latest analysis suggests that June 8, 2020 was the date on which we entered the Modern (Eddy) Grand Solar Minimum.
The opening paragraph reads:
"In this editorial I will demonstrate with newly discovered solar activity proxy-magnetic field that the Sun has entered into the modern Grand Solar Minimum (2020-2053) that will lead to a significant reduction of solar magnetic field and activity like during Maunder minimum leading to noticeable reduction of terrestrial temperature."
Another passage states:
"Currently, the Sun has completed solar cycle 24 - the weakest cycle of the past 100+ years - and in 2020, has started cycle 25. During the periods of low solar activity, such as the modern grand solar minimum, the Sun will often be devoid of sunspots. This is what is observed now at the start of this minimum, because in 2020 the Sun has seen, in total, 115 spotless days (or 78%), meaning 2020 is on track to surpass the space-age record of 281 spotless days (or 77%) observed in 2019. However, the cycle 25 start is still slow in firing active regions and flares, so with every extra day/week/month that passes, the null in solar activity is extended marking a start of grand solar minimum."
What are the consequences for Earth of this decrease of solar activity?
"From 1645 to 1710, the temperatures across much of the Northern Hemisphere of the Earth plunged when the Sun entered a quiet phase now called the Maunder Minimum. This likely occurred because the total solar irradiance was reduced by 0.22%," shown below (top graph); "that led to a decrease of the average terrestrial temperature measured mainly in the Northern hemisphere in Europe by 1.0-1.5°C," also below (bottom graph):
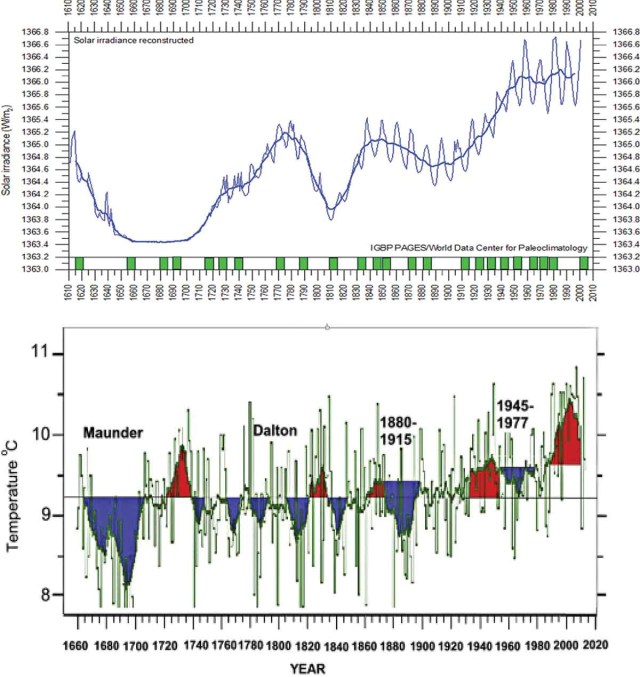
"The surface temperature of the Earth was reduced all over the Globe, especially in the countries of the Northern hemisphere," continues Zharkova's editorial. "Europe and North America went into a deep freeze: alpine glaciers extended over valley farmland; sea ice crept south from the Arctic; Dunab and Thames rivers froze regularly during these years as well as the famous canals in the Netherlands."
Zharkova's latest analysis suggests that a repeat of a Maunder Minimum-style spell of global cooling will run through solar cycles 25-27 (2020-2053). She writes: "Similarly to the Maunder Minimum ... the reduction of solar magnetic field will cause a decrease of solar irradiance by about 0.22% for a duration of three solar cycles (25-27)." Zharkova determines that this drop in TSI (in conjunction with the "often overlooked" role solar background magnetic field plays, as well as with cloud nucleating cosmic rays) will lead to "a drop of the terrestrial temperature by up to 1.0°C from the current temperature during the next three cycles (25-27) ... to only 0.4°C higher than the temperature measured in 1710," with the largest temperature drops arriving "during the local minima between cycles 25−26 and cycles 26-27."
And crucially, Zharkova isn't afraid to lay out the implications of all this.
She concludes:
"The reduction of a terrestrial temperature during the next 30 years can have important implications for different parts of the planet on growing vegetation, agriculture, food supplies, and heating needs in both Northern and Southern hemispheres. This global cooling during the upcoming grand solar minimum (2020-2053) can offset for three decades any signs of global warming and would require inter-government efforts to tackle problems with heat and food supplies for the whole population of the Earth."
Oh, what a rude-awakening all those who have somehow retained faith in the modern climate sciences have in store for them. I have no idea how long their AGW ruse can continue, how long the UHI-effect can prop up those phony global temperature charts — and while all of us are in for a bumpy ride cooling-wise, won't it be fun watching the smug, self-righteous faces of AGW party members drop as their orchestrated religion collapses around them (no doubt there will be a moment of finger pointing and yelps of "I told you so", but then, as is human nature, I will likely offer to share a portion of of my recently harvested fava beans-minus the nice Chianti, that is...).
For Professor Valentina Zharkova's fascinating editorial in full, click here.
The COLD TIMES are returning, the mid-latitudes are REFREEZING; in line with historically low solar activity, cloud-nucleating Cosmic Rays, and a meridional jet stream flow. Even NASA appears to agree, if you read between the lines, with their forecast for this upcoming solar cycle (25) seeing it as "the weakest of the past 200 years," with the agency correlating previous solar shutdowns to prolonged periods of global cooling here.
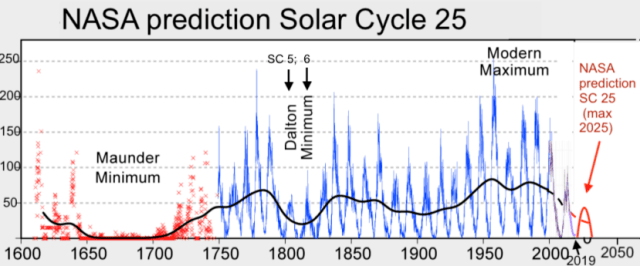
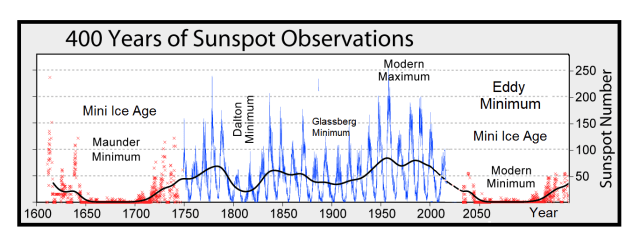
Prepare for the upcoming solar-driven chill — learn the facts, relocate if need be, and grow your own.

