Good day to everyone …
I have an update to present here on the wave structure that can result from the collapse of the Cascadia Fault Line.
View attachment 81512
I was sitting on the coast of northern California recently at the Klamath river in the town of Klamath. It’s pretty there with redwoods and sequoia’s all over the area with the sandy or rocky shoreline of the Pacific Ocean. Our camping site was about 15 feet above sea level which makes me a little hesitant just being there, but I survived. When Cascadia goes off, I’m sorry to say that this whole area is a goner. It gave me a real feel for this upcoming disaster.
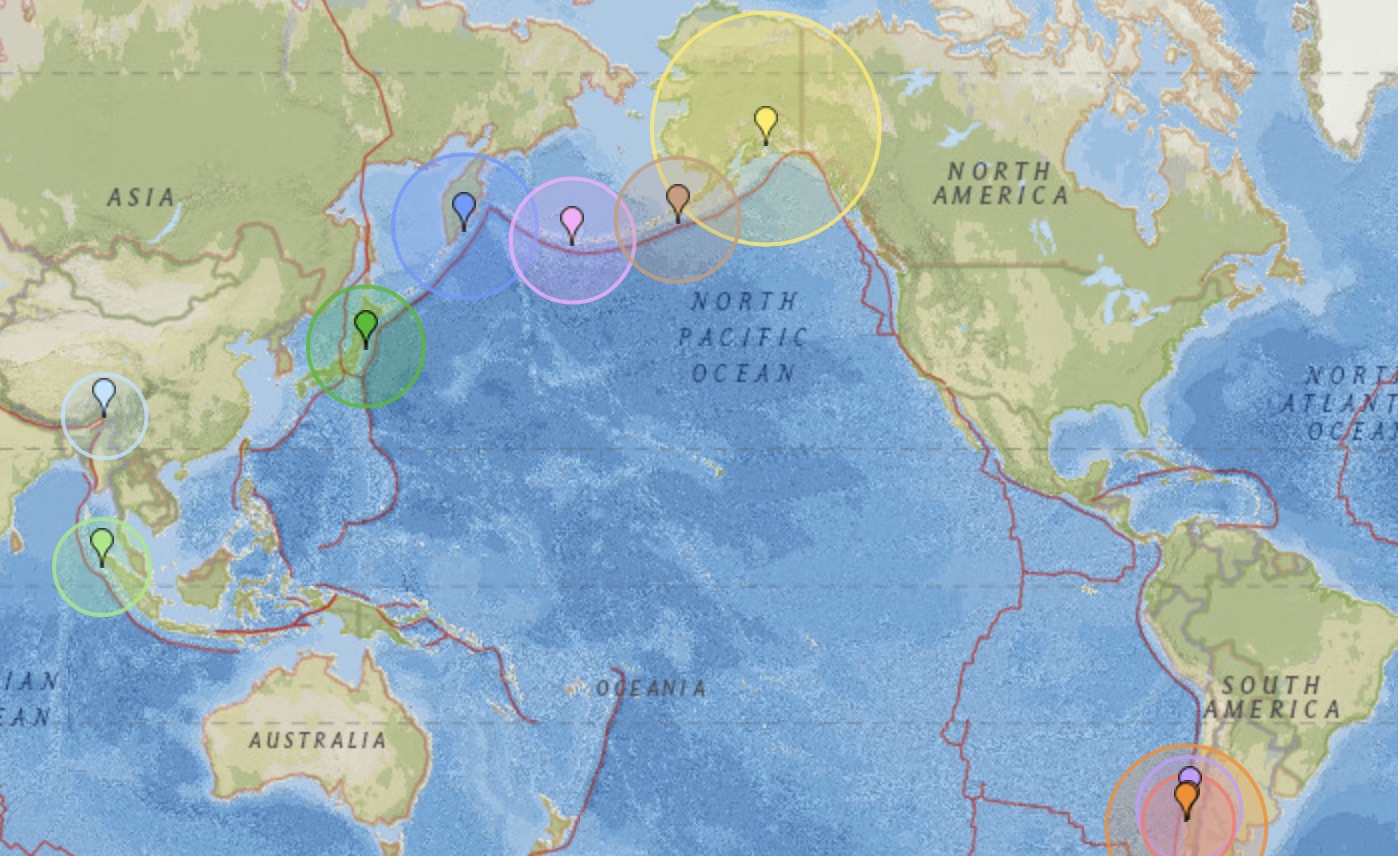
So I shifted gears on this topic to evaluating the wave size and structure that could result from the collapse on this area of concern. The compiled image I have added here shows my estimates of this result. Most of this is estimations that I got from sea elevation data and volumetric reviews. Take it all with a grain of salt.
The black line is a tracing of the fault line from an image.
The red line is the perimeter estimation of the fault line area and the outflow of the water from the initial event. It demonstrates that the southern end of the wave may definitely be five to six time larger than the wave that will hit the northern end, the Canadian coastal areas. This is due to the volumes available. But that is just a start.
The green line showed the volumes of water in the said area in comparison to the total area. As you can see the deepest area is just north of the Oregon/Washington border, a narrower section of the fault area.
The blue line is my estimations of wave height resulting from all this information.
If this is a total collapse then I expect that this has the potential to be a 1000 foot wave ± 20%. But I don’t expect that this will be how it happens. Because of the external shape I figure that the initial wave will be limited due to the eastern and western edges of the fault zone slamming into each other temporarily stopping the collapse. This in effect should truncate the volume of the initial wave to 60% ±20% of its maximum with the largest part of the wave being right at Portland.
Now Portland Oregon may not get directly hit unless there is a great amount of flattening of the coastal range there. But because of the Columbia river, it will be way below sea level for a good day or more. And because the Columbia river extends way inland in Washington, this wave will follow it to somewhere to the middle of the state. Maybe even cutting off the two tallest mountains in the state, Rainer and St. Helens, to islands, we will have to see.
Now I expect that the wave will be proportionally similar to my wave here even it is truncated. So if only 50% of the water is involved in the initial wave that would put it at a 500 foot tall wave with the Columbia river getting only 375 feet of that which should less its trip upstream and lessening the amount of time for it to clear back out to sea. Again this all depends on how much the leveling effect we see from the collapse, mountains a 1000 feet tall may end up only 100 feet tall afterwards, this can change everything.
Lets look at the leveling effect. First thing, ‘It will happen’ to some extent. Mountain ranges all along the western US will flatten so to some degree especially in the zone of concern. Be prepared for this. If you are looking to survive this then think taller rock supported areas that you can quickly get to. But if this doesn’t flatten this area then the problem extends eastward as much of the US will be slipping over to compensate. That could be all the way to the fault zone in the middle of the Atlantic and growing a continent somewhere near Iceland, Iceland could be the northern edge of it then. And interesting thought. If this does happen then expect some turmoil near any caldera, Long Valley or worse Yellowstone.
A wave will be produced a ripple like effect like you would get in a pool from a dropped rock, this one should level out to about 40% of the initial wave height. Hawaii should still see 80% of that and initially hit cities across the oceans might still see 50% of this ripple. The ripple will shrink as it spreads out but you might still see some water level increase in the southern hemisphere from it.
So while I walk Wilson beach looking for that perfect driftwood piece I imagine what would be seen here, it wasn’t pretty. The epitome of the walk came when I found a log buried in the sandy beach. What was showing was a four foot wide visible area on a log some forty feet long. Doing some quick calculations on what I saw, the tree that was buried here was eighteen to twenty feet in diameter with only 10% of it showing above the sand. There’s going to a lot of these when this wave is over …
Haiku …