Thursday, April 9, 2020
COVID-19: Finding the Environmental Trigger
by Jim West
COVID-19 means “coronavirus disease 2019”, and is defined as a flu-like disease caused by a virus (“novel coronavirus” or “COVID-19 virus”). It is the initial trigger and continuing cause of the COVID-19 pandemic.
Possible symptoms are respiratory symptoms, cough, shortness of breath, hypoxia (low oxygen), fever, fatigue, nausea, diarrhea, lung and kidney damage, tremors, and neurological symptoms. [
JASN] [
CDC] [
CNBC] [
Mao 2020]
WHO
declared the pandemic on March 11, 2020.
The 2019–20 coronavirus pandemic is… caused by severe acute respiratory syndrome coronavirus 2 [COVID-19]. The outbreak started in Wuhan, China, in December 2019. The World Health Organization (WHO) declared the outbreak to be… a pandemic on 11 March 2020.[Wiki 4/7/20]
As of 27 April 2020, more than 3.04 million cases have been reported across 185 countries and territories, resulting in more than 211,000 deaths. [
Wiki 4/27/20]
In the United States, the most intense epicenters began in New York State, in the same locations as the record-high measles epidemics that ended just months earlier. Measles is also a flu-like disease. This strongly suggests environmental factors.
[JW 4/2019] [JTA 4/2/20] [LoHud 4/3/20]
• Williamsburg (Brooklyn, NY)
• Borough Park (Brooklyn, NY)
• East Ramapo (Rockland County, NY)
Reality check #1
Some critics doubt the existence of the pandemic, asserting that it is the result of hyped diagnoses of traditional diseases. This may be partially true, however, there is a real pandemic of flu-like diseases.
COVID-19 and other morbidity/mortality is high at the epicenters. This all-cause increase is the actual pandemic and it includes children.
The CDC had to expand its flu-like disease incidence scale, from "1 to 10" to "1 to 13".
The percent of deaths due to pneumonia or influenza (P&I) is high but the increase is due primarily to COVID-19, not influenza. Reported pediatric flu deaths for the season are high at 170. [
CDC 4/25/2020]
All-cause morbidity, in general, is extraordinarily high in the UK for the period of 3/27 to 4/15/2020, according to the Office of National Statistics.
…registered 25,932 additional deaths above the statistical recent 5 year norm. Of these 11,427 recorded COVID-19 as the sole mentioned underlying cause. [
Iain Davis 5/3/2020]
Those "additional deaths" (all-cause), represent a larger unpublicized pandemic. Only 44% of those deaths were recorded as COVID-19. This pandemic is over twice as large as the COVID-19 pandemic.
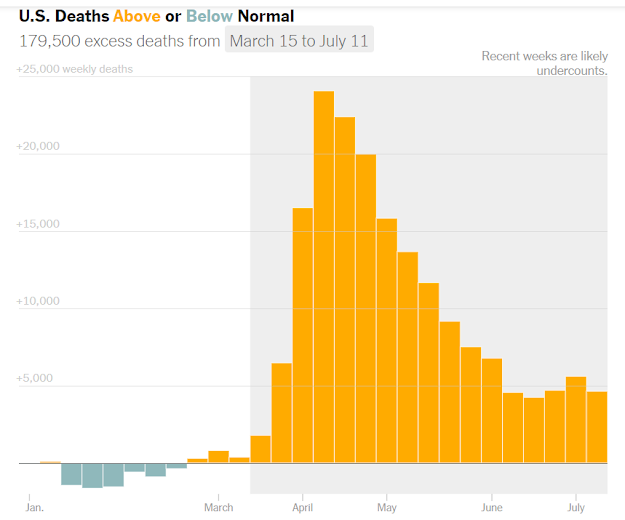
7/22/2020,
NY Times published a graph of excess mortality (COVID-19 and otherwise in the US clearly demonstrates a real pandemic.
 Reality check #2
24/7 political virus drama should be set aside, at least temporarily, to allow this review of the obvious environmental context. There are simple and effective arguments that put virus causation in doubt. Study these prerequisites:
[JW-NV] [DC-Cv8]
Air pollution causation
Many
studies find that air pollution is the primary co-factor with the coronavirus. They stay politically safe by avoiding the short-term environmental trigger (short-term air pollution). They use the terms: "virus", "co-factor", and "long-term air pollution".
A recent Harvard study finds that vulnerables to the "virus" are generated by long-term air pollution.
A small increase in long-term exposure to PM2.5 leads to a large increase in COVID-19 death rate… 1 μg/m3 in PM2.5 is associated with an 8% increase in the COVID-19 death rate.[
Wu_4/5/20]
A study from Tel Aviv University, describes the long-term NO2 air pollution component as a "most important contributor" to the COVID-19 pandemic.
[NO2 (Nitrogen dioxide)] is one of the most obvious contributors to fatality caused by the COVID-19 virus in these regions and maybe across the whole world. [
Ogen_20]
The distinguished medical scientist, Sucharit
Bhakdi, states that virus causation is dubious, the common denominator is "horrid air pollution" and the medical response to the pandemic is “grotesque, absurd and very dangerous.”
7/22/2020,
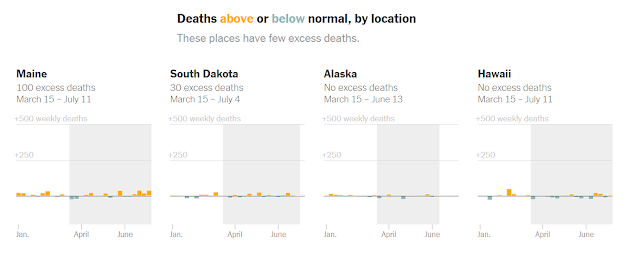
The NY Times lists only four states with no excess mortality. These states have the lowest air pollution in the US.
 Ventilator/drug causation
Some medicos report that ventilators are killing nearly 100% of ICU patients, and that low pressure oxygen should be used as it has a high recovery rate. See "
Undercover Nurse" at the 47:58 minute mark. See
Dr. Sidell.
These deaths would not be an initial trigger for the pandemic, but rather an expansion and dramatization of the epidemic already prepared by chronic air pollution, then triggered by a severe increase in air pollution.
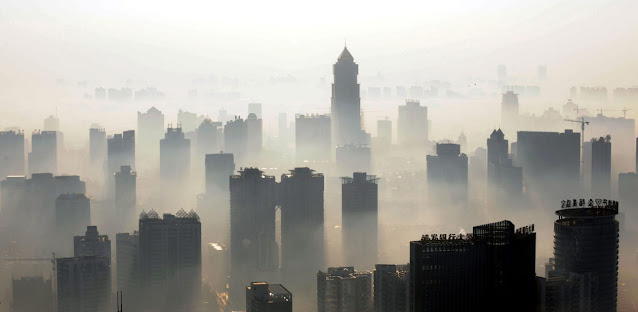
Initial epicenter, Wuhan China
as portrayed by The Guardian (2012), Photo: STR/AFP/Getty
 Incidence table
Thirty-four epicenters are listed, sorted by death incidence. The table reveals that COVID-19 death incidence is proportional to the presence of fracking exhaust and poisoned earth. The major epicenters are at the top: The Tri-State Region (NY/NJ/CT), Louisiana, etc
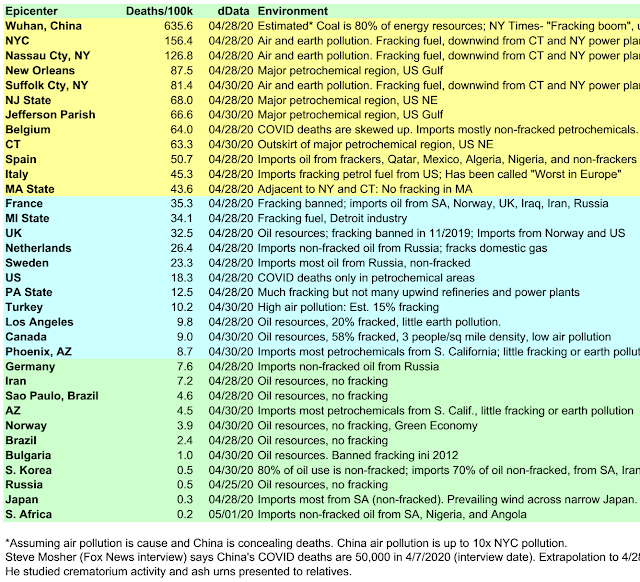
All sides already agree that long-term air pollution is a constant background stressor, a major contributor to the epicenters. By setting aside the virus paradigm, environmental causation can be studied deeper to determine the trigger.
Pandemic trigger
What new pollution triggered the COVID-19 pandemic?
The incidence table indicates some newly increased toxicity with fracked fuel. This increase could be brought about via a change in refinery protocols, coordinated by global agencies. There are rigorous global standards for refinery protocols, and they have dynamic flexibility, as suggested by The International
Regulators Forum, and, The Global Hydrocarbon Supply
Model.
Fracking overview
Fracked fuel is refined from toxic fracked oil, which is pumped out of fracking wells and sent to refineries. At the well, drillers go deep into underground deposits of porous shale rock, which contains kerogen, a hard waxy hydrocarbon. This cannot be dissolved by benzene or alcohol, and is of high melting point.
Deep in the well, the kerogen is attacked with toxic solvents, heat, high pressure fluids, and explosives. This contrasts with conventional “crude oil”, which is also the result of drilling, but with much less use of toxic chemicals and explosives. The liquefied mass of shale oil is pumped to the surface.
Fracked oil is transported to the refinery by pipe or vehicle. During transport, the toxic fracking
chemicals remain with the oil, likely all the oil-miscible chemicals. This is confirmed by the unusual history of fracked oil transport fires, and official cautions about tank corrosion, both of which indicate the presence of toxic chemicals other than just oil.
…PHMSA issued a major safety alert… oil obtained via… fracking… in the Bakken Shale may be more chemically explosive than… admitted publicly. [
Desmog]
Once at the refinery, oil is refined in
three basic stages (covering a possible
18 stages):
1) Distillation separates oil into various products (gasoline, diesel, etc).
2) Heavy residues are converted with high heat and catalysts into light products.
3) Products are treated to remove sulfur and modify product properties.
Postulate (pandemic trigger)
The pandemic trigger was a global decision to allow refineries to release higher levels of cyanide into the atmosphere and into the natural gas fuel stream. Cyanide is normally emitted from refinery converters ("crackers"), because converters generate cyanide from nitrogen compounds present in the oil. However, fracked oil can contain 20x higher levels of nitrogen compounds, and thus the necessity to dump cyanide into the atmosphere and fuel stream is pertinent to fracked oil. This postulate makes sense in terms of the incidence table.
A toxic refinery flowchart
Unmarketable toxic waste accumulates and must be disposed.
The following discussion has an element of conjecture, because refinery and fracking protocols are, in sensitive areas,
hidden and somewhat misinformational.
Toxic fracking chemicalsàInto wellsàOut of wells with oilàTo refineriesà
Refineries, in three basic stages, then separate oil components (including fracking chemicals) via distillation. Heavier oils are converted into lighter products such as gasoline, diesel fuel, etc., via a high temperature, “molecular cracking” process.
àDistillation separates heavy oil into lighter weight productsà
àConverters (“crackers”) break heavy oil into lighter weight productsà
àOptional treatment of productsà
At any stage, products can be deemed toxic waste, and disposed.
àToxic waste>Dumped into air and fuelàToxic air and exhaust
and/or
àNeutralizedàDumped into wastewater
Hydrogen cyanide
Hydrogen
cyanide (HCN), is a highly toxic gas, a refinery waste product. It can cause
symptoms similar if not the same as COVID-19 symptoms, such as coughing, hypoxia, lung and kidney damage.
Cyanide prevents the cells of the body from using oxygen. [
CDC]
The converters generate highly toxic hydrogen cyanide. Some refinery experts claim that the converters completely neutralize the cyanide, however, that claim is dubious because refineries request huge increases of cyanide release limits from gov agencies. These are air release limits.
Because refineries are granted permission to dump nitrogen into the environment, it is safe to assume that the converters are not completely neutralizing cyanide. It is dumped into the environment (
air or
water) and likely into the fuel stream to be burned.
àConverter generates cyanideàDumped into air or fuelà
àFuel burnedàToxic exhaustàAiràLungsàDisease
The converter generates hydrogen cyanide from nitrogen compounds in the fracked oil which is being cracked. The more nitrogen (as is present in fracked oil) the more cyanide.
Shale oil comes from kerogen, a solid waxy hydrocarbon that permeates shale rock. It is liquefied at 575F underground in the well. It innately contains high levels of nitrogen. In the fracking well, shale rock deep underground requires chemicals that contain nitrogen, such as, explosives, nitric acid, amines, foaming agents, etc.
Fracking operations, in the field, do not have the capability to process the retrieved oil, compared to the capability of a refinery. They do not have the ability to remove the nitrogen prior to shipment to the refinery.
It is reasonable to assume that the oil and fracking chemicals stay mixed as they are shipped to the refinery. That must be why fracking tank cars
blow up, wells blow up, pipelines corrode, huge cyanide releases are sought, and the fracking industry is so secretive.
In terms of public health, it would be better to neutralize cyanide in water then release the result into the wastewater stream.
In terms of the petrochemical industrial health, the expense of
neutralization would decrease the ability to compete in the market. Wastewater doesn't go away in the night as quickly as air. It would cost less to dump cyanide into the air or fuel. Refineries are seeking to raise cyanide release limits, so it is reasonable to assume that they would have no problem obeying a global directive that raises these release limits.
The normal refinery processes and dumping would result in normal disease levels. Ease up on the expensive detoxification processes, and marketability rises with disease and death. It is a hard business routine of striking a balance.
Cyanide pollution could be controlled by a three-way valve system implied by this flow chart. Red notes are mine. [adapted from
Bachmann (2014)]
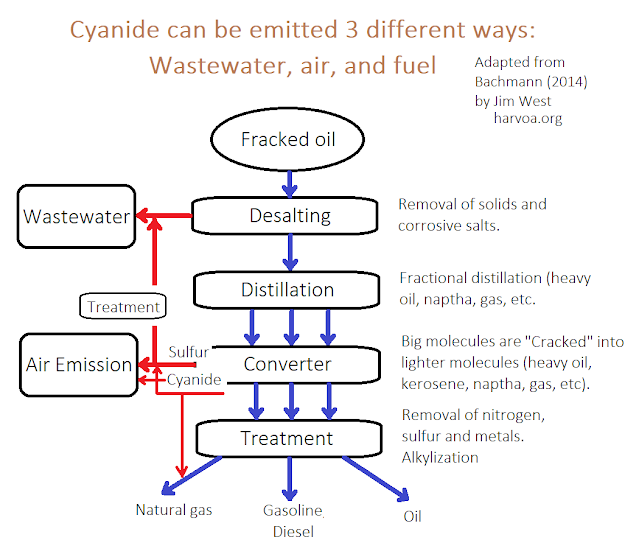
It has come to light over recent years that refineries have far exceeded their regulatory limits for cyanide releases. While ignoring democratic concerns, they have applied for and are receiving extremely high release limits from regulatory commissions.
I. S. Trevino, Esq., of
Earth Justice, May 14, 2019:
…hydrogen cyanide pollution from refineries is poisoning communities nationwide. Yet the EPA has failed to make these refineries clean up their act.
Symptoms of the "virus"
Incorrectly defined COVID-19 disease could prevent it from being perceived as cyanide poisoning.
Dr. Cameron Kyle-Sidell reported his observations of damaged lung membranes for COVID-19 symptoms in his New York City ICU (Intensive Care Unit).
He questions the virus paradigm:
FROM NYC ICU: DOES COVID-19 REALLY CAUSE ARDS??!!
Ventilators were not helping. They were actually damaging the already damaged lungs with air pressure and killing patients. Patients could breath fine (muscles were functioning well) but their lungs could not absorb oxygen efficiently. The disease was incorrectly defined by officials. He suggested low pressure 100% oxygen for hypoxia.
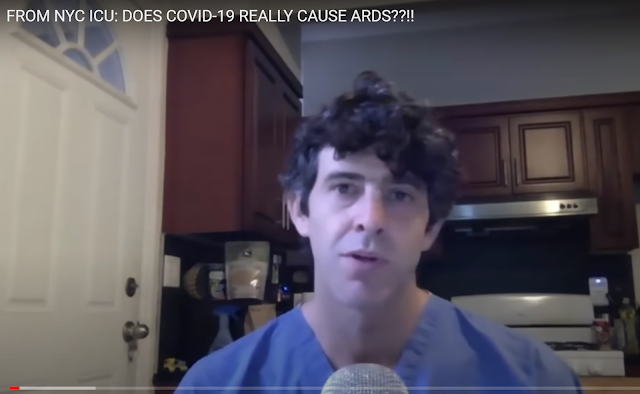
The treatment for cyanide poisoning is also 100% oxygen for hypoxia.
Symptoms compared [
ref]
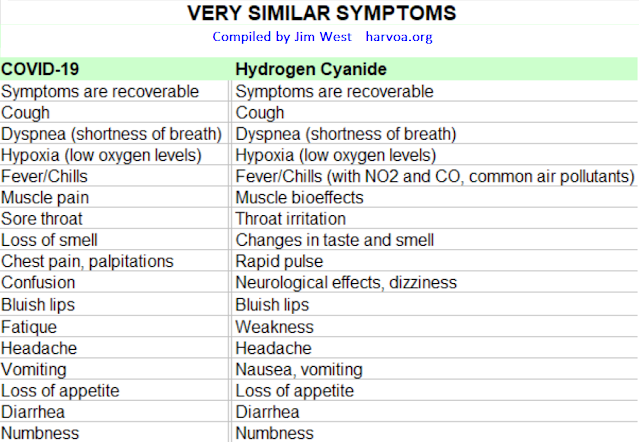 Precedent 1
Devra Davis, PhD
 has
documented many official air pollution
coverups. Davis was "the President Clinton appointee to the Chemical Safety and Hazard Investigation Board".
Precedent 2
The West Nile "virus" pandemic of 1999 was similar to the COVID-19 pandemic. Both are flu-like diseases that mainly threaten older people. My published
research found toxic MTBE (methyl tertiary butyl ether) at 15% of gasoline in epicenters, with this unknown to the general public. The EPA recommended MTBE for ban at the height of the epidemics in 1999. MTBE began a slow phase-out. The West Nile pandemic diminished over the years.
Like COVID-19, air pollution data correlated with West Nile disease incidence and positive test results. Symptoms of West Nile disease are the same as air pollution symptoms. The West Nile virus is an unproven entity. NY DEC told me that MTBE was regulated at the refinery by “discretionary letter”. A DEC scientist told me that they (DEC's Ward Stone of the State Wildlife Pathology Laboratory) changed their avian necropsy reports from "industrial poisoning" to "West Nile virus" because of (as he briefly laughed) the obviously heavy-handed politics that were going down -- daily headlines screaming "Deadly Virus", and helicopters spraying pesticides over the city.
Like COVID-19, all epicenters were downwind from oil refineries. Seniors were most affected, yet diagnostics were defined with an age range biased towards seniors.
ABC News reviewed the study August, 2001, after vetting.
The Townsend Letter for Doctors and Patients subsequently published the study.
Precedent 3
You can prove ubiquitous diagnostic corruption from your own experience. Tell your doctor you have the flu. Without reviewing your environment, he will likely assert a virus belief and possibly an antibiotic. You will have gained an obsession with washing your hands, an interest in toxic vaccines, a thin wallet, and the potential for
tragic results as you ignorantly return to your environment.
The Pollution Pandemic
Wuhan, the initial epicenter, is highly
polluted. Generally, China produces and imports toxic fracked fuel and has extremely low environmental standards. 80% of its energy production is from coal. Just months prior to the COVID-19 pandemic, activists were on the street protesting against air pollution and they were
persecuted.
Plume (air pollution monitoring
app) often shows Wuhan at 10x the pollution level found in New York City. Wuhan is usually reported as Very High, Extreme, or Excessive. Respiratory disease is guaranteed.
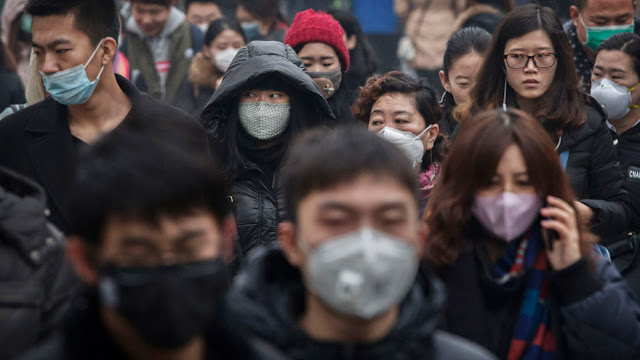
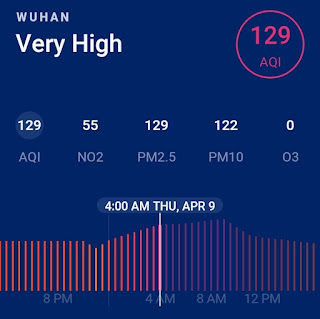 Beijing epicenter, BEFORE COVID-19
as portrayed by
Yale Env 360 (2018), Photo: Frayer/Getty
 Other China cities
 China's fake numbers
The pollution thesis would expect Wuhan COVID-19 deaths to be high and continuous. Yet, China tells the world that they have few COVID-19 deaths beyond its initial epidemic period, and that this is due to their strict and successful quarantine.
Steven Mosher, a China expert, investigated cremations and body bag counts. He stated during a Fox News
interview, that Wuhan's death incidence is ongoing, at an incidence of approximately 400/100K persons as of 4/7/20, and rising.
And then on March 23rd, after the 60-day crematoria frenzy, they began handing out funeral urns," Mosher added. "Five hundred funeral urns a day to grieving relatives from seven crematoria at times 14 days. Again, that's about fifty thousand.
China’s claim of low numbers occurred after it kicked out Western journalists. Yet, Western journalists choose to believe or disbelieve China’s statistics, depending on the agenda the Western medicos are pushing. For example, they disbelieve China’s numbers, as they hype the hazards of the COVID-19 virus, or want to accuse China for starting the epidemic, and they believe China’s numbers, as they point to China’s “successful” lockdown policy.
Madrid (Spain) vies for position as the next highest death incidence. It imports petroleum from Qatar, a major exporter of fracked fuel for industry and power plants.
Madrid pollution, as portrayed by
ZDnet (2011))
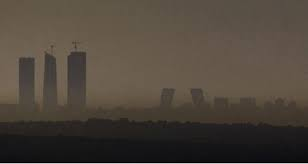
Plume often shows high NO2 (nitrogen dioxide) pollution for Madrid.
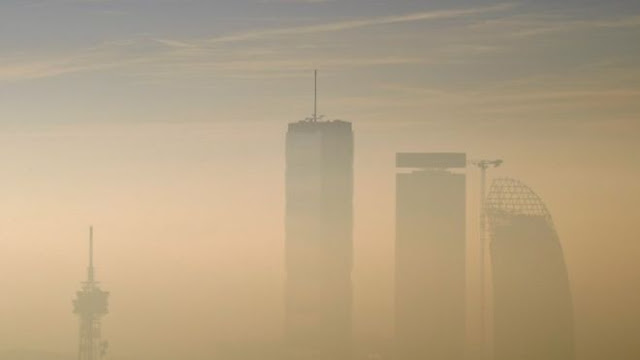
Milan (Italy) vies with Spain for most deaths, outside of China, and is accused of under-reporting. Milan has been called, "Europe's most polluted city." Milan imports much of its petroleum products, fracked, from the US. Long before the COVID-19 pandemic, traffic in Milan and Rome has been banned and people told to stay indoors because of intense air pollution.
Milan pollution, as portrayed by
BBC (2020), Photo: Reuters
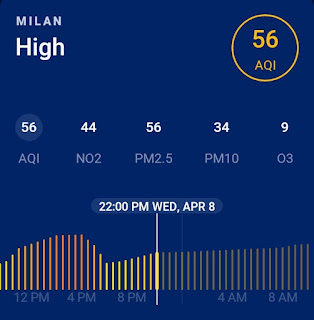
A common Plume report for Milan is "High" and "Very High".
 Milan, BEFORE COVID-19
as portrayed by
Pinzuti (2018)
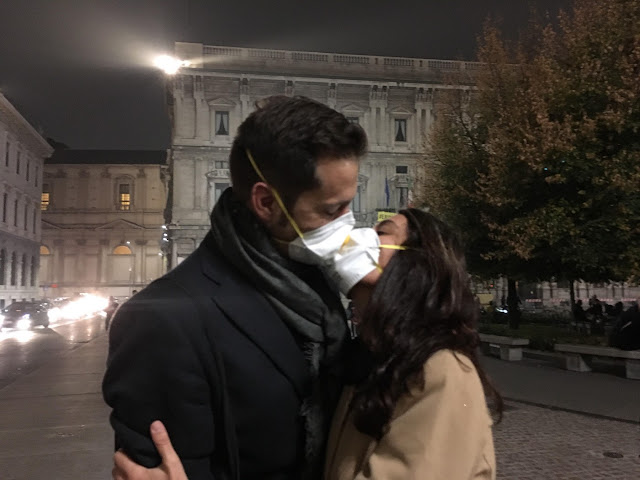
I don’t want to spend the rest of my life with an air pollution mask.
 The Tri-State Region (NY/NJ/CT)
4/7/2020, in the morning, Plume App reported "Excessive" and "Extreme" for New York City, with high and sustained NO2 levels. I predicted record COVID-19 deaths. Then later in the day, the media confirmed my prediction by reporting all-time record high COVID-19 deaths.
Missing data
That evening, I reviewed Plume again and found the air pollution historical data missing. Instead, New York City was shown to have an absurd Air Quality Index (AQI) of 3, due to the missing data, NO2, PM10, and O3.
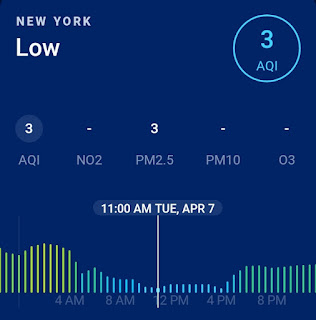
The same problem began occurring for New Orleans air pollution during high death counts. Other cities (with less COVID-19 deaths) do not have this extreme missing data problem.
NYCDOH COVID-19 death reports for 4/7/2020 stated, "High death counts are due to delayed reporting." Thus, on the day of record-high mortality, both medical and environmental data was suddenly missing.
There is a correlation between missing data and high COVID-19 death counts.
Fracked fuel exhaust correlates
The two largest US epicenters, the Tri-State Region and Louisiana, are both amidst the largest petrochemical regions in the U.S., and downwind from power plants fueled by fracked-fuel.
Poisoned earth correlates
Air pollution also arrives from earth spills, accumulated from centuries of unregulated industry. These spills are common throughout New York City and adjacent New Jersey.
Usually, epidemics in the US begin in, and are heaviest in, the New York City region, e.g., the 1916 polio, 1918 Spanish flu, The Great Polio Epidemic, West Nile virus, H1N1 flu, measles, and now, COVID-19. The cover story for each epidemic is a virus.
Telling coincidences
The initial COVID-19 epicenters in New York State of 2020 (highest in US) coincide with the three measles epicenters of 2019 (highest in US). These are Borough Park and Williamsburg in Brooklyn county, and Ramapo in Rockland county.
These epicenters (measles and COVID-19) occurred over toxic earth plumes from EPA Superfund Sites. Upwind to these epicenters are old and newly installed electric power plants, fueled by toxic fracked gas.
Within these Superfund Site epicenters, the measles epidemics in 2019 were
blamed on unvaccinated people by restricting diagnostic investigations to the unvaccinated. The unvaccinated were liable for fines of $1,000.
The COVID-19 epidemics of 2020 were
blamed on the same people for not self-isolating. Those not complying were
liable for fines, imprisonment, and litigation.
Sucharit Bhakdi, PhD
Dr. Sucharit Bhakdi is an epidemiologist and microbiologist, the chairman of The Institute of Medical Microbiology and Hygiene at Mainz University for 22 years. He is one of Germany's the most cited researchers.
Bhakdi “demystified” the COVID-19 pandemic.
Bhakdi boldly
supports the air pollution thesis, over the virus (rather than as a co-factor with the virus).
He does, however, maintain the burden of virus belief, and is thus stuck with a long and somewhat false argument, as if he were influenced by the famous Peter
Duesberg, PhD , who, in the 1980s, described the supposed "AIDS virus" as harmless.
Bhakdi similarly describes COVID-19 virus as low-risk.
Note that the
no-virus argument is much simpler, easier to remember, and ultimately powerful in debate. It merely puts the burden of proof on virologists where it belongs. It asks two simple questions which virologists cannot answer: 1) Where was virus isolation properly achieved? 2) Where was toxicological causation properly discounted?
Bhakdi is doing what he can within his profession's political limitations to bring attention to air pollution and COVID-19 contradictions.
Bhakdi describes the COVID-19 pandemic as “tragic”, a dramatized hyper-focus on Coronavirus, essentially a misdiagnosis of diseases that traditionally happen among the already severely ill, and often due to ongoing air pollution.
Here is the introduction from Bhakdi’s
interview, “Coronavirus COVID-19 - hype and hysteria? Demystification of the nightmare!”, March 19, 2020.
Q: Dr. Sucharit Bhakdi, you are an infectious disease specialist. You are one of the most cited medical disease specialists in Germany… What are Coronaviruses?
Bhakdi: These viruses co-exist with humans and animals around the globe. The viruses are the cause of very common minor diseases of the respiratory tract… A new member is on stage spreading fear around the world.
Q: Why?
Bhakdi: The new COVID-19 originated in China and spread rapidly. It appeared to be accompanied by an unexpected high number of deaths. Alarming reports followed from Northern Italy that concurred with the Chinese experience. It must, however, be pointed out that the large majority of outbreaks in other parts of the world appeared to display lower mortality rates.
Q: Why “appeared" to display mortality rates?
Bhakdi: When patients concurrently have other illnesses, an infectious agent must not be held solely responsible for a lethal outcome. This happens for COVID-19, but such a conclusion is false and gives rise to the danger that other important factors are overlooked. Different mortality rates may well be due to different local situations. For example, what does northern Italy have in common with China? Answer: Horrific air pollution. The highest in the world. Northern Italy is the China of Europe…
Q: The highest alert level has been declared and extreme preventative measures have been installed in the desperate attempt to slow the spread of this virus.
Bhakdi: Yes, and this is the incredible tragedy. Because all these measures are actually senseless…
Bhakdi is saying that, historically, coronaviruses "co-exist with humans" and they are not commonly known for serious effects. He says that a positive test result is "not the disease".
Dr. Birx, while representing the Federal Administration, inadvertently stated that deaths and disease are diagnosed as COVID-19 largely by
mere association with a positive test result.
Thus, even in the mainstream, virus-believing world, a "case" is not necessarily the disease, and any COVID-19 disease is not necessarily due to COVID-19.
Thus, the advertised pandemic is, to an unknown degree, a pandemic of testing. Yet, from the standpoint of the pollution thesis, there is a real pollution pandemic, of which the test would be measuring residual biological responses (falsely interpreted as COVID-19 antibodies).
Terminology
"Case" is misleading, because cases are not well defined. A mere positive for an already ill person is enough for a COVID-19 diagnosis. "Death" is more accurate, because death is more likely to be associated with definitive symptoms like fever and lung damage.
Cases and deaths are misleading, for example:
NY Times, "Morning Briefing" (4/23/2020):
...the US outbreak... by far the world's largest...
All public information outlets should be using the word “incidence”.
Incidence reveals disease intensity, disease per population. It reveals patterns that point to toxic sources. Fracked fuel exhaust correlates with deaths.
Incidence again
The US may be "the largest" (outside of China), but it is much farther down the list in terms of incidence. If US refinery epicenters were subtracted, US incidence would be “the smallest” in the world.
New York City incidence is much higher than US incidence. Therefore, what is different about New York City?
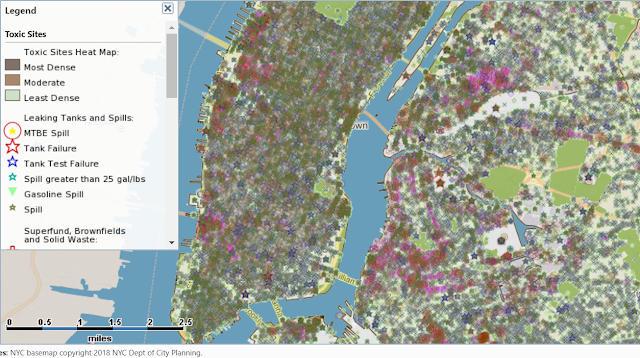
MASSIVE EARTH POLLUTION.
EPA/DEC data, as portrayed by
PropertyShark
 Caveat
: Spill maps are good for earth pollution studies, but do not always accurately indicate present active hazards. There is a political element. For assertive discussion,
Example 1: The green area is high-value real-estate in Manhattan, on the east side, Stuyvesant Town, 11,000 apartment buildings. This is the former site of a manufactured gas plant (MGP), which in my opinion, should be designated a still hazardous Superfund Site (a risk if one lives near ground level).
Example 2: Brooklyn Naval Yard is the former site of shipbuilders during WWI and WWII and further back in history for 400 years. It shows on the map as an area of relative non-concern.
Example 3: Fifty refineries once operated near Greenpoint and Williamsburg (Brooklyn) during the pre-regulatory era. Chemical spills are the largest in US history. The map doesn’t represent the risks of that polluted earth appropriately.
The map is a great contribution to research. However, maps of disease incidence are the best indicators of pollution, and for that reason, I assert, Departments of Health are not allowed to provide detailed epidemiological maps. They, however, state that the reason is patient privacy. But such data could be omitted or anonymized.
Population density
Challenge: Air pollution is already acknowledged as a cofactor for COVID-19 disease. Incidence is high in NYC because it has a higher population density, and thus, social distance is not maintained well and the virus spreads more efficiently.
Answer: Population density is not a common denominator. A comparison of the five NYC boroughs refutes the theory of population density. The boroughs are all within a small geographical area, sharing a common environment in terms of above-ground air pollution.
Manhattan is highest density and lowest incidence. The Bronx is half the density of Manhattan and nearly twice the incidence
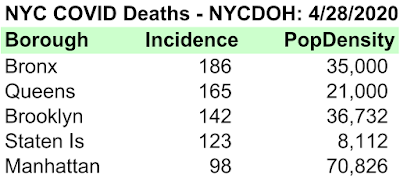
Manhattan has more people located on higher floors, away from earth pollution.
The Bronx has more people located on lower floors near earth pollution. It is nearer to the newly installed upwind electric power plants.
Metaphorically, New York City is a Petri dish of poisoned vulnerables who are revealed by the application of a dye of toxic fracked-fuel exhaust. They are revealed in terms of their morbidity and mortality.
Canadian epicenters provide another contradiction for those who believe population density supports the infectious paradigm. Vancouver, with the highest population density has very low COVID-19 incidence. North Montreal, with its lower population density, has the highest incidence. The difference: North Montreal is an environmental disaster, with many oil refineries near.
5G not primary cause
Some assert that electromagnetic fields (EMF) from
5G are causing the pandemic.
This is unlikely because 5G protocol was not substantially present in all the epicenters, and the 60GHz frequency, the form of 5G that would purportedly cause COVID-19 symptoms, was
not yet deployed.
5G is not a common denominator.
Spain delays 5G
Telecoms
article title: "Orange Spain not going to be rushed into 5G fracas"
Although we have been talking about 5G for years, realistically the ecosystem is still immature. Stand-alone standards are still embryonic, spectrum has not been aligned perfectly, telcos are still fibering networks, the 5G core is non-existent and the radio technology is not good enough. [Sept 25, 2019]
See the 5G deployment map of Madrid during the COVID-19 pandemic. Madrid vies with Italy and Wuhan for the world’s highest incidence of COVID-19 death. Yet 5G was minimally deployed. This map, updated daily, represents the
network of only one of Madrid's four telecom companies, the only one that had installed 5G as of 4/7/2020.
5G deployment is portrayed in blue.
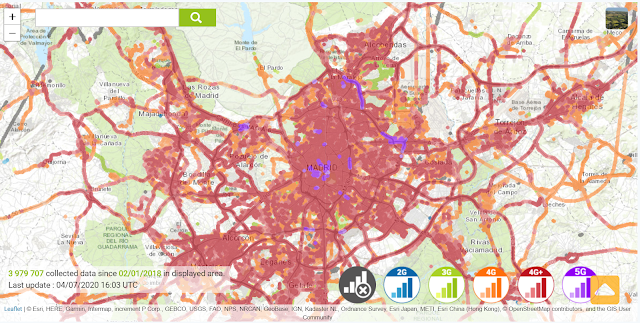
The map shows that 5G accounts for less than 0.5 percent of WiFi installation in Madrid during the epidemic, and there is no information regarding the frequencies employed.
Spanish friends tell me 5G to be implemented throughout Spain in October 2020.
Sweden delays 5G
Sweden decides to delay 5G spectrum allocation [
Telecoms 9/18/2019]
Electromagnetic smog, whether it arrives from 4G or 5G routers, or power EMF from cables and devices, can generate biological
hypersensitivity to toxic chemicals. EMF could thereby cause COVID-like symptoms such as respiratory symptoms and fever. The map demonstrates that electro-smog can only be a contributor to the pandemic, not a primary cause.
The self-quarantines and lockdowns could increase electro-smog, when people live their lives through social media, sitting near high-EMF computer monitors and Internet routers, increasing EMF stress. The official guidelines are “stay connected” but “self-isolated”.
Higher frequencies (presumed with 5G) are more readily absorbed by the
skin, which attenuates EMF energy (through skin damage), protecting the lungs and other organs.
5G
proponents assert that high 5G frequencies such as 60GHz, caused the pandemic by splitting oxygen molecules, rendering oxygen difficult for lungs to absorb. However, 5G proponents misread their own supporting studies.
Some 5G articles appear to be purposely inaccurate as if to discredit real 5G theorists.
I have challenged several 5G causation proponents, including Arthur
Firstenberg, and have yet to receive a reply.
Conclusion
Thanks for reading this environmental exploration of the COVID-19 pandemic! Feel free to comment.
Caveat
Statistical data will be out of date by time the reader encounters this study. However, any changes in the COVID-19 landscape can be explained by 1) Changes in the fracked fuel market, which has been going through heavy economic disruption during the pandemic. Regions that did not buy fracked oil may be buying due to reduced prices of oil from bankrupt fracked fuel industries. 2) Increased COVID-19 testing, changing test protocols, and, of course,
faked positive test results.
As of April 2020, it appears that air pollution levels are down in many epicenters, and that the pandemic is likely being driven by media panic,
biased (if not fraudulent) diagnoses, testing which produces ill-defined "cases", and residual illness from prior pollution increases.
This study is unique
See
statement.
_____________________________________________
Additional
references.
Thanks to
Adam Crazz, Gary Krasner (CFIC),
Anthony Brink, Chris Rawlins, and
Tedd Koren. Thanks for the extensive works of
Jon Rappoport and
David Crowe.
Jim West is an environmentalist, medical critic, and former chairman of the science committee of The NoSpray Coalition in New York City, which litigated against the City of New York re its helicopter-driven pesticide campaigns. His work has been featured by
ABC News,
The Townsend Letter for Doctors,
Greenmedinfo,
Nexus, CrazzFiles, and other publications. He originated the arcane concept of “DDT/Polio” in the modern era, and is known for his ground-breaking research into the hazards of
prenatal ultrasound.
_____________________________________________
Disclaimer: The author is not an authority or professional. For medical advice, see a trusted professional without delay. All statements are hypotheses for discussion. Constructive criticism is welcome.
Fair Use Act Disclaimer.
This site is for discussion purposes only.
Copyright Disclaimer under section 107 of the Copyright Act 1976, allowance is made for “fair use” for purposes such as criticism, comment, news reporting, teaching, scholarship, education and research.
Intellectual Property Rights
The intellectual property aggregated and redistributed in this site is for educational use only and is considered protected by standards of fair use. Intellectual property owners have been cited where possible. Original material produced for this site is copyright Jim West / harvoa.
-
April 09, 2020
Email ThisBlogThis!Share to TwitterShare to FacebookShare to Pinterest


 . This a big diffetence compared to Western authorities.