My rides along Amtrak California’s Capitol Corridor now include an eerie stretch where they pass the site at which the highest ground motions in the
Napa earthquake were recorded mere weeks ago. Just at the south abutments of the I-80 bridges over the
Carquinez Strait, where the Union Pacific tracks
pass through the
C&H refinery, a shallow borehole seismometer recorded an acceleration of 0.99g, nearly the full force of gravity lurching soil and structures from south to north.
A Capitol Corridor train passes the site of the strongest shaking record from the Napa earthquake. Clearly seismic measurements here have big implications for a lot of infrastructure. Photo © Hunter Lohse, from
www.railpictures.net
The extreme magnitude of this acceleration is a local anomaly, with the next highest recorded accelerations being ~0.66g in downtown Napa, where heavy damage was concentrated. We know that in between these official seismic stations, accelerations exceeded 1g where, for example,
sidewalk slabs were overthrown. The formal strong motion records are accessible through a web database maintained by the USGS and the California Geological Survey: the
Center for Engineering Strong Motion Data.
The South Napa Earthquake was the strongest to hit the region in over two decades, so, as
the CESMD staff explain,
“Many structures and sites have been instrumented since then, so this is the first set of significant data for many of these stations. The [newly instrumented] structures include the
major Caltrans toll bridges in the Bay Area, for which Caltrans also supported installation of geotechnical (downhole) arrays.”
Indeed many significant new structures throughout the Bay Area (notably,
large residential towers on
Rincon Hill and the new
eastern span of the Bay Bridge) got their first recorded response to significant ground motion during this 6.0 quake. These data allow engineers to calibrate and validate their models of structural response in order to verify how their seismic designs work, or to identify potentially compromised structures quickly following an earthquake.
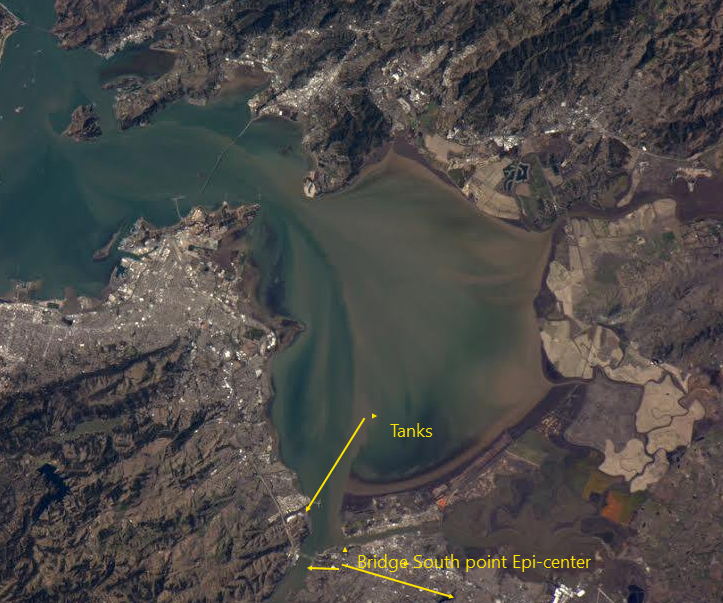
 Added reference direction of the 4.5
 with a Depth @ 13.97 km (8.7 miles)
Astronaut’s-eye view of the bridges around San Francisco Bay. Golden Gate top center, Carquinez across strait in bottom right quadrant. Napa quake epicenter at lower right corner of frame. Photo via astronaut Rick Mastracchio
The Carquinez Strait site of highest recorded ground motions, above which Amtrak whizzes 36 times a day–and so do
over 100,000 cars, offers a perfect illustration of seismic design and structural response. In addition to borehole seismometers on the south shore capturing the “ground truth” of shaking at the site, both the eastbound and westbound interstate highway bridges soaring above are heavily instrumented to gauge structural response to ground-shaking.

Plan and elevation view of seismic instrumentation on the westbound Carquinez suspension bridge
Notably, the westbound interstate lanes cross a brand new suspension bridge, completed in
2003 to replace a 1929 steel truss structure whose 1958 twin still carries the eastbound lanes. The differences among
the accelerometer records from
the ground, the 56-year-old
metal truss bridge, and the 10-year-old
suspension bridge are illuminating, and apparent even to a non-expert.
The site is 19 km from the epicenter. On the ground, the quake here was sharp, impulsive, and relatively short. The P-wave is strong, and the S wave follows by just over two seconds, yanking the instruments northward. High amplitude shaking lasts around 5 seconds then trails off.

Center for Engineering Strong Motion Data – record from site of highest recorded shaking (99%g) in Aug 24 M6.0 South Napa earthquake
On the metal truss bridge (accelerogram below), this motion is channeled into a dominant frequency as the bridge resonates. Here on the bridge, perceptible shaking lasts two to three times as long as it does on the ground below. There’s still a lot of ragged, high-frequency motion apparent at all positions along the bridge because the rattly metal structure’s small, stiff components transmit that original high-frequency energy from the ground. Amplitudes are consistently higher at the tops of the towers (channels 8, 23) and at midspan (channel 34) than they are on the piers and abutments (channels 6, 13, 32). For a really fascinating detailed look at how the structure responded, match the channels labeled here with
this diagram of the instruments on the bridge.

Carquinez eastbound bridge Napa quake response
The suspension bridge is a whole different beast. Shaking starts strongly and abruptly with the P-wave, and by the time the S-wave ripples through (top two records, channels 54 and 74, show stations on bridge elements mounted firmly in the ground, and thus closely resemble the “ground truth” shaking), the bridge is already beginning to oscillate. Here, the structural resonance is strong and profoundly apparent… and it lasts for at least 40 seconds. Two dominant frequencies appear (more may be evident with more quantitative analysis than this cursory visual inspection), but you can see especially in the displacement records (e.g., channel 35 displacement) the main 1 Hz signal as well as another ~0.2 Hz (5 seconds per cycle) that shows up toward the end. You would feel this as strong, rhythmic bouncing for quite some time. Spooky!

Carquinez westbound bridge structural response to Napa earthquake. Note very periodic oscillation, and anticorrelation between E and W sides of bridge
One noteworthy feature of these suspension bridge records is the exact anticorrelation between the east and west sides of the bridge deck in the middle of the main span. Compare channels 35 & 39, or 32 & 33. As the west side moves down, the east side moves up. This pattern represents torsion of the bridge, which was illustrated notoriously in the
failure of the Tacoma-Narrows bridge (the infamous Galloping Gertie), and in the less well known but very impressive
Ibañez Suspension Bridge’s response to a M6.0 quake in Puerto Aysen, Chile:
This CESMD database can be accessed through an
interactive map of strong motion records throughout the Bay Area from sites where shaking exceeded 0.5%g. Engineers will be well aware of this site, but I find it fascinating and useful to check out how shaking would have felt at various sites, in various buildings, and at various heights around the Bay Area. Have a look around the map for shaking records in your neighborhood, or pick your favorite iconic Bay Area structure and see how it “performed.”
Interactive Map of Strong Motion Stations for M6.0 South Napa Earthquake


