Sol (Sun) and its phenomena

SOLAR CYCLE 25 ACTIVITY REPORT JANUARY 31_2024

After yesterday's spectacular M6.8 flare we are back to a low level of seismic activity. The largest solar event of the period was a C5 event observed at 1740 UTC from Region 3559 (N29W97) So this sunspot is saying see you soon. By the way, there are those who consider that the M6.8 solar flare was actually an X-class, only it was partially obscured because the region was on the far side.​

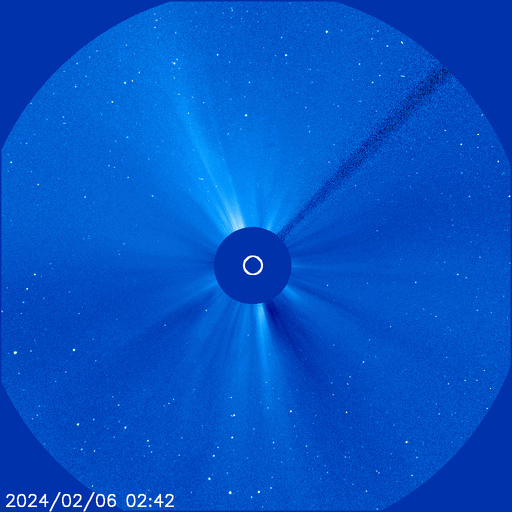
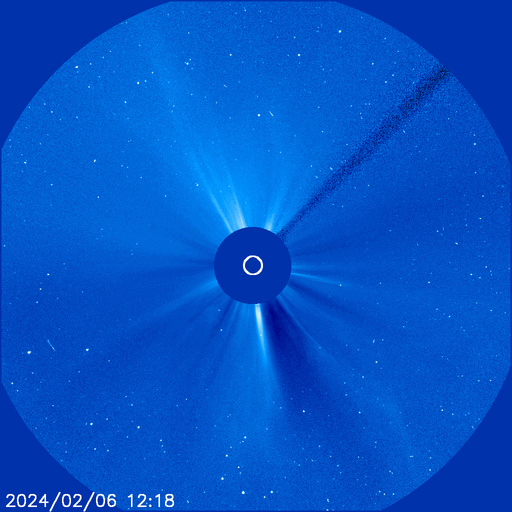
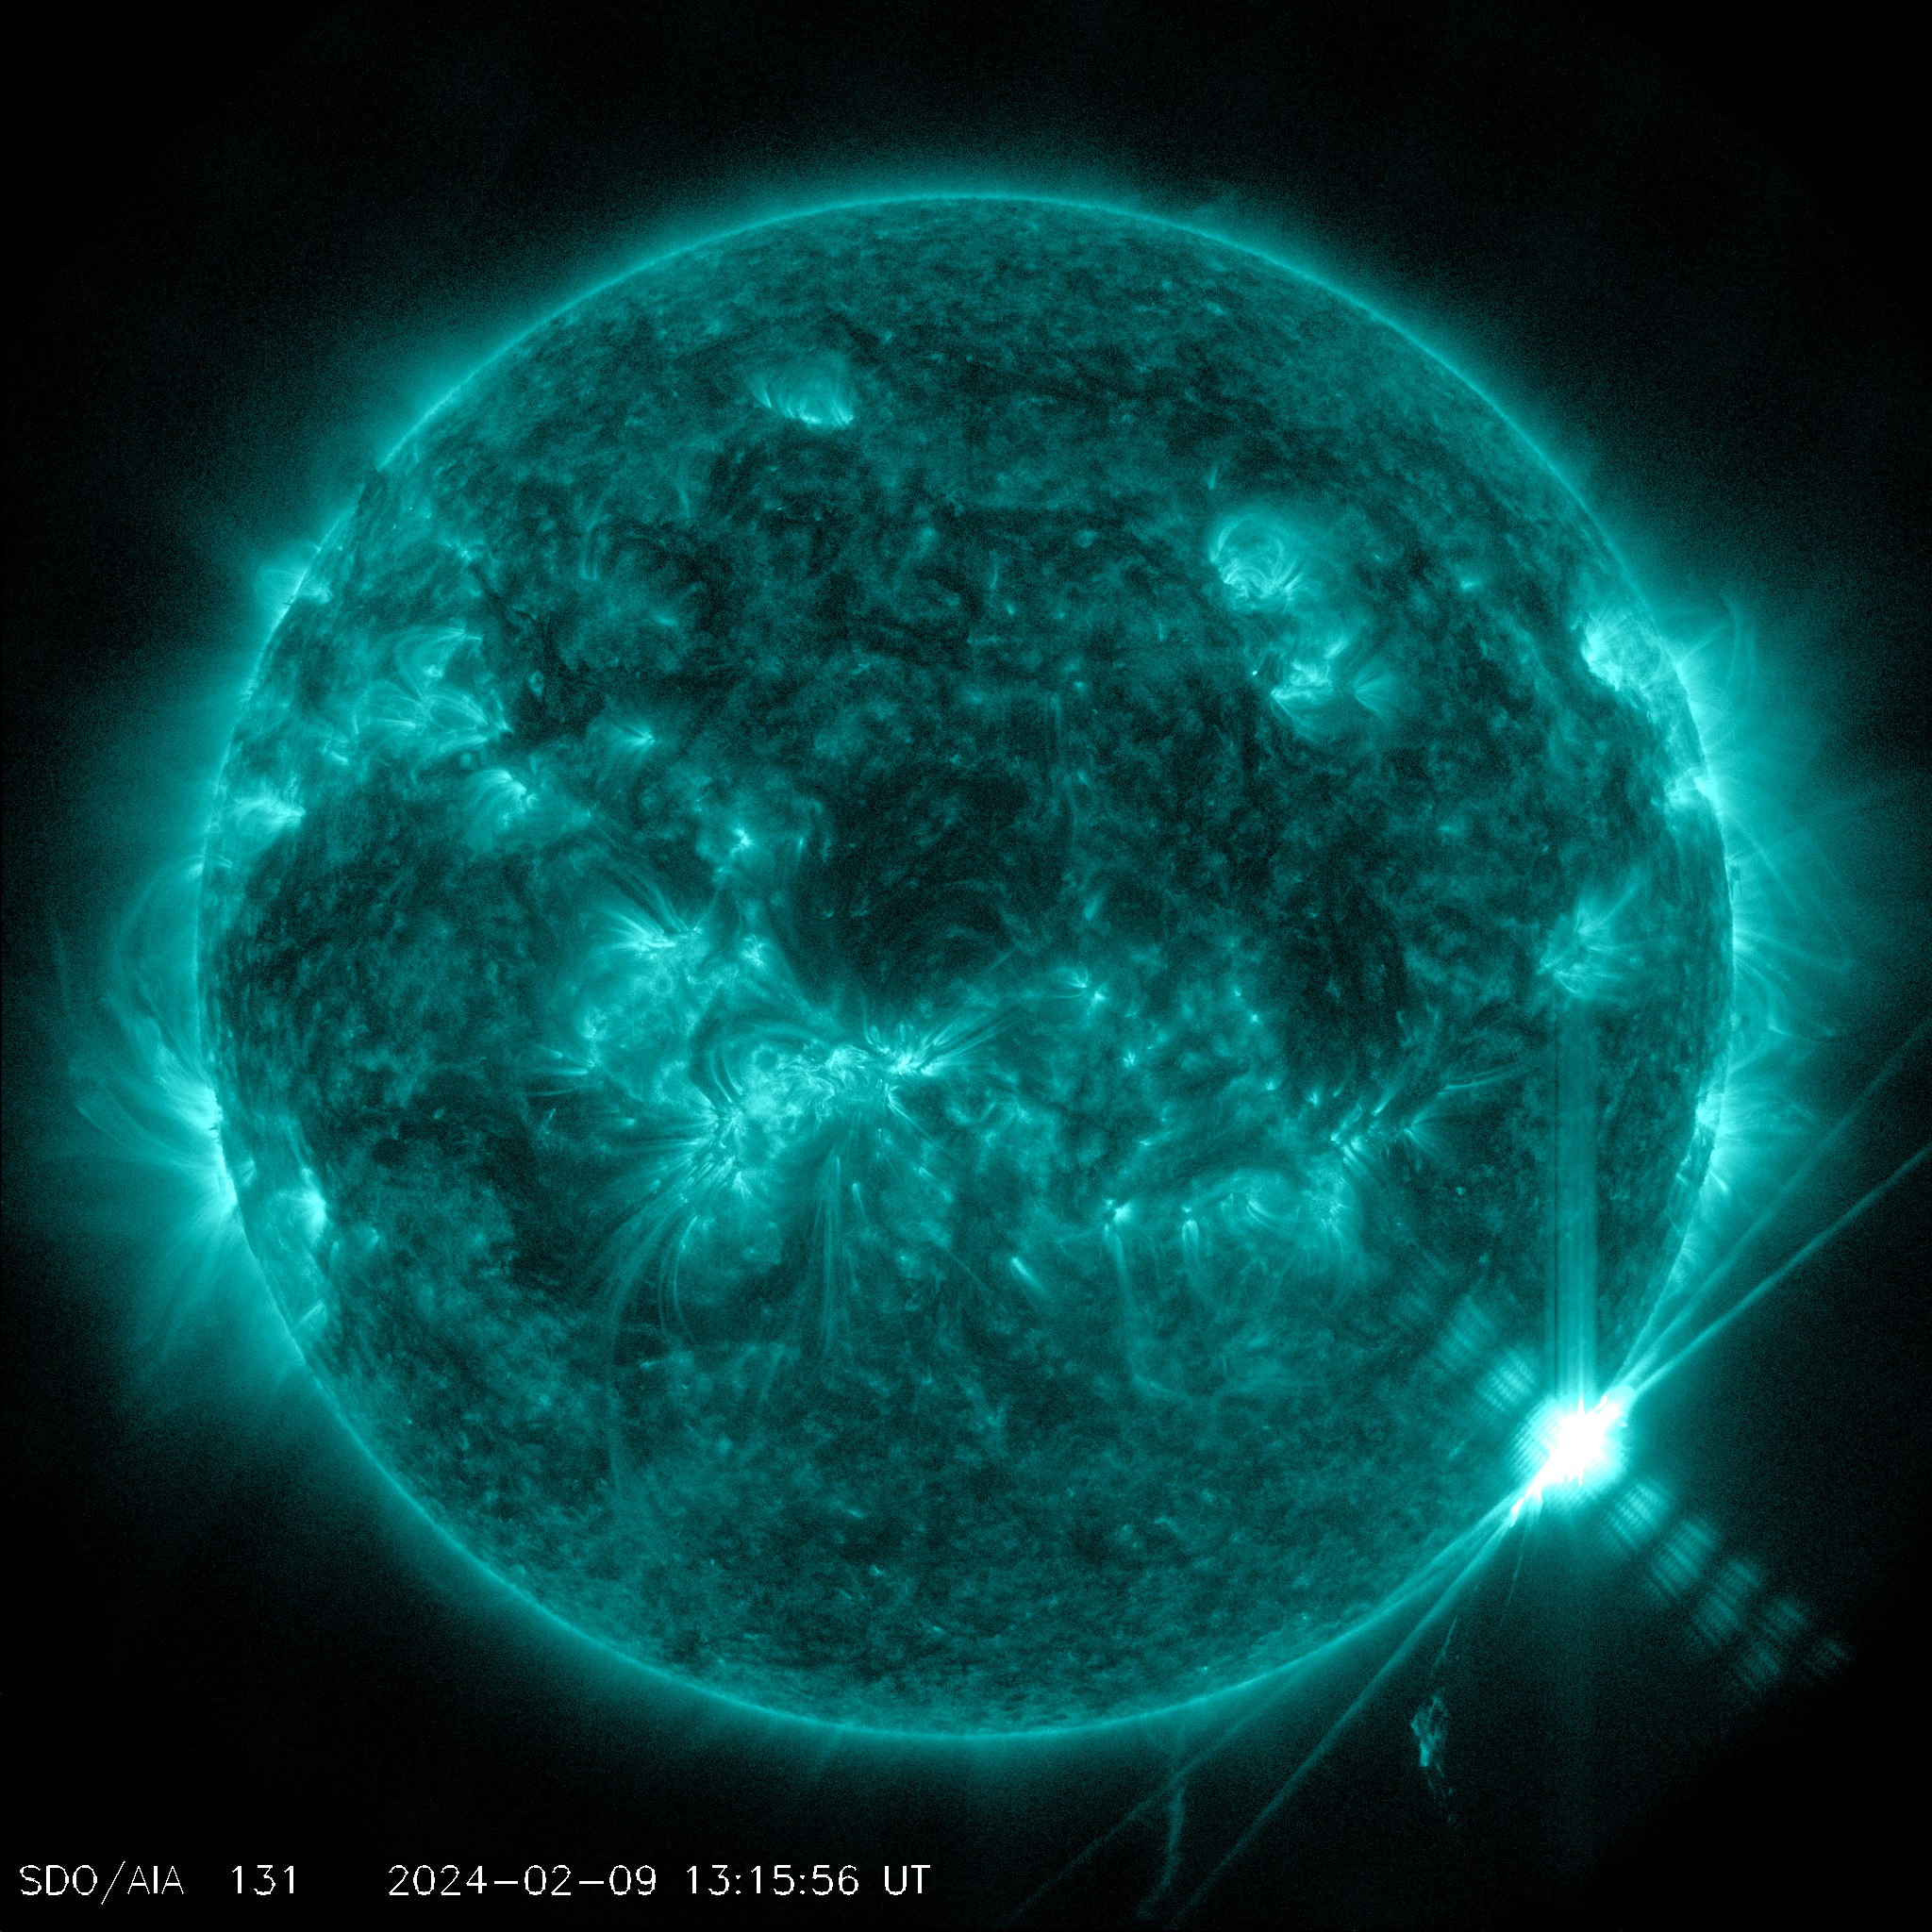
A coronal shower was observed after the M6.8 it was beautiful
GROWTH OF POST-FLARE LOOPS: Following the explosive passage of the M7 flare earlier, an arcade of loops formed as the newly opened coronal magnetic field closed down again. Note how they increase in height and spread as lore loops form.

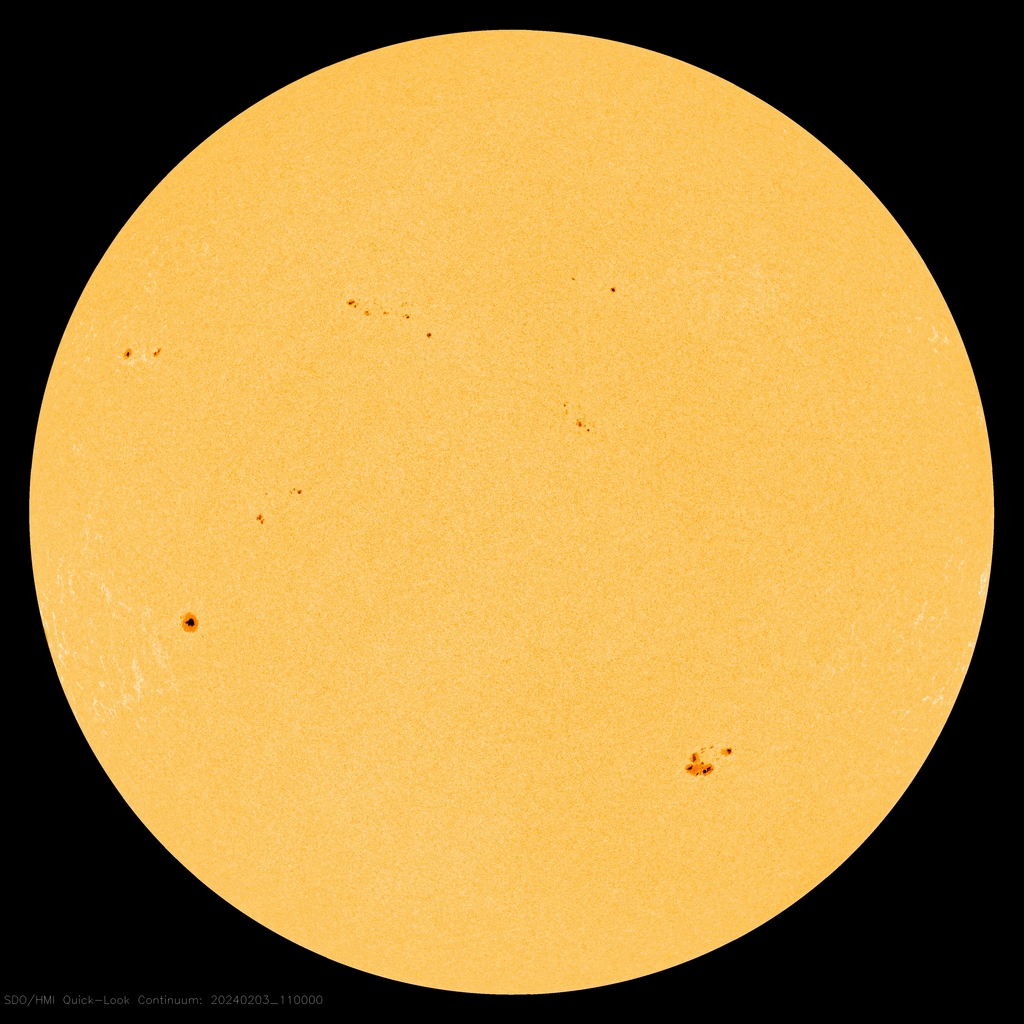
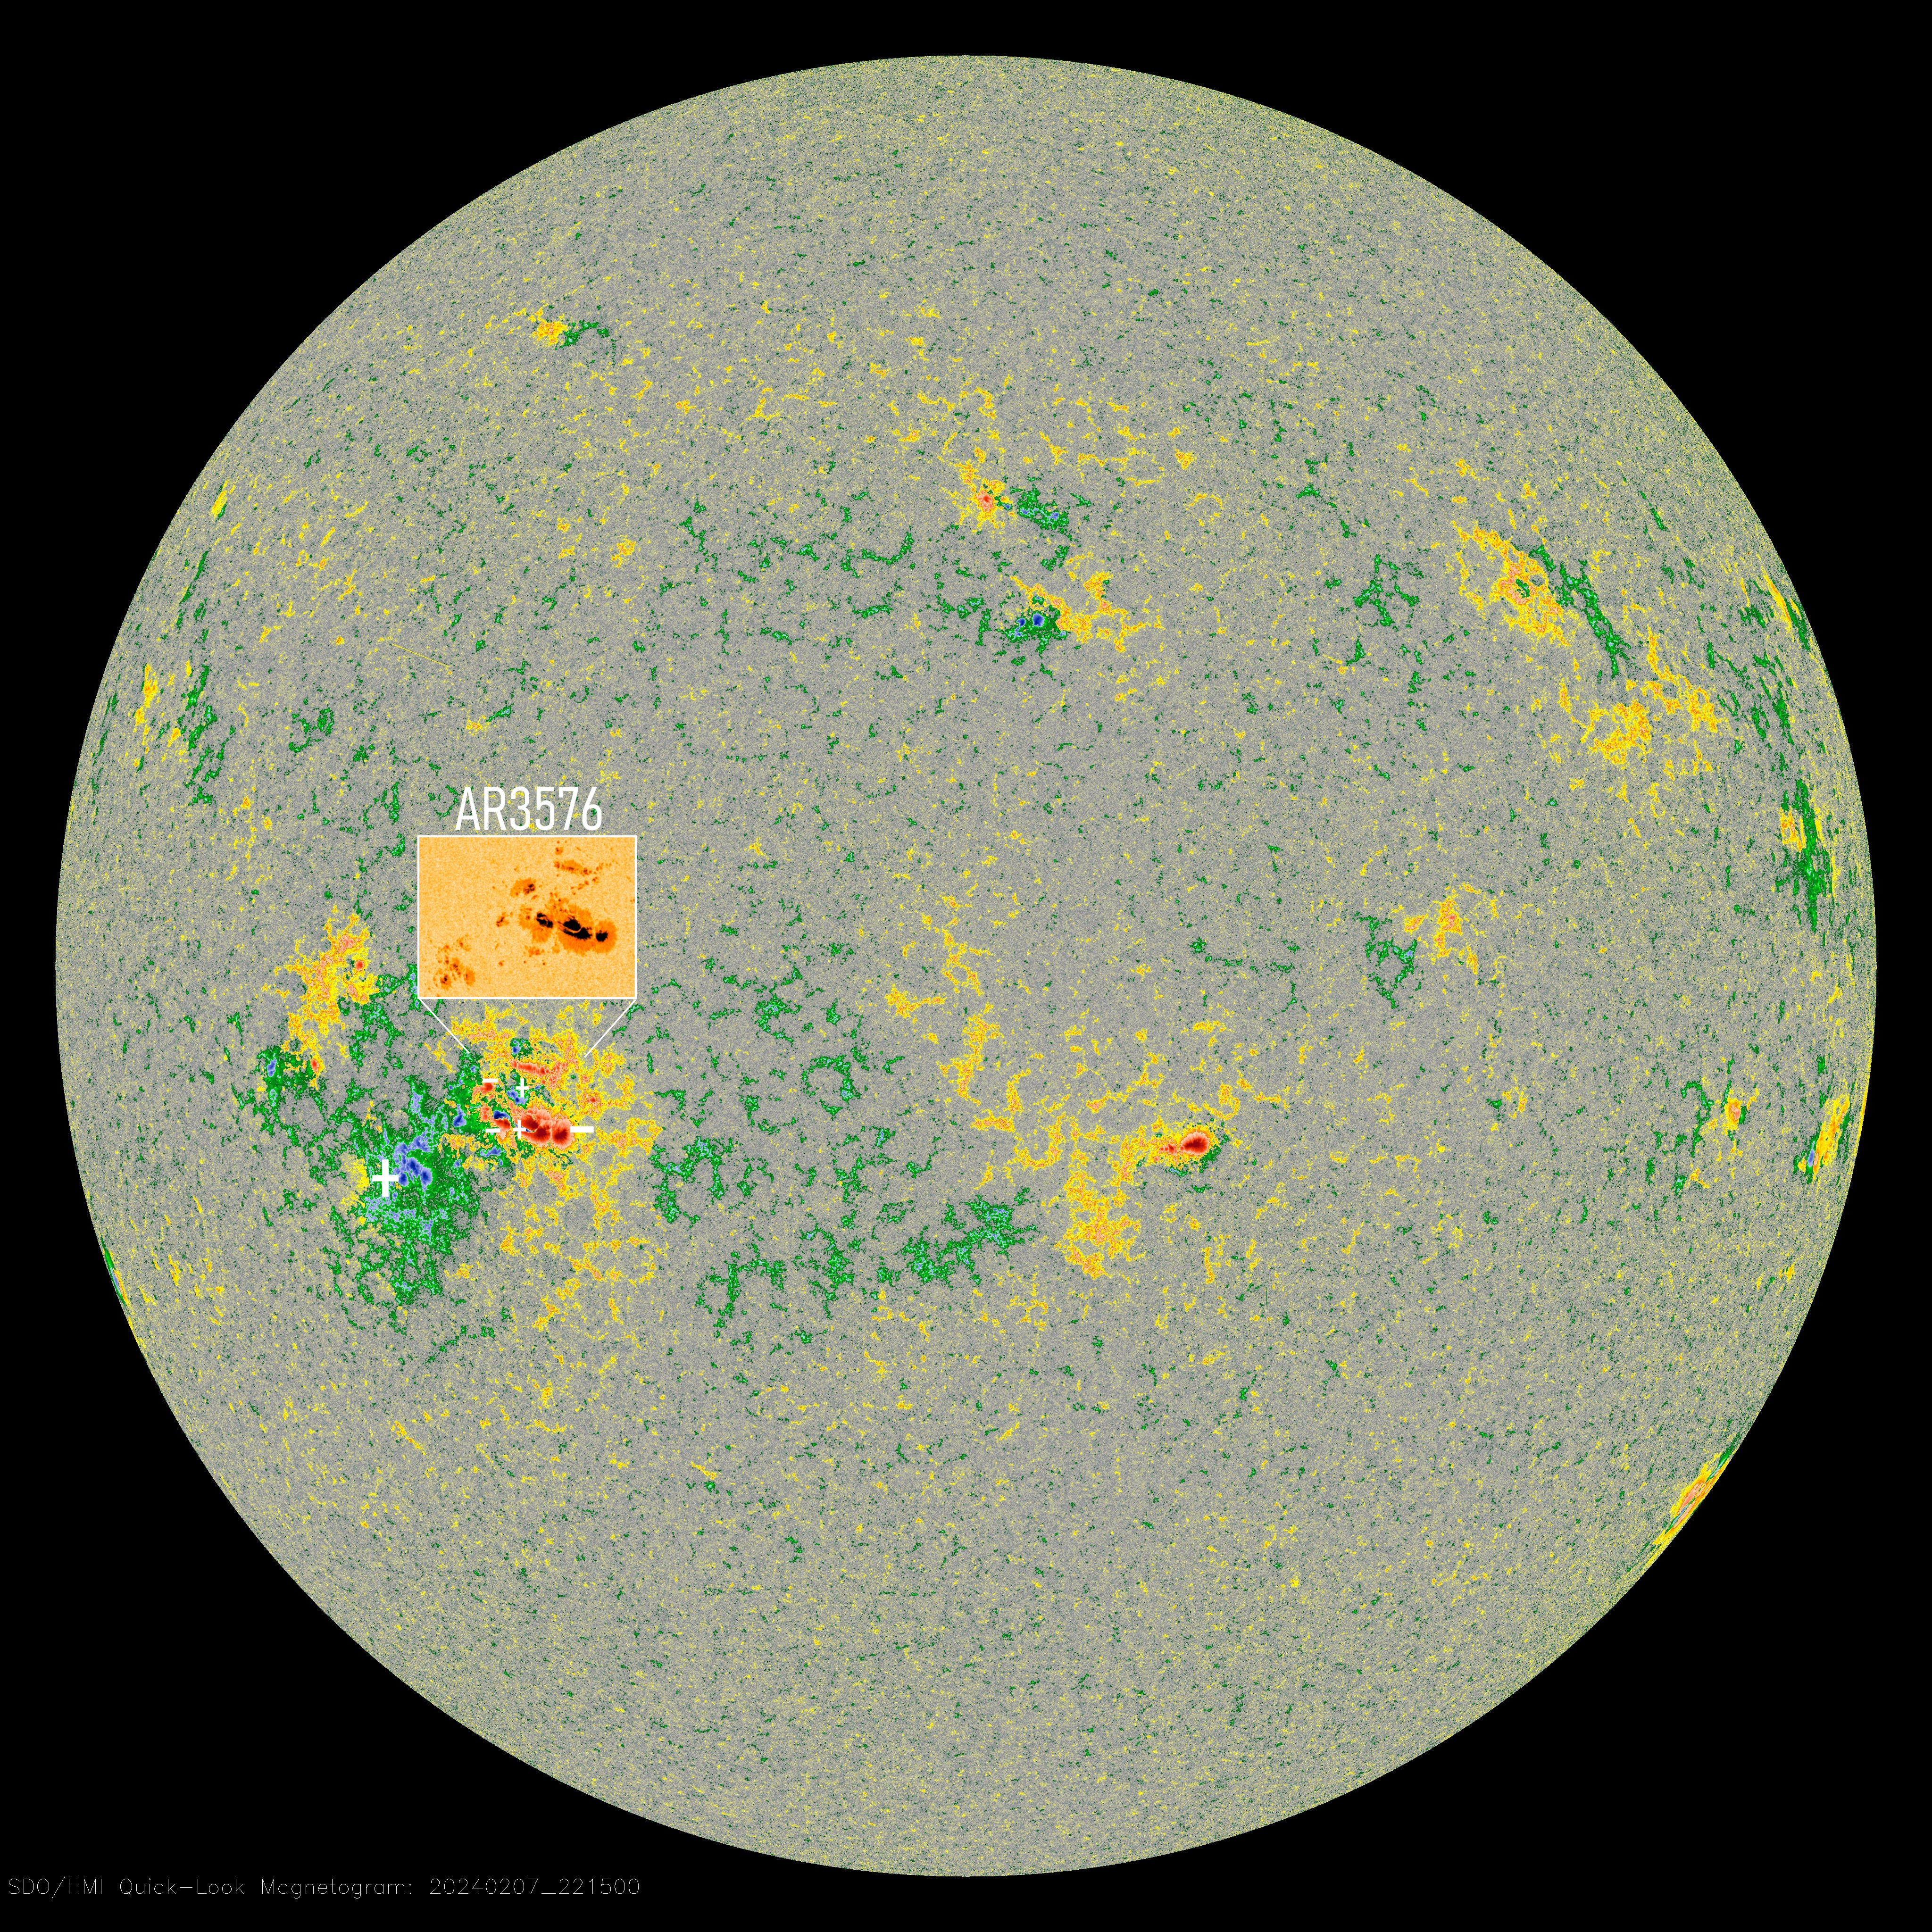
There are currently 4 sunspot regions on the solar disk: AR3565, AR3566, AR3567, AR3568
hmi200 (1).jpg
AR3559 AR3560, AR3563 & AR3564 are gone

Total number of sunspots has increased to 53 (13 of these are grouped into 4 active regions) NOAA forecasts for the next 24h: 95% chance for C flares, 25% chance M flares and 1% chance for X flares. All regions have stable beta magnetic fields​

● Auroral Activity

The geomagnetic field has been at quiet (Kp1) to unsettled levels (Kp3) for the past 24 hours. On January 30 Solar wind speed reached a peak of 530 km/s (Moderately high speed) at 05:41 UTC. Total IMF reached 5 nT at 00:09 UTC this represented a low level impact to the Earth's magnetic field.
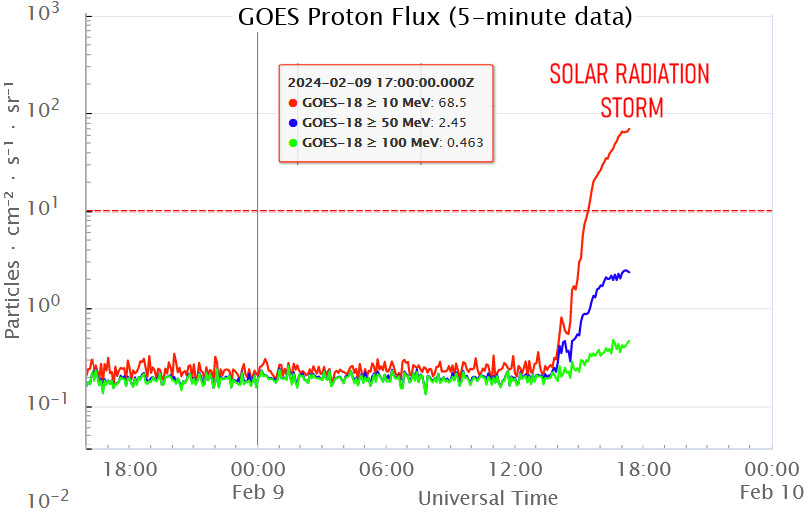
THE RADIATION STORM IS SUBSIDING:
Yesterday's solar radiation storm is subsiding. It is now a minor S1-class event, which poses no threat to astronauts or air travelers. Only Earth's polar regions are feeling a lingering effect of the storm. Shortwave radio transmissions inside the Arctic and Antarctic Circles are still being absorbed. SpaceWeather.com​

Aurora Oval Bz: -1.96 nT South
aurora-map (1).jpg
● Current Conditions at 04:56UTC on January 31
▪︎ Geospace quiet (Kp 2)
▪Solar wind speed record: 453 km/sec (Elevated speed)
▪︎ density: 6.33 p/cm³ (low density)
▪︎ Interplanetary Magnetic Field (IMF)
Bt: 3.54 nT
▪︎ X-ray Solar Flare:
▪︎ Thermosphere Climate Index
today: Warm
▪︎ Neutron Counts today: -3.7% (Low)
▪︎ Sunspot number: 53 (SN 48 January 30)
▪︎ Spotless Days 2023 total: 0 days (0%)
▪︎A twin stream of solar wind flowing from a coronal holes should reach Earth on Jan 30-31
........
SpaceWeatherlive.com
SpaceWeather.com
 
SOLAR CYCLE ACTIVITY REPORT FEBRUARY 01_2024

Wow quickly January is over and we are approaching the (dreaded) month of April and its eclipse. Meanwhile the Sun continues with low levels of activity. Region 3567 (N19E54) timidly greeted with a C4 flare and this was the largest event of the period.
AFTERGLOW OF A SOLAR FLARE: When this week's powerful M6.8-class solar flare was finished, it left something behind. Argentine astronomer Eduardo Schaberger Poupeau photographed the "post-flare loops":​
Glowing arches like these appear after many strong solar flares. Astronomers have studied them for decades, yet there is still some controversy about what they are. Superficially, they appear to be giant magnetic tubes filled with plasma super-heated by the explosion that just happened. But that might not be right. Some observations seem to show gas condensing from the sun's hot corona into these structures. If that's what's happening, it means the flare not only blows material away from the sunspot, but also sucks it in! SpaceWeather.com​

There are currently 6 sunspot regions on the solar disk:AR3564, AR3565, AR3566, AR3567
AR3568 & new region AR3569. All regions have stable beta magnetic fields except the AR3564 & AR3569 regions which came back to life with alpha magnetic fields
THE RACE TO SOLAR MINIMUM: The average monthly latitude of sunspots in solar cycle 25. Orange is the northern hemisphere, blue southern. As the cycle progresses the latitude of the spots decline until they reach the equator at the start of solar minimum, which would be July 2029. Keith Strong vía X
20240131_221050.jpg

Total number of sunspots has increased to 75 (27 of these are grouped into 6 active regions) NOAA forecasts for the next 24h: 95% chance for C flares, 25% chance M flares and 1% chance for X flares.​

● Auroral Activity

The geomagnetic field has been at quiet (Kp1) to unsettled levels (Kp3) for the past 24 hours. On January 30 Solar wind speed reached a peak of 504 km/s (Moderately high speed) at 21:31 UTC. Total IMF reached 4 nT at 06:58 UTC this represented a low level impact to the Earth's magnetic field.

Aurora Oval Bz: -0.57 nT South​
aurora-map.jpg
● Current Conditions at 04:06 UTC on January 31
▪︎ Geospace quiet (Kp 1)
▪Solar wind speed record: 397 km/sec (Normal speed)
▪︎ density: 0.45 p/cm³ (low density)
▪︎ Interplanetary Magnetic Field (IMF)
Bt: 3.68 nT
▪︎ X-ray Solar Flare: B9 0352 UT Feb01
▪︎ Thermosphere Climate Index
today: Warm
▪︎ Neutron Counts today: -2.8% (Low)
▪︎ Sunspot number: 75 (SN 53 January 31)
▪︎ Spotless Days 2023 total: 0 days (0%)
........
SpaceWeatherlive.com
SpaceWeather.com
 
SOLAR CYCLE 25 ACTIVITY REPORT FEBRUARY 02_2024

Solar activity remained at low levels during the past 24 hours with many C-class flares being the largest a C3 at 07:43 UTC from active region 3573 (N23E08) a very small region of 10 millionths of a hemisphere. It was until 03:01 UTC on February 02 that the new region 3571 (S17E60) produced an M1.1 class flare which produced a R1 radio blackout over Australia.
20240201_225118.png
20240201_225417.jpg
In just 24 hours, 5 additional sunspots developed, bringing the record to a total of 10 regions: AR3565, AR3566, AR3567, AR3568,
AR3569 & new regions AR3570, AR3571, AR3572, AR3573 & AR3574

All regions have stable beta magnetic fields except AR3567 which has developed a beta-gamma bipolar magnetic field that harbors energy for M-class flares. During the week, it will transit to the Earth strike zone.​
hmi200.gif
AR3564 is gone

Total number of sunspots has increased to 113 (37 of these are grouped into 10 active regions) NOAA forecasts for the next 24h: 95% chance for C flares, 25% chance M flares and 5% chance for X flares.​

● Auroral Activity

The geomagnetic field has been at quiet (Kp1) levels for the past 24 hours. On February 01 Solar wind speed reached a peak of 461 km/s (Elevated speed) at 07:57 UTC. Total IMF reached 8 nT at 07:57 UTC this represented a low level impact to the Earth's magnetic field.​

A CME MIGHT GRAZE EARTH THIS WEEKEND: Yesterday, Feb. 1st, a filament of magnetism in the sun's northern hemisphere erupted, hurling a CME into space. Most of the CME will sail north of our planet, but not all. A NASA model predicts a glancing blow on Sunday, Feb. 4th. The impact could spark a minor G1-class geomagnetic storm with auroras at high latitude. SpaceWeather.com
northernCME.gif

Aurora Oval Bz: -1.64 nT South
aurora-map.jpg

● Current Conditions at 05:20 UTC on February 02

▪︎ Geospace quiet (Kp 1)
▪Solar wind speed record: 358 km/sec (Normal speed)
▪︎ density: 1.62 p/cm³ (low density)
▪︎ Interplanetary Magnetic Field (IMF)
Bt: 3.15 nT
▪︎ X-ray Solar Flare: M1 0301 UT Feb02
▪︎ Thermosphere Climate Index
today: Warm
▪︎ Neutron Counts today: -1.9% (Low)
▪︎ Sunspot number: 113 (SN 75 February 01)
▪︎ Spotless Days 2023 total: 0 days (0%)
▪︎ A minor stream of solar wind flowing from this southern coronal hole should reach Earth on Feb. 5th.
Random shapes: The combination of magnetism and plasma (charged particles that "stick to" those fields) will produce familiar shapes by accident. Today we have a coronal hole that, with some imagination, looks to me, like bird walking across the Sun from right to left! 🙂 Keith Strong vía X
20240201_232704.jpg
Looks like Road Runner to me 😂

roadrunner-03.png
........
SpaceWeatherlive.com
SpaceWeather.com
 
SOLAR CYCLE 25 ACTIVITY REPORT FEBRUARY 03_2024

After the M1.1 class flare from the AR3571 (see previous report) solar activity levels returned to low levels and the strongest event of the period was a C6.4 at 11:35 from an emerging sunspot. AR3571 remains the most active sunspot but its magnetic field is alpha and NOAA forecasts a 15% chance of generating another M-class flare or 1% for X-class flares.
After a few days of traversing the Sun, this filament finally erupted from the Sun’s edge! Eruptions on the edge of the Sun are my favourite, what about you?​

The sun is losing mass!​

Late last night, a beautiful prominence erupted in the northwest, sending a huge blob of solar plasma and magnetic fields into space. Soaring at several million miles per hour, this bubble of solar stuff included about a billion tons of matter. You might be wondering – how can the sun keep losing that much mass and still have enough mass to be a star? Well, a billion tons might be a phenomenal amount of mass, but it’s actually just a drop in the solar bucket. The solar wind – which the sun constantly releases into space – carries away about 1.6 million tons of mass per second. And even that is small compared to the amount of mass the sun loses by turning its stores of hydrogen into energy. Knowing how much of this energy the sun releases into space, we can use Einstein’s famous equation E=mc2 to calculate how much hydrogen mass the sun loses to form this energy: 4.7 million tons per second, or 3.3-with-17-zeros lbs. Think that seems huge? The sun contains 4.4 x 10 to the power of 30 lbs of mass, – that’s 4.4 followed by 30 zeros! So don’t worry – today’s prominence may have fired out a lot of matter, but the sun still has enough to continue for another 5 billion years. EarthSky.org

Three regions left the solar disk and a new one appeared, so there are currently 8 active regions: AR3565, AR3567, AR3570, AR3571, AR3572, AR3573, AR3574 & new region AR3575
hmi200 (1).jpg
AR3566 AR3568 & AR3569

All regions have stable beta magnetic fields except AR3567 which has developed a beta-gamma bipolar magnetic field that harbors energy for M-class flares.​

Total number of sunspots has increased to 131 (51 of these are grouped into 10 active regions) NOAA forecasts for the next 24h: 95% chance for C flares, 25% chance M flares and 5% chance for X flares.

● Auroral Activity

The geomagnetic field has been at quiet (Kp1) levels for the past 24 hours. On February 02 Solar wind speed reached a peak of 373 km/s (Normal speed) at 06:26 UTC. Total IMF reached 4 nT at 00:08 UTC​

Aurora Oval Bz: -1.53 nT South
aurora-map (1).jpg
● Current Conditions at 04:49 UTC on February 03

▪︎ Geospace quiet (Kp 0)
▪Solar wind speed record: 448.5 km/sec (Elevated speed)
▪︎ density: 5.32 p/cm³ (low density)
▪︎ Interplanetary Magnetic Field (IMF)
Bt: 3.24 nT
▪︎ X-ray Solar Flare: C4 0204 UT Feb03
▪︎ Thermosphere Climate Index
today: Warm
▪︎ Neutron Counts today: -1.9% (Low)
▪︎ Sunspot number: 131 (SN 113 February 02)
▪︎ Spotless Days 2023 total: 0 days (0%)
▪︎ A minor stream of solar wind flowing from a coronal hole should reach Earth on Feb. 5th.

.......
SpaceWeatherlive.com
SpaceWeather.com
 
SOLAR CYCLE ACTIVITY REPORT FEBRUARY 04_2024

Solar activity has been at low levels for the past 24 hours. The largest solar event of the period was a C7 event observed at 0554 UTC Following this flare, several C-class flares.

January 2024 in the Sun’s atmosphere, viewed in ultraviolet light by the Solar Dynamics Observatory! A busy month overall (the most active since Sept 2023), but we’ll still 25% lower than activity last June/July! Will things pick up soon? #spaceweather #astronomy Dr. Ryan French vía X

Total number of sunspots has decreased to 123 (45 of these are grouped into 10 active regions)

A new region has appeared in the solar disk, adding to the 8 existing ones: AR3565, AR3567, AR3570, AR3571, AR3572, AR3573, AR3574, AR3575 & new region AR3576
hmi200.jpg
AR3565 has developed a beta-gamma bipolar magnetic field that harbors energy for M-class flares. However AR3575 is the one to watch as of now and next week because it has developed a beta-gamma-delta-class magnetic field that harbors energy to produce strong flares that can be X-class. It is for this reason that NOAA has modified its forecast for the next 24 hours to 99% chance for C flares, 60% chance M flares and 15% chance for X flares. AR3575 is in the strike zone and any strong flares will be geoeffective. It is worth mentioning that the size of AR3575 is 280MH, which exceeds the size of the Earth, which is equivalent to almost 170MH.
chrome_screenshot_3 feb. 2024 22_44_33 GMT-06_00.png

On the other hand, the new region AR3576 also has a considerable size of 200HM and is emerging in the southeast (S17E81) fortunately for our cause it still maintains a stable magnetic field.​
LARGE SUNSPOT COMPLEX COMING OVER SOUTHEAST LIMB. This maybe the return of AR3545. The complex itself is several times larger than the Earth and may well be a naked-eye spot group when it makes it onto the solar disk. The X-ray background has more than doubled so it seems active. Keith Strong vía X​
20240203_223845.png

● Auroral Activity

The geomagnetic field has been at quiet levels for the past 24 hours. Solar wind speed reached a peak of 346 km/s (Normal speed) at 1626 UTC

Aurora Oval Bz: -3.79 nT South
aurora-map.jpg
● Current Conditions at 04:34 UTC on February 04

▪︎ Geospace quiet (Kp 1)
▪Solar wind speed record: 338 km/sec (Normal speed)
▪︎ density: 4 p/cm³ (low density)
▪︎ Interplanetary Magnetic Field (IMF)
Bt: 5.29 nT
▪︎ X-ray Solar Flare: C3 0253 UT Feb04
▪︎ Thermosphere Climate Index
today: Warm
▪︎ Neutron Counts today: -2.4% (Low)
▪︎ Sunspot number: 123 (SN 131 February 03)
▪︎ Spotless Days 2023 total: 0 days (0%)
▪︎ A minor stream of solar wind flowing from a coronal hole should reach Earth on Feb. 5th.

.......
SpaceWeatherlive.com
SpaceWeather.com
 
On the other hand, the new region AR3576 also has a considerable size of 200HM and is emerging in the southeast (S17E81) fortunately for our cause it still maintains a stable magnetic field.
20240203_223845.png

Mr nice no more

New sunspot group assigned AR3576 is turning into view off the southeast limb. The region has produced C-Class solar flares and 3 M-class in six hours.
HERE COMES THE MARTIAN SUNSPOT: A sunspot so big it is visible from Mars (Perseverence saw it last week) is turning toward Earth today. NASA's Solar Dynamics Observatory is watching it emerge over the sun's eastern limb:​
NOAA has designated this sunspot AR3576. Because of its location on the sun's far-eastern limb, we can't yet get a good look at its magnetic field to assess possible instabilities. However, we already know that the active region is cracking with M-class solar flares. That, plus its formidable size, suggests it is a threat for X-flares as well.​

M FLARE! Newly numbered sunspot region, AR3576, if huge! So, I am not surprised it produced an M flare and perhaps larger events to come. The flare peaked at 11:54 UT earlier this morning. It seems to have not produced a significant CME so no effects at Earth.​

THREE M FLARES IN 6 HOURS! This is what we call an active region! Look at all the flares, including 3 M flares and several high C-class flares all from AR3576. We are just beginning to see the region's structure. There seems to be at least 4 major sunspots in the same penumbra.
 
SOLAR CYCLE ACTIVITY REPORT FEBRUARY 04_2024
Dangerous Flooding and 2-5 Feet Of Snow For Cali - 5.1 Mag Quake Oklahoma - Kīlauea Seismic
Premiered Feb 4, 2024

Major Storm for California today! More Aftershocks in Oklahoma. SUN 2/4/2024
TheEarthMaster

Screenshot 2024-02-05 at 05-52-11 TheEarthMaster on X Kīlauea Volcano latest update. Big Calif...png

Hawaii plays down the science of Solar Cycle 25

ISLAND OF HAWAIʻI - This week's Volcano Watch article addresses the concerns of the west-side of the island, where lava was visible when the 2022 Mauna Loa eruption began.
(BIVN) – Mauna Loa is not erupting, and its USGS Volcano Alert Level is at NORMAL. The most recent eruption of the giant Hawaiʻi island volcano occurred in late-November of 2022, and lasted about two weeks. The start of the eruption is the topic of this week’s Volcano Watch article, written by U.S. Geological Survey Hawaiian Volcano Observatory scientists and affiliates.

From the Volcano Watch article:

In the late hours of November 27, 2022, Mauna Loa began erupting. Lava was visible on the west side of the Island of Hawaiʻi, from Kailua-Kona to Waikoloa. Social media was ablaze with pictures and commentary of lava flows descending the west flank toward communities.

This volcanic activity caused anxiety among local residents, and tensions remained high after the USGS Hawaiian Volcano Observatory (HVO) issued a statement that the flows were not a threat to communities and people living on the west side of the island. How could that be? “We see the flows!” was the public’s response.

Past eruptive behavior is an excellent guide to future activity. From past eruptions, we know that lava flows from the Southwest Rift Zone of Mauna Loa can threaten communities in a matter of hours and quickly reach the ocean.
It is the same past behavior that gave HVO the confidence to say that those flows, seen from Kona, were not a threat to folks living on the west side of the island. Let us explain.

Mauna Loa has erupted 34 times since 1843. Each eruption started in Mokuʻāweoweo, and likely the south caldera area; however, there are very few eyewitness observations of the onset of eruptions in the 19th and 20th centuries due to the great distances, high altitude, cold, and lack of water (to name a few).

Trying to sleuth the activity from geologic mapping is confounded by frequent eruptive activity, as old eruptions were covered by new eruptions, obliterating the past eruptive history.

Fortunately, there were some astute observers and intrepid adventurers that hiked to the summit for the 19th and early 20th century eruptions. And in the late 20th century, technology (airplanes and satellites) helped us to document some of the activity.

Based on those observations, we can say with confidence that the activity in the early hours of the 2022 Mauna Loa eruption was similar to some past eruptions. Similar reports from the west side of the island—of flows descending from the south caldera region toward South Kona, as observed in 2022—also occurred in 1851, 1879, 1887, 1897, 1899, 1903, 1907, 1926, 1933, 1940, 1949, 1975, and 1984.
Flows that erupted in the south caldera region, but were not confirmed by visual observations from Kona, include the 1868, 1916, 1919, and 1950.

Flows that are visible high on Mauna Loa’s west flank erupt from the south caldera region of Mauna Loa, outside the topographic depressions of the summit region. Activity in this location is easily visible from south and west sides of the island, which can be alarming. However, none of these previous lava flows in the south caldera region, whether observed or not, traveled far enough to threaten South Kona. Thus, just because folks can see lava from the west side of the island, high on Mauna Loa’s west flank, does not indicate that lava will head south or that Kona will be inundated.

In 2022, monitoring parameters clearly indicated that only the summit region was active in the initial hours, without lava propagating down the Southwest Rift Zone. This is why HVO was confident in issuing a statement that the flows were not a threat to the west side of the island.

Since the south caldera region is often active at the start of eruptions, and lava flows are common, it is important to be aware that this type of activity is normal, and it does not necessarily constitute a threat to communities on the western flank of Mauna Loa. Ultimately, we must wait until Pele decides whether the eruption will move out of the summit and south caldera to determine if it poses a threat.

Eruptions are an inevitable part of Mauna Loa’s future, but the associated hazards can be anticipated by careful documenting of its past behavior as a guide to the future. Additionally, we are increasing our webcam network to include views of the south caldera and upper Southwest Rift Zone regions of Mauna Loa. In the future, we will have near real-time visual surveillance of this portion of the volcano, enhancing our existing monitoring network and aiding us in our primary mission: to issue timely and accurate warnings of hazardous volcanic activity.
 
SOLAR CYCLE 25 ACTIVITY REPORT FEBRUARY 05_2024

Solar activity has been at moderate levels for the past 24 hours. As already reported, the AR3576 region was generating M-class flares in the past hours, in fact there were six flares from that region:​

● M1.4 at 11:53 UTC the flare generated a Minor R1 radio blackout over South Atlantic Ocean
20240204_221834.png

● M1.5 at 16:38 UTC the flare generated a Minor R1 radio blackout over South America
● M1.3 at 17:12 UTC the flare generated a Minor R1 radio blackout over South America
20240204_221959.png

● M1.2 at 20:57 UTC the flare generated a Minor R1 radio blackout over South Pacific Ocean
20240204_222604.png

● M2.1 at 22:28 UTC the flare generated a Minor R1 radio blackout over West Pacific Ocean
● M2.7 at 22:37 UTC the flare caused a Minor R1 radio blackout over West Pacific Ocean
20240204_222731.png
20240204_223111.jpg

A seventh solar flare M1.1 class was produced by the AR3575 region at 18:29 UTC. This region maintains an unstable beta-gamma-delta magnetic field that can produce X-class flares, it has already given us a warning. The flare caused a Minor R1 radio blackout over South America.
20240204_223919.jpg
Total number of sunspots has increased to 138 (58 of these are grouped into 8 active regions) At the moment there are no new regions in the solar disk and the following remain: AR3565, AR3567, AR3570, AR3571, AR3573, AR3574 AR3575 & AR3576
hmi200.gif
AR3572 is gone

NOAA has modified its forecast for the next 24 hours to 99% chance for C flares, 70% chance for M flares and 15% chance for X flares. This is mainly because three regions have developed unstable magnetic fields: AR3565 has a beta-delta-class magnetic field that harbors energy for M-class flares. AR3575 has a beta-gamma-delta-class that harbors energy for X-class flares and AR3576 has a beta-delta-class magnetic field that harbors energy for M-class flares.
600 TH M FLARE! Solar cycle 25 has just produced its 600th M flares since the beginning of the cycle in January 2020. This is more than double the rate of SC24 (286) at the same stage of the cycle's evolution. If there were no more M flares for 2 years, SC25 would still be ahead! Keith Strong vía X​
20240204_225332.jpg

● Auroral Activity

The geomagnetic field has been at quiet levels for the past 24 hours. On February 04 Solar wind speed reached a peak of 449 km/s (Elevated speed) at 1933 UTC. Total IMF reached 9 nT at 1116 UTC
GEOMAGNETIC STORM WATCH--EXTENDED: A CME expected to graze Earth's magnetic field on Feb. 4th did not arrive on time. NOAA forecasters believe it might still be coming. They have extended the watch for G1-class geomagnetic storms through Feb. 5th, just in case. SpaceWeather.com​

Aurora Oval Bz: 0.49 nT North​
aurora-map.jpg
● Current Conditions at 05:57 UTC on February 05

▪︎ Geospace quiet (Kp 1)
▪Solar wind speed record: 404 km/sec (Elevated speed)
▪︎ density: 4.51 p/cm³ (low density)
▪︎ Interplanetary Magnetic Field (IMF)
Bt: 6.54 nT
▪︎ X-ray Solar Flare: Preliminary M2.1 at 04:30 UTC from AR3576 the flare caused a Minor R1 radio blackout over East Indian Ocean
20240204_230243.png
▪︎ Thermosphere Climate Index
today: Warm
▪︎ Neutron Counts today: -2.4% (Low)
▪︎ Sunspot number: 138 (SN 123 February 04)
▪︎ Spotless Days 2023 total: 0 days (0%)

.......
SpaceWeatherlive.com
SpaceWeather.com
 
SOLAR CYCLE 25 ACTIVITY REPORT FEBRUARY 06_2024

Solar activity has been at moderate levels for the past 24 hours. AR3576 that is crackling with M-class flares and in the last 24 hours the region has produced two M-class flares.​

● M2.1 at 04:28 the flare caused a Minor R1 radio blackout over East Indian Ocean
20240204_230243.png

● M1.4 at 06:22 UTC the flare caused a Minor R1 radio blackout over Indian Ocean
20240205_220115.png

Total number of sunspots has increased to 152 (44 of these are grouped into 10 active regions) there are new regions in the solar disk and they are numbered as follows: AR3565, AR3567, AR3570, AR3571, AR3573, AR3574 AR3575, AR3576 & new regions AR3577, AR3578
hmi200.jpg

NOAA has modified its forecast for the next 24 hours to 99% chance for C flares, 60% chance for M flares and 25% chance for X flares. AR3575 continues with a beta-gamma-delta-class that harbors energy for X-class flares and AR3576 has a beta-delta-class magnetic field that harbors energy for M-class flares. All other regions have stable magnetic fields.

● Auroral Activity

The geomagnetic field has been at quiet to unsettled levels for the past 24 hours. On February 05, Solar wind speed reached a peak of 468 km/s (Elevated speed) at 17:57 UTC. Total IMF reached 11 nT at 16:11 which is considered a strong impact to the Earth's magnetic field.

Aurora Oval Bz: 1.25 nT North​
aurora-map.jpg
● Current Conditions at 04:30 UTC on February 06

▪︎ Geospace unsettled (Kp 3)
▪Solar wind speed record: 479 km/sec (Elevated speed)
▪︎ density: 0.35 p/cm³ (low density)
▪︎ Interplanetary Magnetic Field (IMF)
Bt: 8.43 nT
▪︎ X-ray Solar Flare: M2.2 at 02:28 UTC from AR3575 the flare caused a Minor R1 radio blackout over East Indian Ocean.
M4.2 at 03:11 UTC from AR3575 the flare caused a Minor R1 radio blackout over East Indian Ocean
20240205_220324.png
▪︎ Thermosphere Climate Index
today: Warm
▪︎ Neutron Counts today: -2.4% (Low)
▪︎ Sunspot number: 152 (SN 138 February 05)
▪︎ Spotless Days 2023 total: 0 days (0%)

.......
SpaceWeatherlive.com
SpaceWeather.com
 
SOLAR CYCLE 25 ACTIVITY REPORT FEBRUARY 07_2024

Solar activity has been at moderate levels for the past 24 hours. Active region 3675 (S36W78) is leaving the solar disk with two M-class flares in the early hours of February 6th (see previous report), one more during the day and a few minutes ago the strongest one so far.​

● M2.2 at 02:28 UTC from AR3575 the flare caused a Minor R1 radio blackout over East Indian Ocean.
● M4.2 at 03:11 UTC from AR3575 the flare caused a Minor R1 radio blackout over East Indian Ocean
● M1.3 at 18:49 UTC the flare generated a Minor R1 radio blackout over South Pacific Ocean
20240206_221510.jpg
20240206_221514.png

● M5.1 at 03:31 UTC the flare generated a Moderate R2 radio blackout over Australia
20240206_221644.jpg
20240206_221718.png
SOLAR FLARE AND CME (UPDATED): Unstable sunspot AR3575 erupted on Feb. 6th (0311 UT), producing a strong M4-class solar flare. A hot plume of plasma lept away from the blast site faster than 400 km/s (900,000 mph):​
A flash of extreme ultraviolet radiation from the flare ionized the top of Earth's atmosphere, causing a shortwave radio blackout over Australia: map. Ham radio operators and mariners in the area may have noticed loss of signal at frequencies below 30 MHz for as much as an hour after the flare's peak.​
Newly-arriving images from SOHO confirm that the explosion produced a CME:​
This will probably become the 3rd CME this month to narrowly miss Earth. The coronagraph movie, above, shows that the bulk of the storm cloud will sail harmlessly ahead of our planet. However, there is a slight chance of a glancing blow on Feb. 8th or 9th. A speedy Feb 8th impact would bring a chance of minor G1-class geomagnetic storms with high-latitude auroras.​
The total number of sunspots has increased to 175 of which 81 of them are grouped into 11 active regions. The AR3572 region has returned with a beta magnetic field after being an alpha. The regions are as follows: AR3565, AR3567, AR3570, AR3571, AR3572, AR3573, AR3574 AR3575, AR3576, AR3577 & AR3578
hmi200.gif
NOAA maintains its forecast for the next 24 hours at: 99% chance for C flares, 60% chance for M flares and 25% chance for X flares. Sunspots AR3575 & AR3576 have a 'beta-gamma-delta' magnetic field that harbors energy for even stronger X-class solar flares. Therefore NOAA forecasters estimate a 25% chance of such an explosion with these regions.

● Auroral Activity

The geomagnetic field has been at quiet to unsettled levels (Kp3) for the past 24 hours. On February 06 Solar wind speed reached a peak of 493 km/s (Elevated speed) at 02:49 UTC Total IMF reached 10 nT at 2306 UTC

Aurora Oval Bz: 1.49 nT North
aurora-map.jpg
● Current Conditions at 04:48 UTC on February 07

▪︎ Geospace quiet (Kp 0)
▪Solar wind speed record: 472 km/sec (Elevated speed)
▪︎ density: 0.85 p/cm³ (low density)
▪︎ Interplanetary Magnetic Field (IMF)
Bt: 5.53 nT
▪︎ X-ray Solar Flare: M5 0331 UT Feb07
▪︎ Thermosphere Climate Index
today: Warm
▪︎ Neutron Counts today: -2.9% (Low)
▪︎ Sunspot number: 175 (SN 152 February 06)
▪︎ Spotless Days 2023 total: 0 days (0%)

.......
SpaceWeatherlive.com
SpaceWeather.com
 
There must have been a strong flare on the farside of the sun, from SpaceWeather.com :

"
A "FULL HALO" EXPLOSION ON THE FARSIDE OF THE SUN: Yesterday, SOHO coronagraphs recorded a remarkable CME. It was a full halo event:​


"Full halo" means the CME completely surrounds the sun. For comparison, here's a CME that is not a full halo.

When space weather forecasters see a halo CME, they always feel a frisson of excitement. Half of all halo CMEs are heading directly toward Earth--they are bulls-eyes likely to produce a geomagnetic storm. The other half are heading directly away from Earth. Either geometry can make a halo.

This particular halo is heading away from Earth. It was propelled into space by an unseen explosion on the farside of the sun, diametrically opposite our planet. A NASA model of the CME shows it will hit the Parker Solar Probe before splitting in two near the orbit of Mars. No planet is in the line of fire. Maybe next time..."​

The farside's maps for today, there are only two separate active regions, one is huge and very "strong" (see bolded number) :

Top image shows composite map of the Sun in Carrington format.Seismic signature of activity in the far hemisphere is rendered in amber.Line-of-sight magnetogram in the near hemisphere is rendered in blue-gray.

Bottom image identifies "Strong Active Regions (SARs)" recognized in the farhemisphere by the Strong Active Region Discriminator (SARD).​

Composite Map
SAR Map


2024-02-06.5
Far-Side Vantage: CLon = 286.8, Lat = 6.3

Designation Centroid Strength ETA at Days from
Longitude Latitude East Limb East Limb
(degree) (degree) (yyyy-mm-dd.d)

FS-2024-005 326.9 9.1 15353 2024-02-09.8 3.8
FS-2024-009 284.2 27.0 2468 2024-02-13.5 7.5
 
SOLAR CYCLE 25 ACTIVITY REPORT FEBRUARY 08_2024

Solar activity has been at moderate levels for the past 24 hours. Now that AR3575 is about to leave the solar disk, it is AR3576's turn to show what it can generate with its beta-gamma-delta-class composition. For now this huge region with a size of 670 MH (almost 4.5 times bigger than the Earth) has generated a M-class flare.

● M1.3 at 18:05 UTC the flare generated a Minor R1 radio blackout over South America.
20240207_220958.jpg
20240207_220955 (1).png

The total number of sunspots has decreased to 164 of which 68 of them are grouped into 11 active regions as follows: AR3565, AR3570, AR3571, AR3572, AR3573, AR3574 AR3575, AR3576, AR3577, AR3578 & new region AR3579
hmi200.jpg
AR3567 is gone

NOAA maintains its forecast for the next 24 hours at: 99% chance for C flares, 60% chance for M flares and 25% chance for X flares. This is due to the fact that the colossal sunspot AR3576 has developed a beta-gamma-delta magnetic field that harbors energy to generate strong X-class solar flares. On the other hand AR3575 is decaying and has lost its delta component to be left with a beta-gamma magnetic field that can still generate M-class flares.

● Auroral Activity

The geomagnetic field has been at quiet levels (Kp1) for the past 24 hours. On February 07 Solar wind speed reached a peak of 546 km/s (Moderately high speed) at 02:02 UTC Total IMF reached 6 nT at 2110 UTC
POSSIBLE GLANCING-BLOW CME: A CME that left the sun on Feb. 6th might graze Earth's magnetic field on Feb. 9th. If it does not, it will be the 3rd CME in a row that narrowly misses Earth. Third time's the charm? Even a glancing blow could cause a G1-class geomagnetic storm. SpaceWeather.com​

Aurora Oval Bz: 0.39 nT North
aurora-map.jpg
● Current Conditions at 04:30 UTC on February 08

We see that the solar wind velocity is at Elevated levels but with a low density of protons per cubic centimeter affecting the magnetosphere so it remains undisturbed at Kp1 level. The Interplanetary Magnetic Field has a low impact on the Earth's magnetic field at this time so there is a low chance of auroral activity. The last recorded solar flare was a C3 at 01:37 on February 8.​

▪︎ Geospace quiet (Kp 1)
▪Solar wind speed record: 484 km/sec (Elevated speed)
▪︎ density: 0.04 p/cm³ (low density)
▪︎ Interplanetary Magnetic Field (IMF)
Bt: 4 nT
▪︎ X-ray Solar Flare: C3 0137 UT Feb08
▪︎ Thermosphere Climate Index
today: Warm
▪︎ Neutron Counts today: -2.9% (Low)
▪︎ Sunspot number: 164 (SN 175 February 07)
▪︎ Spotless Days 2023 total: 0 days (0%)
▪︎There are no significant coronal holes on the Earthside of the sun

.......
SpaceWeatherlive.com
SpaceWeather.com
 
SOLAR CYCLE 25 ACTIVITY REPORT FEBRUARY 08_2024
The Nemesis Effect (Opinion)
(LQB) Are Earth’s magnetic field excursions/reversals roughly associated with cometary/asteroid impacts to Earth's atmosphere or surface?

A: Not directly related, but often interactive.

Q: (L) So why are they not directly related?

A: Reversals are related to companion star loosely, but other cosmic conditions also interact here.

Q: (L) Does it have anything to do with the way our part of the galaxy bobs up and down above the plane of the ecliptic of the galaxy? Is that more related?

A: Yes

Q: (L) But companion star interactions are related to cometary activity, right?

A: Yes but often long delays.

Q: (Pierre) And there's a reverberation also.

A: Yes

Solar maximum is on the horizon, but when will it occur?
RnYoiqsDo34tf5xU3jmNcJ-970-80.gif

Solar maximum is on the horizon, but when will it occur?(Image credit: NASA/SDO/AIA)
The sun has been gradually gaining strength as it nears its highest rate of activity — solar maximum — during its approximately 11-year solar cycle.

The solar cycle describes a period of solar activity driven by the sun's magnetic field and indicated by the frequency and intensity of sunspots visible on the surface.

But, scientists won't be able to ascertain whether solar maximum has occurred until at least seven months after the fact. We asked ESA's Space Weather Coordination Center's (SSCC) solar expert center why this is the case.

Related: Solar maximum: Why April's total Solar Eclipse will bring unique views of the sun's corona

"The maximum is computed (as a convention) with the 13-month smoothed sunspot number (which means that for each month you use the value of six months before and six months after)," Solar expert center scientists told Space.com in an email. "The exact value of this quantity for time T is known only 6 months later."

Scientists only know if the solar maximum was achieved in a particular month if the next month's sunspot numbers are lower, therefore it is impossible to know earlier than seven months after this decline happens.

For example, let's say solar maximum did occur in February 2024. Scientists would need sunspot number data from the previous six months, the month of February 2024 and the next six months which would take us to August 2024. So we would have to wait until September 2024 to be able to definitively declare that solar maximum had occurred in February 2024.

ESA's solar scientists add that sometimes the sun can fool us; even when we think we have achieved solar maximum, the increased activity turns out to be only what's known as a local maxima, not representative of the entire cycle. Sunspot cycles can also experience a "double maxima," called a Gnevishev's gap, which means that the first peak might not be the highest and another large peak can follow.

All of this means we could have some time to wait before we know exactly when Solar Cycle 25's solar maximum has occurred.

As it stands, predictions from the World Data Center for the Sunspot Index and Long-term Solar Observations (SILSO) at the Royal Observatory of Belgium indicate a maximum between mid-2024 and the end of 2025. Meanwhile, NOAA's Space Weather Prediction Center (SWPC) estimates that solar maximum could occur between late 2024 and early 2026.

B9R8r5HjjKhEz6vTFVo56n.jpg
NOAA's Solar cycle progression as indicated by the sunspot number shows we are approaching the predicted peak in solar activity — solar maximum. (Image credit: NOAA Space Weather Prediction Center)

There is a good chance that solar activity is still on the rise according to the SSCC scientists. This is great news for those wishing to see the northern lights, or aurora borealis,as their occurrence is dependent on solar activity. The more active the sun, the higher the chance of vibrant aurora shows making the next few years the best time to plan a trip to see the northern lights.

Auroras are triggered when energized particles from the sun's solar wind are deflected towards Earth's poles by our planet's magnetic field. The energized particles then interact with atoms and molecules in our atmosphere, depositing energy, causing our atmosphere to fluoresce. The different aurora colors are dictated by the chemical composition of Earth's atmosphere.

If you're unable to see the northern lights during the solar maximum period over the next few years, don't worry. Auroras never stop. They can be seen throughout the solar cycle even during periods of solar activity. This is because weak to moderate coronal mass ejections associated with filament eruptions persist throughout the whole cycle, and maintain the "background" geomagnetic activity that triggers auroras.
Screenshot 2024-02-08 at 07-42-34 Alex Spahn 🌋🌪️☄️ on X A short time ago the third eruption in...png
Screenshot 2024-02-08 at 08-05-43 TheEarthMaster on X Odd Earthquake off Florida coast. Solar ...png

By Robert Lea published about 10 hours ago Snip:
"Maybe there are additional mechanisms generating gamma rays that go beyond the interaction of cosmic rays with the surface of the sun."
If solar scientists aren't already eager to observe the sun as it reaches solar maximum in 2024, a newly discovered gamma-ray puzzle will intensify that desire.

While examining 14 years worth of data from NASA's Fermi space telescope, a team of researchers discovered that during the last solar maximum in 2013 and 2014, the polar regions of the sun blasted out high-energy gamma-ray radiation that was as much as 10 times higher than expected.

The sun is known to shine in all wavelengths of electromagnetic radiation, including gamma rays, but this was expected to be evenly distributed across the solar face. The team that detected high activity in the polar regions currently can't explain this imbalance.

"The study of gamma-ray emissions from the sun represents a new window to investigate and understand the physical processes that happen in the atmosphere of our star," team leader and Institute of Astrophysics and Space Sciences researcher Bruno Arsioli said in a statement.

"What are the processes that create these excesses at the poles? Maybe there are additional mechanisms generating gamma rays that go beyond the interaction of cosmic rays with the surface of the sun."

Related: Solar maximum will arrive sooner and last longer than previously expected, say scientists

Each solar cycle describes periodic changes in the sun's magnetic activity, lasting around 11.5 years and featuring a period of intense activity called solar maximum that sees more sunspots distributed across the sun's face, more solar flares, and more huge outflows of plasma called coronal mass ejections (CME).

The forthcoming solar maximum of the current solar cycle that began in Dec. 2019, solar cycle 25, could help explain why the sun shined brighter in gamma rays at its poles during the peak activity of the last cycle.

Understanding the behavior of the sun at these maximums could help scientists better predict space weather driven by flares and outflows from the sun, which can disrupt power and communication infrastructures here on Earth as well as potentially damage satellites and threaten astronauts.
 
SOLAR CYCLE ACTIVITY REPORT FEBRUARY 09_2024

Solar activity has been at high levels for the past 24 hours. Sunspot 13576 continues to be the most active region, in the past 24 hours has produced a series of M-class flares, however the largest event of the period was a M3.9 from departing sunspot AR3575
BUSY SUNSPOT GROUP: Sunspot region AR3576 has produced a string of major flares, including 8 M flares in the last 3 days (3 today so far). This is a 12-hour movie, not only the bigger flares but also multiple smaller ones.​

● M3.4 at 13:12 from AR3576 UTC the flare generated a Minor R1 radio blackout over South Atlantic Ocean.
20240208_225035.jpg
20240208_224011.png

● M1.1 at 14:18 UTC from AR3464 the flare generated a Minor R1 radio blackout over South America
● M1.7 at 15:23 UTC from AR3576 the flare generated a Minor R1 radio blackout over South America
20240208_224147.png

● M1.3 at 19:02 UTC from AR3576 the flare generated a Minor R1 radio blackout over South Pacific Ocean
20240208_224220.png

● M3.9 at 23:55 UTC from AR3575 the flare generated a Minor R1 radio blackout over West Pacific Ocean
20240208_224755.jpg
20240208_224312.png

GONE BUT NOT FORGOTTEN: Sunspot Region AR3575 rotated over the SW limb earlier today, so is probably 5 -10 deg beyond the limb by now. It just produced a long-duration M4 flare which means this event was likely >2 larger than we observed from Earth as the Sun's limb occulted it.

The total number of sunspots has decreased to 149 of which 61 of them are grouped into 10 active regions as follows: AR3565, AR3571, AR3572, AR3574, AR3576, AR3577, AR3578, AR3579 & new regions AR3580, AR3581
hmi200.jpg
AR3570, AR3573 & AR3575 are gone

NOAA maintains its forecast for the next 24 hours at: 99% chance for C flares, 60% chance for M flares and 25% chance for X flares. This is due to the fact that the colossal sunspot AR3576 has developed a beta-gamma-delta magnetic field that harbors energy for strong X-class solar flares. This active region has also increased the number of sunspots that compose it, reaching 44 in the last 24 hours.
THE "MARTIAN SUNSPOT" IS FACING EARTH: A sunspot big enough to see from Mars is now turning to face Earth. NASA's Perseverance rover on Mars first noticed the sprawling sunspot group last week, photographing it using the rover's MASTCAM. It was a behemoth then, and it has only grown bigger since. Here's how AR3576 looked yesterday from Argentina:​
In fact, the sunspot is even bigger than the picture suggests. There's more of it visible in Poupeau's full frame image. From end to end, the sunspot group stretches more than 150,000 km with at least 4 dark cores larger than Earth. You can see it using ISO-approved eclipse glasses--no magnification required.​
AR3576 is big, yes, but of even greater interest is the sunspot's magnetic complexity. This magnetic map from NASA's Solar Dynamics Observatory shows a mixture of polarities in the sunspot's core:​

In the circled region, positive and negative magnetic polarities are so closely-packed, you may need to look at this unlabeled map to see them clearly. Opposite polarities bumping together can cause explosive magnetic reconnection. Indeed, NOAA forecasters say this sunspot poses a threat for strong X-class solar flares- SpaceWeather.com​

● Auroral Activity

The geomagnetic field has been at quiet levels (Kp1) for the past 24 hours. On February 08 Solar wind speed reached a peak of 661 km/s (Moderately high speed) at 07:35 UTC Total IMF reached 5 nT at 20:45 UTC​

Aurora Oval Bz: 0.25 nT North
aurora-map.jpg
● Current Conditions at 05:20 UTC on February 09

We see that the solar wind velocity remains at Elevated levels with a low density of protons per cubic centimeter. The magnetosphere also remains undisturbed at Kp1 level. A G1 class geomagnetic storm is expected to occur today February 09 due to the passage of a CME produced by AR3575 on February 06.

The Interplanetary Magnetic Field (IMF) has a low impact (4nT) on the Earth's magnetic field at this time so there is a low chance of auroral activity. The last recorded solar flare was a M3.1 at 00:41 on February 9 from AR3575 which is located on the far side of the sun already. The flare generated a Minor R1 radio blackout over West Pacific Ocean.​

▪︎ Geospace quiet (Kp 1)
▪Solar wind speed record: 441 km/sec (Elevated speed)
▪︎ density: 0.03 p/cm³ (low density)
▪︎ Interplanetary Magnetic Field (IMF)
Bt: 4 nT
▪︎ X-ray Solar Flare: M3.1 from AR3575 at 00:41 UTC the flare generated a Minor R1 radio blackout over West Pacific Ocean
▪︎ Thermosphere Climate Index
today: Warm
▪︎ Neutron Counts today: -3.5% (Low)
▪︎ Sunspot number: 149 (SN 164 February 08)
▪︎ Spotless Days 2023 total: 0 days (0%)
▪︎There are no significant coronal holes on the Earthside of the sun

.......
SpaceWeatherlive.com
SpaceWeather.com
 
X-FLARE

At 13:14 UTC a X3.4 flare was recorded affecting worldwide communications on frequencies below 5 MHz. The main affected areas are Africa, South America and the South Atlantic.

Strong R3 radio blackout.

20240209_150615.png
20240209_150712.png

MAJOR X-CLASS SOLAR FLARE: Today at 1314 UT, the sun produced one of the most powerful solar flares in years, an X3.4-class explosion from just behind the sun's southwestern limb. NASA's Solar Dynamics Observatory (SDO) recorded the extreme ultraviolet flash:​
The source of the flare appears to be departing sunspot AR3575. Because the blast site was eclipsed by the edge of the sun, the flare was probably even stronger than its X3.4 classification suggests. This was a big explosion.​
Hours after the flare's peak, Earth is still feeling the effects of the blast. Solar protons energized by the flare are following curved magnetic field lines from the sunspot back to our planet. The resulting hailstorm, called a "radiation storm," is still intensifying at the time of this writing and has just reached category S2:​


This plot shows what NOAA's GOES-18 satellite is seeing right now. The colored lines count the number of energetic protons streaming past the satellite en route to Earth. Green and blue are of special interest because they trace "hard protons" capable of upsetting spacecraft electronics, e.g., causing reboots of onboard computers and temporarily fogging cameras.​
The explosion also hurled a bright CME into space. It will not hit Earth. Instead, a NASA model of the CME shows it is heading for Mercury, Venus and Mars. It will hit all three planets this weekend.​
 
Back
Top Bottom