Will this winter be cold? One parameter indicates so:
You are using an out of date browser. It may not display this or other websites correctly.
You should upgrade or use an alternative browser.
You should upgrade or use an alternative browser.
The Ice Age Cometh! Forget Global Warming!
- Thread starter Gaby
- Start date
Will this winter be cold? One parameter indicates so:
Left picture December 01 2022? Should that read November? That's if this was based on data rather than forecasts or modelling.
If it is November, then that's 15% colder than last December already, so presumably will get colder still by this December.
mrtn
Dagobah Resident
I also wondered, but it seems they are forecasts. You can see the date of the forecast at the top right in the images, and the 'forecasted' date at the top left, I think. It's confusing because the tweet says 'The current Arctic..'.Left picture December 01 2022? Should that read November? That's if this was based on data rather than forecasts or modelling.
I wonder if last years forecast (right) was actually correct.

Arctic Air Arrives in the Central U.S. Late Week
The coldest air of the season so far arrives Thursday night! By Friday morning and into the weekend, many of us will feel temperatures in the single digits and
sometimes exceeded 100 mm in the last 30 hours in #Corse 144.4 mm at Restonica 117.2 mm at Renno 105.4 mm at Ghisoni 94.2 mm at Sartène 92.7 mm in Bocognano 92.1 mm to Figari 83.4 mm at Vivario 50.5 mm in Ajaccio-Milelli 5.2 mm in Bastia
Line-1
Autumn sets in (finally) from Thursday with an oceanic westerly flow. By Saturday it will fall on average: 15 to 30mm of rain along the Pyrenean foothills, and 80mm in the Basque Country. To the east on 11/66, the north wind will dry out the air mass (classic in westerly flow).
https://twitter.com/Meteo_Pyrenees/status/1592799600372756480/photo/1
Line-2
In this context, the snow will be present from the middle mountains (1200-1400m) mainly to the west of the massif on the slopes bordering the foothills. We expect 20/25cm > 1800m on the 64, 5 to 15cm on the center chain and less than 5cm to the east.
I visually recorded 4-1/2 feet of fresh powder (from last Friday) night at the top of Donner Summit CA. while in preparation for the flight out Monday.
This time frame is the preferred window when traveling from the bay area (at about 22:30 hrs.) and a golden hour from the madness on the roads with a nice awe-inspiring vista whereas taking it nice slow in case of unforeseeable ice on the road.
In the meantime, I am back just in time for the onset of a cold fall weekend in the french foothills.
Just like the research shows, the jet stream has gone full tilt and will intensify for the foreseeable future.
We are going through another spell of cold weather, right in the middle of what should be summer with 30C+ temperatures. The Sott has covered it in this article - Southern Tasmania hit with spring snow and heavy rain as cold front moves through -- Sott.net
What caught my attention is the article someone linked in the comments. Its a really good read, a bit long to post here. There is a summary at the end, which I have added below. We understand now that under-water volcanic and out-gassing events eventually lead to global cooling and are seeing a first hand demonstration of that.
 www.severe-weather.eu
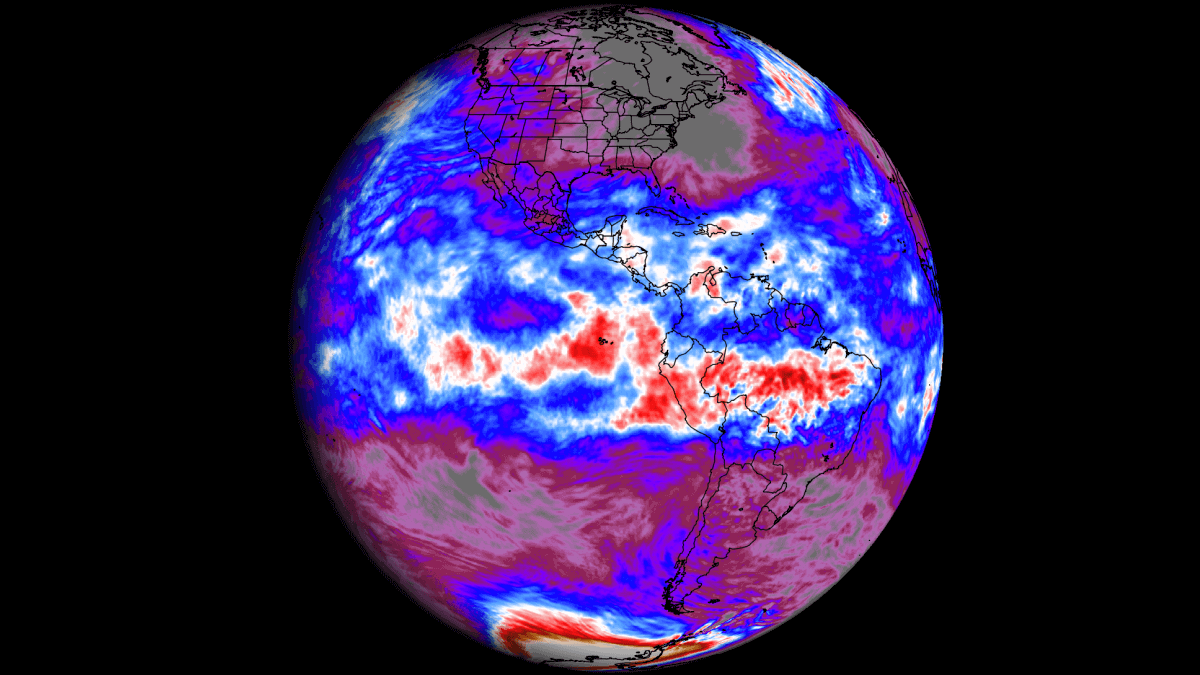
The January eruption of Hunga Tonga in the South Pacific has injected a large amount of water vapor into the stratosphere. That water vapor is now causing significant cooling of the southern stratosphere, continuing into late Fall and early Winter.
We looked at the historical data and found that there is a weak indication of the south stratospheric cooling, coinciding with later stratospheric warming events over the northern hemisphere. But much more research is needed, as other background signals can be at play.
Stratospheric warming during the northern hemisphere winter can mean a heavy disruption of circulation. This causes pressure changes and can unleash cold air from the Arctic into the United States and Europe.
It would make sense for the changes in the stratosphere on the southern side of the planet could also impact the northern hemisphere. As the cooling in the southern hemisphere is substantial, the upcoming winter will be a great real-life “lab test” of the potential global weather changes.
What caught my attention is the article someone linked in the comments. Its a really good read, a bit long to post here. There is a summary at the end, which I have added below. We understand now that under-water volcanic and out-gassing events eventually lead to global cooling and are seeing a first hand demonstration of that.
A significant cooling event continues in the Stratosphere due to the large Water Vapor cloud, but can it impact the upcoming Winter Season?
The strong cooling event continues in the southern stratosphere, potentially influencing the Winter 2022/2023 seasonal weather patterns
www.severe-weather.eu
SUMMARY
The January eruption of Hunga Tonga in the South Pacific has injected a large amount of water vapor into the stratosphere. That water vapor is now causing significant cooling of the southern stratosphere, continuing into late Fall and early Winter.
We looked at the historical data and found that there is a weak indication of the south stratospheric cooling, coinciding with later stratospheric warming events over the northern hemisphere. But much more research is needed, as other background signals can be at play.
Stratospheric warming during the northern hemisphere winter can mean a heavy disruption of circulation. This causes pressure changes and can unleash cold air from the Arctic into the United States and Europe.
It would make sense for the changes in the stratosphere on the southern side of the planet could also impact the northern hemisphere. As the cooling in the southern hemisphere is substantial, the upcoming winter will be a great real-life “lab test” of the potential global weather changes.
cholas
Dagobah Resident
According the Weather Underground for our locale:
Average High(F): 63
Average low: 44
Record low: 27
It's currently 24 (8am) and the last 4 mornings hovered around 20 when I awoke. Four days of record lows and not a word from the media.
Yet if we have a record high one never hears the end of it.
Average High(F): 63
Average low: 44
Record low: 27
It's currently 24 (8am) and the last 4 mornings hovered around 20 when I awoke. Four days of record lows and not a word from the media.
Yet if we have a record high one never hears the end of it.
Ocean
The Living Force
From Benjamin Fulford's Telegram. I'm not sure how accurate it is but I can't help noticing that this was predicted on the Economist's cover in 2017:
Major rivers around the world suddenly dried up at the same time — no one knows why
Something ominous is happening to the world's water reserves, as large lakes and rivers across the planet have suddenly dried up for unknown reasons. Just at the moment when the globalists proclaimed a global food crisis.
— Several sections of the Mississippi River in the USA had to be closed due to record low water levels. A state of emergency has also been declared on the Nile River in Africa due to water shortages.
The Nile is the main source of water not only for Egypt, but also for Sudan, South Sudan and Ethiopia. It is also, like the Mississippi, a vital economic river that supports both agriculture and fishing.
— The Amazon River in South America is another major source of water that is facing severe drought. Flood waters from the Amazon destroyed crops and flooded entire settlements only to subside and make the region drier than it should be. This remains a disastrous situation for Peru, Colombia and Brazil, which depend on the Amazon for hydration and economic activity.
— In Europe, similar drops in the water level are observed on the Rhine, which, like in the Mississippi, made trade through some sections impossible. Europe is also experiencing a major energy crisis, which is compounded by the fact that due to the Rhine situation in Germany, it is difficult to extract coal as a last attempt to avoid a blackout this cold winter.
— The Yangtze River in China, the third longest in the world, is also drying up like others. This creates serious problems for the developing communist regime, which uses the Yangtze for strategic purposes. It is reported that the current state of the Yangtze is a "record" in terms of damage caused by prolonged drought. It also affects river navigation, forcing several large companies to suspend their operations.
— In the southwest of America, the Colorado River basin is also drying up, which puts at risk states such as California, Nevada, Arizona, Colorado, Utah and New Mexico, which depend on this important natural water resource.
— The water level in Lake Mead, which feeds Las Vegas, is constantly falling to levels never seen before since the dam was built. This portends ominous consequences for major cities such as Vegas, Phoenix and the Los Angeles area of Southern California.
— The Indus River in Asia is another source of water that is being depleted, leaving fishermen without means of livelihood. For centuries, the Indus has remained the center of civilization in South and Central Asia, including Pakistan, where plants that feed 220 million people require water from it. (Benjamin


Last edited by a moderator:
Pat
Jedi Master
Are we about to experience DEATH with pestilence, dried rivers and explosion?From Benjamin Fulford's Telegram. I'm not sure how accurate it is but I can't help noticing that this was predicted on the Economist's cover in 2017:
Major rivers around the world suddenly dried up at the same time — no one knows why
Something ominous is happening to the world's water reserves, as large lakes and rivers across the planet have suddenly dried up for unknown reasons. Just at the moment when the globalists proclaimed a global food crisis.
— Several sections of the Mississippi River in the USA had to be closed due to record low water levels. A state of emergency has also been declared on the Nile River in Africa due to water shortages.
The Nile is the main source of water not only for Egypt, but also for Sudan, South Sudan and Ethiopia. It is also, like the Mississippi, a vital economic river that supports both agriculture and fishing.
— The Amazon River in South America is another major source of water that is facing severe drought. Flood waters from the Amazon destroyed crops and flooded entire settlements only to subside and make the region drier than it should be. This remains a disastrous situation for Peru, Colombia and Brazil, which depend on the Amazon for hydration and economic activity.
— In Europe, similar drops in the water level are observed on the Rhine, which, like in the Mississippi, made trade through some sections impossible. Europe is also experiencing a major energy crisis, which is compounded by the fact that due to the Rhine situation in Germany, it is difficult to extract coal as a last attempt to avoid a blackout this cold winter.
— The Yangtze River in China, the third longest in the world, is also drying up like others. This creates serious problems for the developing communist regime, which uses the Yangtze for strategic purposes. It is reported that the current state of the Yangtze is a "record" in terms of damage caused by prolonged drought. It also affects river navigation, forcing several large companies to suspend their operations.
— In the southwest of America, the Colorado River basin is also drying up, which puts at risk states such as California, Nevada, Arizona, Colorado, Utah and New Mexico, which depend on this important natural water resource.
— The water level in Lake Mead, which feeds Las Vegas, is constantly falling to levels never seen before since the dam was built. This portends ominous consequences for major cities such as Vegas, Phoenix and the Los Angeles area of Southern California.
— The Indus River in Asia is another source of water that is being depleted, leaving fishermen without means of livelihood. For centuries, the Indus has remained the center of civilization in South and Central Asia, including Pakistan, where plants that feed 220 million people require water from it. (Benjamin
View attachment 66968
View attachment 66971
Well the only two reasons I can see are that the water either evaporated or....Something ominous is happening to the world's water reserves, as large lakes and rivers across the planet have suddenly dried up for unknown reasons.
....it went underground! Much more interesting.
Chad
The Living Force
From Benjamin Fulford's Telegram. I'm not sure how accurate it is but I can't help noticing that this was predicted on the Economist's cover in 2017:
Just a heads up; whilst Fulford's post may contain some elements of truth, i would beware of him as a source for anything because, as a quick search on the forum will reveal, he's been spouting a lot of nonsense on the internet for years.
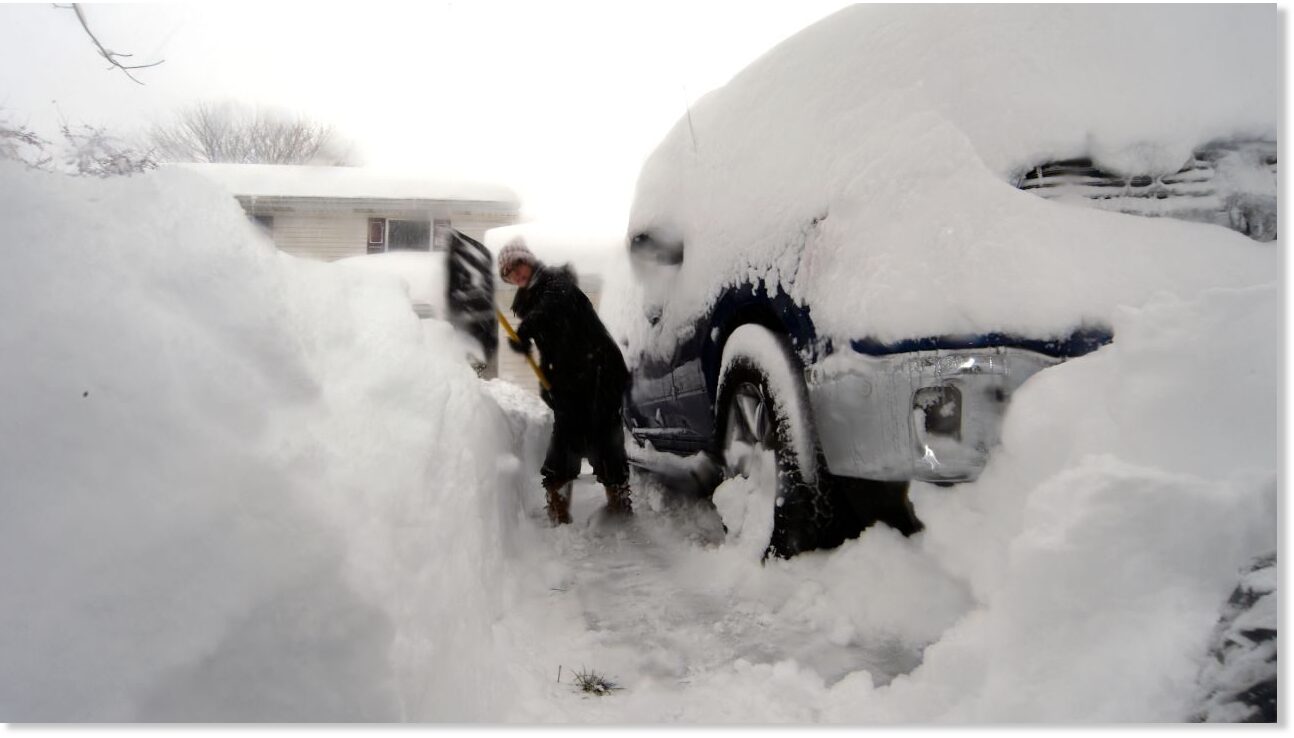
Western New York state slammed with more than 6 feet of snow, triggering road closures and flight cancellations (UPDATE)
New Yorkers in the western part of the state are still being slammed with a massive snowstorm that has shut down roads, triggered driving bans and canceled flights the weekend before the Thanksgiving holiday. By Friday evening, 5.5 feet of snow...
 www.sott.net
By Friday evening, 5.5 feet of snow had covered streets in the town of Orchard Park, New York, near Buffalo in hard-hit Erie County, according to the National Weather Service. As the snowfall intensified, two county residents died from cardiac complications related to shoveling and attempting to clear the grounds, said County Executive Mark Poloncarz.
"We send our deepest sympathies and remind all that this snow is very heavy and dangerous," Poloncarz said.
Forecasters and officials have been sounding the alarm on the life-threatening nature of this snowstorm, which has the potential to be historic even for the Buffalo region where heavy snow is the norm during winter months. And the forceful snowfall is expected to continue through the weekend with little periods of relief.
"Historic snowfall exceeding 4 feet will be possible south of Buffalo, New York. Very cold air will accompany this event with temperatures 20 degrees below normal forecast by the weekend," the National Weather Service wrote Friday.
Areas northeast of Lake Ontario - from central Jefferson County to northern Lewis County - were being inundated with heavy snow late Friday, when the snowfall rate was up to 3 inches per hour, according to the weather service in Buffalo. Places between Watertown and Harrisville were also seeing treacherous conditions.
"Travel will be extremely difficult, if not nearly impossible. ... Visibility will be near zero at times with deep snow cover on roads," the local weather service warned.
Dozens of flights arriving and departing from Buffalo Niagara International Airport were canceled as storm conditions worsened, according to the airport's website.
A new daily snowfall record of 13.9 inches Saturday was set at the airport, nearly doubling the 7.6 inches seen on the same date in 2014, according to the local weather service. This month is also Buffalo's third snowiest November, with 29.3 inches recorded for the entire month, the weather service added.
Heavy snow is expected to continue smashing the Buffalo region early Saturday, with some respite Saturday afternoon as the storm moves farther north. A final bout is expected through Saturday evening and into the overnight hours before snow tapers off early Sunday.
County official: Do not ignore travel bans
The colossal storm has been pounding the region for days, prompting local and state officials to issue states of emergencies to bolster response. But with a storm that big, it only takes one or two vehicles to slow down clearing operations, Poloncarz noted.
"A reminder to all employers: if your business is located in a driving ban area or your employees are currently in a driving ban area, it is illegal to make them come into work," Poloncarz said online.
The snowstorm, which came with a forecast for the Buffalo region not seen in more than 20 years, has been making travel miserable for many drivers, despite authorities' emphasis on staying off the roads.
"I can say that our deputies have been just absolutely inundated with calls for service as it pertains to disabled motor vehicles and stranded motorists," Erie County Undersheriff William J. Cooley said during a news conference Friday night. "We implore the residents to just, please, obey the travel ban, you become part of the problem very quickly when you're out there on the streets."

© John Normile/Getty Image
A loader on Friday digs out a parking lot in Hamburg, New York, after an intense lake effect snow storm dumped several feet of snow around Buffalo and surrounding suburbs.
Erie County issued a combination of travel bans and travel advisories that remain in effect as of 9 p.m. Friday, including a travel ban for the southern portion of Buffalo.
"This is an event that has hit the south towns with a vengeance, very hard and all these communities are in a state of emergency at this point," Poloncarz said.
More than 300 citations were issued to drivers who violated the travel ban, Poloncarz said late Friday.
"Please, do not be the reason that an ambulance cannot get to the hospital," he said. "There are many vehicles that are not only getting stuck but are just being abandoned by the owners."
Poloncarz underscored the danger the storm is unleashing in communities, pointing out the impacts of heavy snow that are exacerbated by sheets of ice underneath it.
"There are vehicles stuck on roads who should not be driving. There are even some snow plows getting stuck in the worst parts of the storm. Do not drive if there is a travel ban," said Poloncarz, adding that most residents have adhered to the ban.
Snow has been falling for an extended period of time at rapid pace, making it difficult for crews to respond.
"In some cases, we are going to far surpass five feet of snow and that's in a 21-hour period of time," said Bill Geary, the county's public works commissioner. "It's a remarkable amount of time."
Blasdell, about eight miles from Buffalo, recorded 65 inches as of 8:30 p.m Friday, according to the National Weather Service. Several locations in the region were hit with at least 3 to 4 feet of snow, including Hamburg (51 inches), Elma (48 inches), East Aurora (43.7 inches) and West Seneca (36 inches).
Last edited:
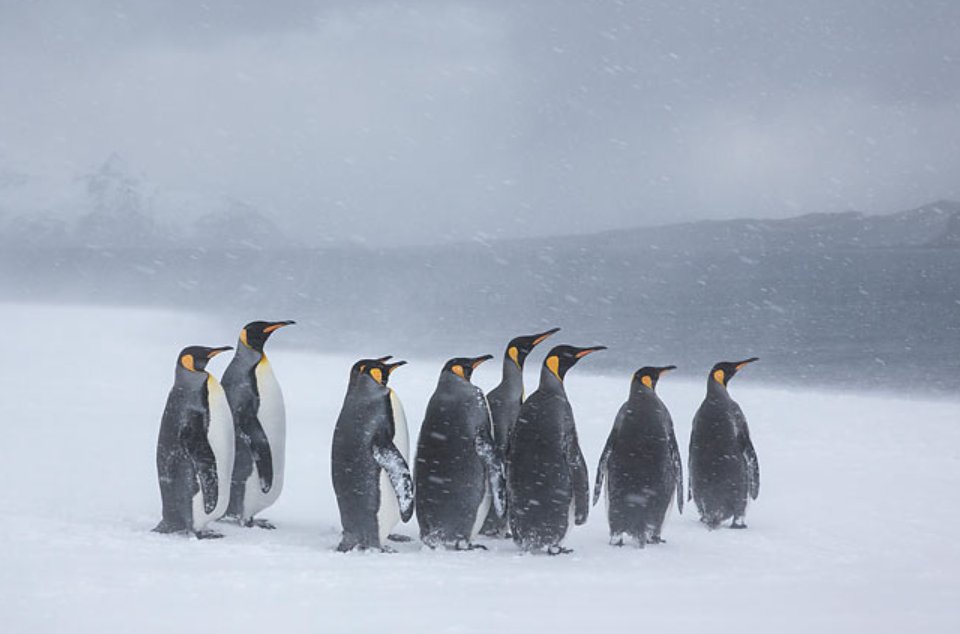
South Pole Hits Record Cold November Temperatures
Extreme cold records continue to tumble at the South Pole. Three recent days – November 16th, 17th and 18th –
 dailysceptic.org
Extreme cold records continue to tumble at the South Pole. Three recent days – November 16th, 17th and 18th – have recorded a daily record, with the 18th plunging to –45.2°C, compared with –44.7°C on the same day in 1987. The records follow the six-month winter of 2020-21, which was the coldest since records began in 1957. Inexplicably, all these facts and trends have escaped reporting in the mainstream media. The excuse might be that it is just weather, and temperatures have always moved up and down. But the excuse doesn’t seem to apply to the July 19th U.K. high of 40.3°C at RAF Coningsby, recorded at the side of the runway used by after-burning Typhoon jets. This record high has barely been out of the Net Zero headlines ever since.
In fact, anything getting colder barely gets a look-in these days. Arctic sea ice is making a significant, near silent comeback. Summer ice at the end of September covered 4.92 million square kilometres, which was 1.35 million sq kms higher than the 2012 low. Over on land, the Greenland ice sheet may have increased in size over the last year to August 2022. Meanwhile, the zoologist Dr. Susan Crockford has reported that this is the fifth year out of the last seven that enough sea ice has formed along the west coast of Hudson Bay by mid-November for hunting polar bears to be able to head out to the ice, “just as it did in the 1980s”.
Of course, it has been a very bad year for climate catastrophists all round. Coral is growing on the Great Barrier Reef with a vengeance, just a few years after journalists and their ‘experts’ warned it was likely to disappear. According to the latest satellite data, the global temperature hasn’t moved for over eight years. A little extra carbon dioxide in the atmosphere has led to significant ‘greening’ of the planet, a process that over the last 30 years has undoubtedly reduced world hunger and famine. Sir David Attenborough recently ran a series of six Frozen Planet II green propaganda films featuring a variety of ‘modelled’ climate catastrophes. Notable was the claim that all the Arctic summer sea ice could be gone by 2035. In addition, he highlighted a colony of Adelie penguins in western Antarctica, whose numbers were said to have fallen over 40 years from 20,000 to just 400 breeding pairs, apparently due to climate change. Missing from the narrative was the more cheerful news that a colony of 1.5 million Adelies had recently been discovered on the eastern side of the continent.
Since all the recent poster scares are fast disappearing, there is increasing emphasis on ‘attributing’ single event bad weather to climate change, or to the climate crisis/emergency/breakdown – the new agitprop words used to disguise the fact that global temperatures, with or without CO2’s help, ran out of steam over two decades ago.
Long-serving Guardian activist Fiona Harvey told a recent edition of the BBC Media Show that writers can be impartial and present the facts, and the facts were that ‘scientists’ have told us that we are on a precipice and are facing tipping points that will make the planet uninhabitable. But whose ‘facts’ is she reporting? Again, as the Daily Sceptic has shown, the command-and-control Net Zero agenda is driven by politicised science and often derived from flawed climate models, corrupt surface temperature databases and invented weather ‘attribution’ stories. When the Guardian quotes ’scientists’, it is often referring to practitioners of observational disciplines such as geography, where modelled ‘impact’ predictions are widely promoted.
In the course of her interview, Harvey repeated the debunked untruth that 30% of Pakistan had been inundated as a result of recent monsoon floods. The actual figure in this mountainous country was easily checked from NASA data and was about 8%. Referring to the general narrative around climate change and the need to keep to 1.5°C of warming, she noted that if that didn’t strike you as a story, “you shouldn’t be a journalist”. A better story, of course, might be asking who invented the 1.5°C figure in the first place – and why?
Many people such as Harvey state they are journalists, not activists, but the evidence is growing that that pass has long been sold in many areas of mainstream communication and media. Cardiff University sociologist Dr. Aaron Thierry argues that universities should allow academics to spend at least 10% of their time on “advocacy and engagement with policy processes”. In his view, “those with the greatest knowledge and understanding of these crises have a moral obligation to provide leadership and engage in advocacy and activism”.
The Australian geologist Professor Ian Plimer gives short shrift to all the lies and obfuscations surround settled climate science. If it had been proved that human emissions of carbon dioxide drive global warming, “there would be endless citation of the dozen or so seminal scientific papers demonstrating this proof”. Instead, he notes, there is a “deafening silence”. Climate cycles have not changed because humans are alive today, “and cannot be changed by feelings, ideology or legislation”. He also noted: “Bearers of validated facts are denigrated, cancelled and deemed controversial by those who have no counterargument, no ability to critically analyse, and who rely on self-interest and feelings.”
Put out in the cold, you might say – just like all those inconvenient South Pole temperature records.
Chris Morrison is the Daily Sceptic’s Environment Editor.

Ice Age Temperatures and Precipitation Reconstructed from Earthworm Granules
New method for determination of past climate data on land applied comparatively for the first time / Ice Age summers in Central Europe were at times warmer than previously known.
New method for determination of past climate data on land applied comparatively for the first time / Ice Age summers in Central Europe were at times warmer than previously known.
Peer-Reviewed Publication
JOHANNES GUTENBERG UNIVERSITAET MAINZ
IMAGE: EARTHWORM CALCITE GRANULES (ECGS) CAN BE FOUND IN LOESS SEQUENCES view more
CREDIT: PHOTO/©: CHARLOTTE PRUD’HOMME
New method for determination of past climate data on land applied comparatively for the first time / Ice Age summers in Central Europe were at times warmer than previously known
Scientists from an international research project led by Johannes Gutenberg University Mainz (JGU) have applied a new method to reconstruct past climate. As they report in the current issue of Communications Earth & Environment, they have determined temperatures and precipitation during the last Ice Age, which peaked about 25,000 years ago, by analyzing earthworm granules. “The new method was discovered at Université Paris 1 Panthéon-Sorbonne and further developed at the Max Planck Institute for Chemistry,” said Dr. Peter Fischer of JGU’s Institute of Geography, who was the lead investigator of the TerraClime project funded by the German Research Foundation (DFG) in which the study is embedded. “In cooperation with other scientists, including researchers from the University of Lausanne and Römisch-Germanisches Zentralmuseum, we used the method to reconstruct the climate at Schwalbenberg near Remagen and Nußloch near Heidelberg.” The two sites form well-developed last-glacial dust deposits. The so-called loess contains sequences dating from 45,000 to 22,000 years before present, in which the earthworm granules with up to about only 2.5 millimeters in size can be found throughout. These calcitic granules, technically known as Earthworm Calcite Granules (ECGs), are secreted daily by earthworms. Using the so-called radiocarbon method, which is based on the decay of the naturally occurring radioactive carbon isotope (14C), researchers can precisely determine their age. Additionally, by analyzing the ratios of stable oxygen and carbon isotopes in the ECGs, it is then possible to reconstruct how warm or how humid it was at the time of their formation.
Summer temperatures were higher than previously thought and humidity was significantly reduced
“Analysis of the data obtained from the ECGs shows that from 45,000 to 22,000 years before present it was much drier in Central Europe than it is today, with up to 70 percent less humidity,” said Dr. Charlotte Prud’homme from the University of Lausanne, the study’s lead author. “This allows us for the first time to quantify previous findings about this period.” The novelty in these investigations on ECGs is that summer temperatures at the time were significantly higher than previously thought. “Although summers during the cold maximum of the last glacial were about four to eleven degrees Celsius colder than today, they were only one to four degrees below the values of short milder climatic phases that occurred during the last glacial,” explained Fischer. “Given these summer temperatures, we cannot exclude that Ice Age human populations may have made a seasonal living in Central Europe during the cold maximum, at a time for which it is generally assumed that humans could not survive here,” added Dr. Olaf Jöris of Römisch-Germanisches-Zentralmuseum, who was also involved in the study.
“Until now, reconstructions of Ice Age climate have been mainly based on the analyses of microorganisms in deep-sea deposits,” stated Fischer. For the continents, corresponding comprehensive data have been lacking so far, which can be changed with the new method: “Since ECGs can be found in many loess sequences, temperatures and precipitation of the past can now be determined on land over a large area. One main aim is to build a database that can be used to precisely quantify past climate changes on land and to identify force feedback mechanisms. Incorporating land-based climate data will increase the database and contribute to improve existing climate modelling and thus provide valuable insights for future climate change.”
The German Research Foundation funded the TerraClime project including the ECG dating with around EUR 400,000.
Related links:
https://gepris.dfg.de/gepris/projekt/337232800?language=en – DFG project “TerraClime” ;
https://gepris.dfg.de/gepris/projekt/439443769?language=en – DFG project for the dating of the ECGs
DOI
10.1038/s43247-022-00595-3
ARTICLE TITLE
Millennial-scale quantitative estimates of climate dynamics in central Europe from earthworm calcite granules in loess deposits
ARTICLE PUBLICATION DATE
21-Nov-2022
Just a month out from the summer equinox down under.
-------------------------------------------------------------------------------------------------------------------------
 www.sott.net
-------------------------------------------------------------------------------------------------------------------------
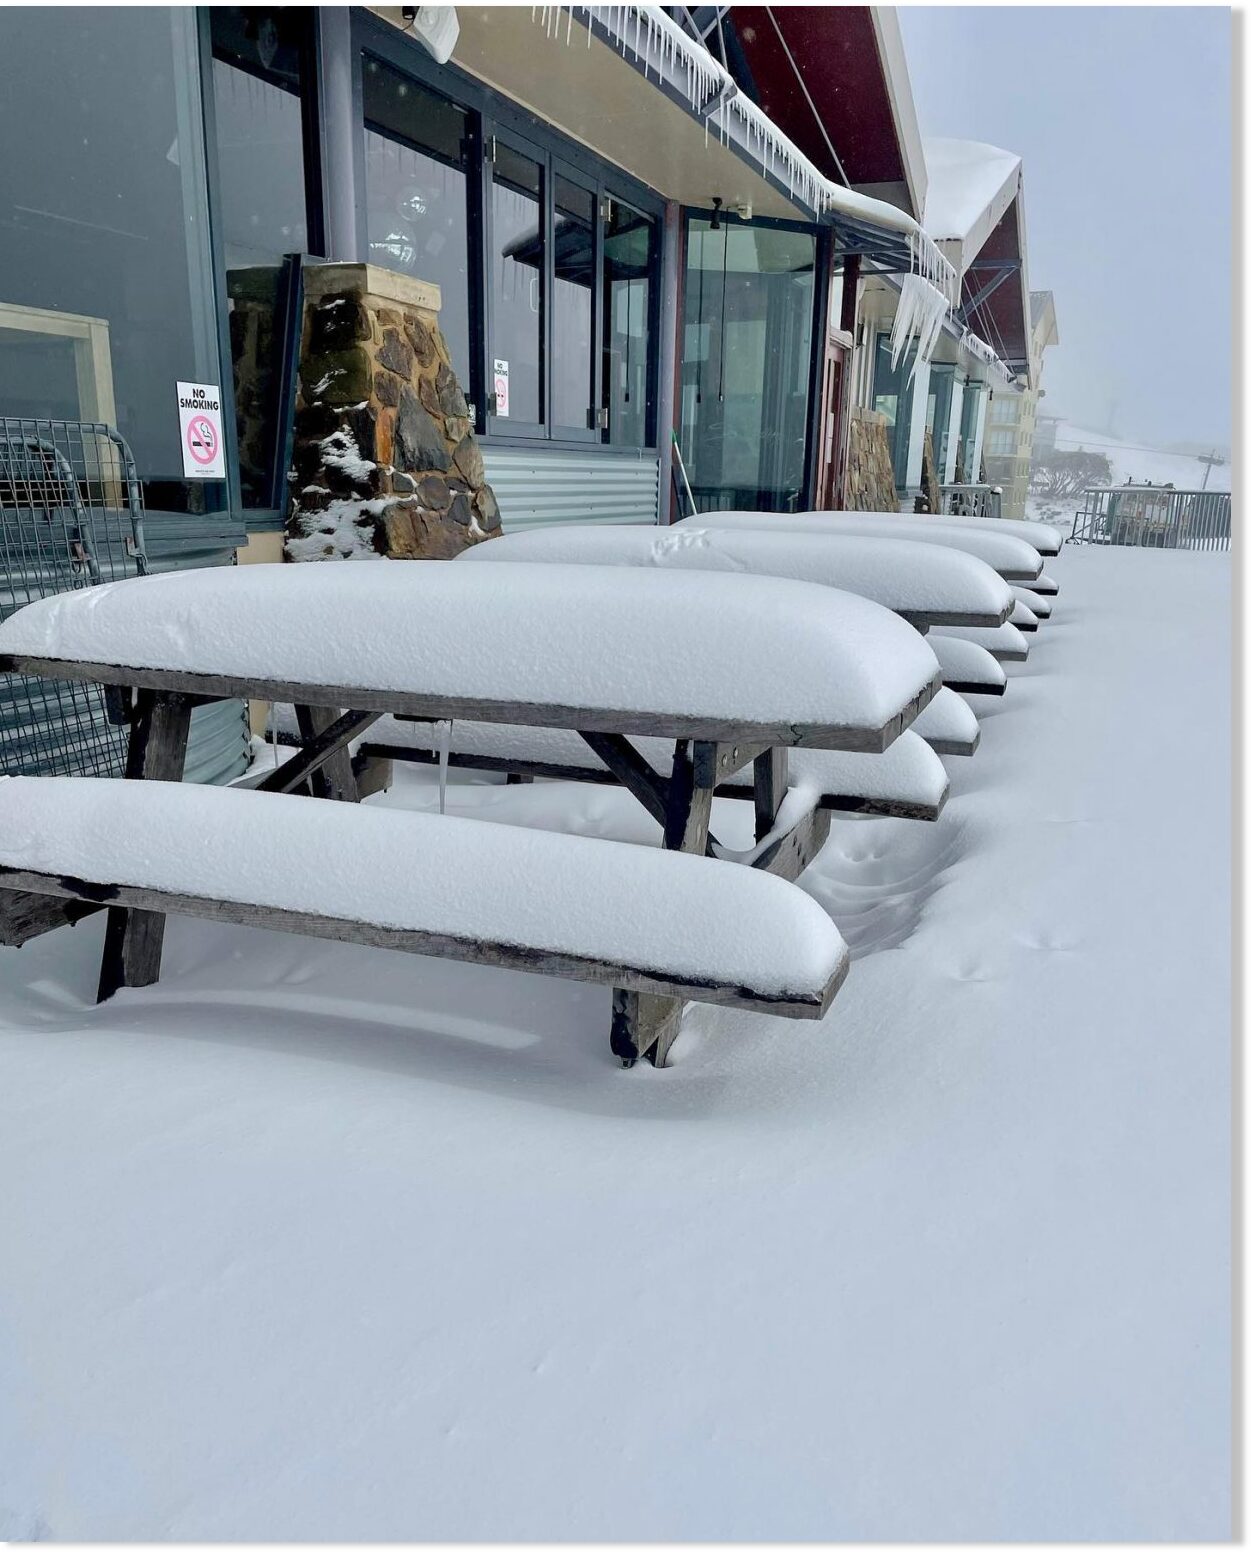
Late heavy spring snowfall in Australia & New Zealand - foot of snow reported
![Hotham_22nd_November_1237x1536[1].jpg](https://cassiopaea.org/forum/attachments/hotham_22nd_november_1237x1536-1-jpg.67196/ "Hotham_22nd_November_1237x1536[1].jpg")
There's been more snowfall for Australia and New Zealand just over a week until the start of meteorological summertime there.
In Australia, where the2022 ski season ended in early October, the latest snowfalls, although among the heaviest yet, follow a series of regular dumps that have continued over the past month.
Ski areas including Falls Creek (pictured below on 22 November), Mt Hotham (above) and Perisher reported 25-30cm (10-12") more snowfall in the past 24 hours.
![falls_Creek_22_November_1140x1[1].jpg](https://cassiopaea.org/forum/attachments/falls_creek_22_november_1140x1-1-jpg.67198/ "falls_Creek_22_November_1140x1[1].jpg")
-------------------------------------------------------------------------------------------------------------------------
Late heavy spring snowfall in Australia & New Zealand - foot of snow reported
There's been more snowfall for Australia and New Zealand just over a week until the start of meteorological summertime there. In Australia, where the2022 ski season ended in early October, the latest snowfalls, although among the heaviest yet,...
www.sott.net
-------------------------------------------------------------------------------------------------------------------------
Late heavy spring snowfall in Australia & New Zealand - foot of snow reported
There's been more snowfall for Australia and New Zealand just over a week until the start of meteorological summertime there.
In Australia, where the2022 ski season ended in early October, the latest snowfalls, although among the heaviest yet, follow a series of regular dumps that have continued over the past month.
Ski areas including Falls Creek (pictured below on 22 November), Mt Hotham (above) and Perisher reported 25-30cm (10-12") more snowfall in the past 24 hours.
Last edited:
Trending content
-

-

-
Thread 'Coronavirus Pandemic: Apocalypse Now! Or exaggerated scare story?'
- wanderingthomas
Replies: 30K