The Ice Age Cometh! Forget Global Warming!

If anyone is interested this is the link to DMI with a graph of the estimated volume of ice sheet over Greenland (buttom graph) with the daily gain og loss (top graph) The latest is:
accumulatedsmb.png

For more detail check http://www.dmi.dk/en/groenland/maalinger/greenland-ice-sheet-surface-mass-budget/
 
Saw this headline yesterday on CBC...

Scientists propose refreezing Arctic in battle against climate change

Project would involve 10 million devices and cost $500 billion US

I propose that they could achieve the same goal and save $500 billion dollars just by waiting a little while... :rolleyes:

http://www.cbc.ca/news/technology/scientists-refreeze-arctic-1.3980429?cmp=rss

A group of researchers has proposed using wind-powered pumps to refreeze the Arctic.

The proposal seems ambitious: it involves 10 million devices deployed over 10 per cent of the Arctic, at a cost of $500 billion US.

Lead author of the paper, astrophysicist Steven Desch, concerned about what some climatologists predict to be an ice-free Arctic by 2030, challenged a group of his students at Arizona State University to develop a method to refreeze the Arctic.

Without ice to reflect sunlight into space, heat continues to be absorbed in the region. This, in turn, causes further warming and accelerates global climate change. While cutting down on carbon dioxide emissions is the solution various companies, researchers and governments are aiming for, Desch was concerned that it wasn't a "real-world" solution.

On paper, the theory works: pumping 1.3 metres of water to the surface would increase the ice's thickness by one metre per decade.

But, as the study notes, there are questions: Would the pumps operate in the harsh Arctic conditions? Could the ice production be scaled over a larger area? And what impact would the use of so many pumps have on the environment? However, Desch said, it's a start to a much-needed conversation.

"We want to provoke discussion, get people thinking about the Arctic in particular, about the need to intervene strongly there, because nothing we do on the world scale is going to be fast enough to save this summer sea ice in the Arctic," Desch said. [...]
 
[quote author= Timótheos]Saw this headline yesterday on CBC...

Scientists propose refreezing Arctic in battle against climate change

Project would involve 10 million devices and cost $500 billion US

I propose that they could achieve the same goal and save $500 billion dollars just by waiting a little while... :rolleyes:[/quote]

lol exactly, the upcoming ice age will do it for free. This is just totally bonkers, I wonder how many climate scientists will lose their job when the Ice Age hits. Allthough, they surely will try to spin it as if it still man-made somehow. They have enough creativity to do so, it's their job after all.
 
Timótheos said:
Saw this headline yesterday on CBC...

Scientists propose refreezing Arctic in battle against climate change

Project would involve 10 million devices and cost $500 billion US

I propose that they could achieve the same goal and save $500 billion dollars just by waiting a little while... :rolleyes:

http://www.cbc.ca/news/technology/scientists-refreeze-arctic-1.3980429?cmp=rss

A group of researchers has proposed using wind-powered pumps to refreeze the Arctic.

The proposal seems ambitious: it involves 10 million devices deployed over 10 per cent of the Arctic, at a cost of $500 billion US.

Lead author of the paper, astrophysicist Steven Desch, concerned about what some climatologists predict to be an ice-free Arctic by 2030, challenged a group of his students at Arizona State University to develop a method to refreeze the Arctic.

Without ice to reflect sunlight into space, heat continues to be absorbed in the region. This, in turn, causes further warming and accelerates global climate change. While cutting down on carbon dioxide emissions is the solution various companies, researchers and governments are aiming for, Desch was concerned that it wasn't a "real-world" solution.

On paper, the theory works: pumping 1.3 metres of water to the surface would increase the ice's thickness by one metre per decade.

But, as the study notes, there are questions: Would the pumps operate in the harsh Arctic conditions? Could the ice production be scaled over a larger area? And what impact would the use of so many pumps have on the environment? However, Desch said, it's a start to a much-needed conversation.

"We want to provoke discussion, get people thinking about the Arctic in particular, about the need to intervene strongly there, because nothing we do on the world scale is going to be fast enough to save this summer sea ice in the Arctic," Desch said. [...]

When I go to sleep at night, I feel comforted that we have these kind of scientists out there working on our behalf... NOT! That is absolutely ridiculous. What are these guys smoking? I think it is just wishful thinking on a funding scheme that would pay them for the next 30 or so years. Nice work if you can get it. Got to spend those carbon dollars somewhere, right?
 
A massive, 1-mile-long (1.6 kilometers) chunk of ice has broken off Antarctica's fast-changing Pine Island Glacier, and NASA satellites captured the dramatic event as the icy surface cracked and ripped apart.

NASA Satellite Spots Mile-Long Iceberg Breaking Off of Antarctic Glacier
http://www.space.com/35746-iceberg-breaks-off-antarctica-pine-island-glacier.html

The Pine Island Glacier is one of the largest glaciers within the West Antarctic Ice Sheet, accounting for about 20 percent of the ice sheet's total ice flow to the ocean, according to NASA scientists. The immense glacier is also one of the least stable, and in recent years, the ice sheet has been quickly retreating and losing massive amounts of ice. Previously, icebergs the size of cities have broken off of the Pine Island Glacier. [Photo Gallery: Antarctica's Pine Island Glacier Cracks]

The glacier's last major iceberg break — an event known as calving — was in July 2015, when an iceberg measuring almost 225 square miles (580 square kilometers) separated from Pine Island Glacier.

The Earth-watching Landsat 8 satellite captured images of the latest iceberg event between Jan. 25 and 29, seeing the progression from the initial crack to the iceberg floating into the bay. Though this latest iceberg is about 10 times smaller than the 2015 event, measuring between 0.6 and 1.2 miles (1 to 2 km), NASA scientists said the recent break shows how fragile the ice shelf is.

"I think this event is the calving equivalent of an 'aftershock' following the much bigger event," Ian Howat, a glaciologist at The Ohio State University, said in a statement. "Apparently, there are weaknesses in the ice shelf — just inland of the rift that caused the 2015 calving — that are resulting in these smaller breaks."

More icebergs may break off of the Pine Island Glacier in the near future. NASA has previously photographed small rifts developing about 6 miles (10 km) from the ice front, and one such rift was observed on Nov. 4, 2016, during one of the agency's Operation IceBridge flights to monitor the region.

Climate change and the warming ocean have been linked to the the retreat and melt of the world's ice. According to Howat, such "rapid fire" calving is generally unusual for the glacier, but West Antarctic glaciers are eroding due to the flow of warm ocean water beneath them. A recent study found that the warming ocean was melting an ice crevasse of the Pine Island Glacier at the bedrock level, melting the glacier from its center.

These warmer ocean waters are causing the Antarctic ice shelf to break from the inside out. As such, scientists expect further calving along the glacier and have warned that the West Antarctic Ice Sheet could collapse within the next 100 years.
 
angelburst29 said:
A massive, 1-mile-long (1.6 kilometers) chunk of ice has broken off Antarctica's fast-changing Pine Island Glacier, and NASA satellites captured the dramatic event as the icy surface cracked and ripped apart.

NASA Satellite Spots Mile-Long Iceberg Breaking Off of Antarctic Glacier
http://www.space.com/35746-iceberg-breaks-off-antarctica-pine-island-glacier.html
[...]

These warmer ocean waters are causing the Antarctic ice shelf to break from the inside out. As such, scientists expect further calving along the glacier and have warned that the West Antarctic Ice Sheet could collapse within the next 100 years.


Not sure about the exclusiveness of their explanation, although it may be a part of it. The other part might be seismic in nature that we don't often hear about, like this research/monitoring from 2010/11:


There’s Boiling Magma Beneath the Antarctic Ice, And It Could Burst Out at Any Time

Swarms of earthquakes beneath the Antarctic ice could be signs of an impending volcanic eruption

image: http://blogs.smithsonianmag.com/smartnews/files/2013/11/11_18_2013_executive-committee-e1384788595912.jpg

The tip of Antarctica’s Mount Sidley, part of the Executive Committee Range. Photo: U.S. Navy / Wikimedia Commons

There’s a whole world trapped deep beneath Antarctica’s vast ice sheets. There are glaciers that reach nearly three miles high. There are rivers and lakes that are filled with life. There are mountain ranges. There are volcanoes.

And every once in a while, a massive volcanic eruption will punch through the ice. As far as we know, the volcanoes that dot Antarctica’s ridiculously-named “Executive Committee Range“ haven’t seen an eruption in around 8,000 years. But according to new research the area is stirring: observations of a series of earthquake swarms suggest that the magma is moving.

In 2010 and 2011, a team of researchers, led by Washington University graduate student Amanda Lough, detected bursts of seismic activity—at least 1,370 earthquakes centered deep beneath Antarctica’s Marie Byrd Land in the continent’s West Antarctic Ice Sheet. “We interpret the swarm events as deep long-period earthquakes based on their unusual frequency content. Such earthquakes occur beneath active volcanoes, are caused by deep magmatic activity and, in some cases, precede eruptions,” the scientists write in their study.

The sighting of the earthquake swarms isn’t a guarantee of an impending eruption, they say. But swarms have been seen in advance of eruptions before, like in 1991′s Mount Pinatubo eruption. The earthquakes are caused by the changes in pressure exerted on the subsurface rock as magma moves around, deep within the Earth.

If volcanic activity were to start, says Lough and her team, it would take a wildly powerful eruption to cut all the way to the surface—the ice in the area is more than a half-mile thick. Even a small eruption, though, could be important, as it would likely melt a bunch of the western ice sheet, contributing to sea level rise or creating a layer of water along the bottom of glaciers, making it easier for ice to slide into the sea.
 
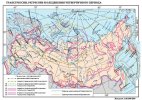
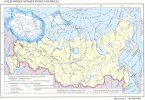
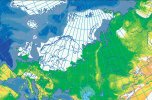
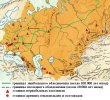
Here are a few illustrations of the extend of the ice sheet over Northern Eurasia during the last period of glaciation:
http://map.igras.ru/files/bl..2011.04.28.14.36.07..7.jpg
http://www.landscape.edu.ru/images/maps/fgr/rus_atlas_quaternary_glaciation.jpg
http://ice.tsu.ru/files/paul/files/paul/Jur.jpg
http://www.bizslovo.org/content/images/stories/torop/istoriya/karta1_ru.jpg
I thought the Russians might have some more details than the usual Wikipage and sure enough.
 

Attachments

  • bl..2011.04.28.14.36.07..7.jpg
    bl..2011.04.28.14.36.07..7.jpg
    105.4 KB · Views: 304
  • rus_atlas_quaternary_glaciation.jpg
    rus_atlas_quaternary_glaciation.jpg
    1.6 MB · Views: 311
  • Jur.jpg
    Jur.jpg
    186.2 KB · Views: 285
  • karta1_ru.jpg
    karta1_ru.jpg
    64.5 KB · Views: 281
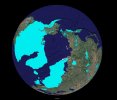
In the last post, I left out some folks, here we go, this own shows the Northern hemisphere, but it does not cover all the seas, or is is just that tilt of the Earth shifted?
http://ice.tsu.ru/files/paul/WorldLGMr.jpg
 

Attachments

  • WorldLGMr.jpg
    WorldLGMr.jpg
    227.6 KB · Views: 283
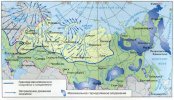
This map shows how the ice moved over Northern Eurasia http://doklad-referat.ru/public/page_images/729/77.jpg The extend of the ice is somewhat larger than previously shown, perhaps it refers to a different ice age. Irrespective of the extend of the ice sheet, the tendency will be to move from the areas of higher altitude towards areas of less altitude. Since mountains get snow first and are colder in summer, this is were the ice will pile up. What is great about this map is that one can see where modern day towns are, so if one is in Volgograd, Samara, Yekatarinburg, Omsk, Novosibirsk, or Chelyabinsk there will be no skiing in summer :)
 

Attachments

  • 77.jpg
    77.jpg
    155.1 KB · Views: 45
thorbiorn said:
In the last post, I left out some folks, here we go, this own shows the Northern hemisphere, but it does not cover all the seas, or is is just that tilt of the Earth shifted?
http://ice.tsu.ru/files/paul/WorldLGMr.jpg

Earth shift is a definite possibility. Do you know to what period (which ice age) this ice cover model refers to?
 
Pierre said:
thorbiorn said:
In the last post, I left out some folks, here we go, this own shows the Northern hemisphere, but it does not cover all the seas, or is is just that tilt of the Earth shifted?
http://ice.tsu.ru/files/paul/WorldLGMr.jpg

Earth shift is a definite possibility. Do you know to what period (which ice age) this ice cover model refers to?

Here is an article in English with this image: _http://www.qpg.geog.cam.ac.uk/lgmextent.html

This map for the northern hemisphere Last Glacial Maximum (Weichselian, Valdaian, Würmian, Devensian, Wisconsinan, MIS 2) was compiled by Jürgen Ehlers for 2005 from data and maps assembled and published in the books Quaternary glaciations - Extent and Chronology by Jürgen Ehlers & Philip Gibbard (Elsevier, 2004). A second map compiled plotted onto a Google Earth north polar view is now available below in static form but it is planned to make these maps interactive with Google Earth shortly.

thorbiorn said:
This map shows how the ice moved over Northern Eurasia http://doklad-referat.ru/public/page_images/729/77.jpg The extend of the ice is somewhat larger than previously shown, perhaps it refers to a different ice age. Irrespective of the extend of the ice sheet, the tendency will be to move from the areas of higher altitude towards areas of less altitude. Since mountains get snow first and are colder in summer, this is were the ice will pile up. What is great about this map is that one can see where modern day towns are, so if one is in Volgograd, Samara, Yekatarinburg, Omsk, Novosibirsk, or Chelyabinsk there will be no skiing in summer :)

Here is original article (in Russian).

It mentions Quaternary period as well.

And here is more digital high resolution maps: _http://booksite.elsevier.com/9780444534477/digital_maps.php
 
thorbiorn said:
This map shows how the ice moved over Northern Eurasia http://doklad-referat.ru/public/page_images/729/77.jpg The extend of the ice is somewhat larger than previously shown, perhaps it refers to a different ice age. Irrespective of the extend of the ice sheet, the tendency will be to move from the areas of higher altitude towards areas of less altitude. Since mountains get snow first and are colder in summer, this is were the ice will pile up. What is great about this map is that one can see where modern day towns are, so if one is in Volgograd, Samara, Yekatarinburg, Omsk, Novosibirsk, or Chelyabinsk there will be no skiing in summer :)

Thanks for sharing, Thorbiorn.

Here's also another map:

SGEdxZ9.jpg


showing the maximum extent of glaciers in the Early Pleistocene (blue line) and the Middle Pleistocene (red line).
 
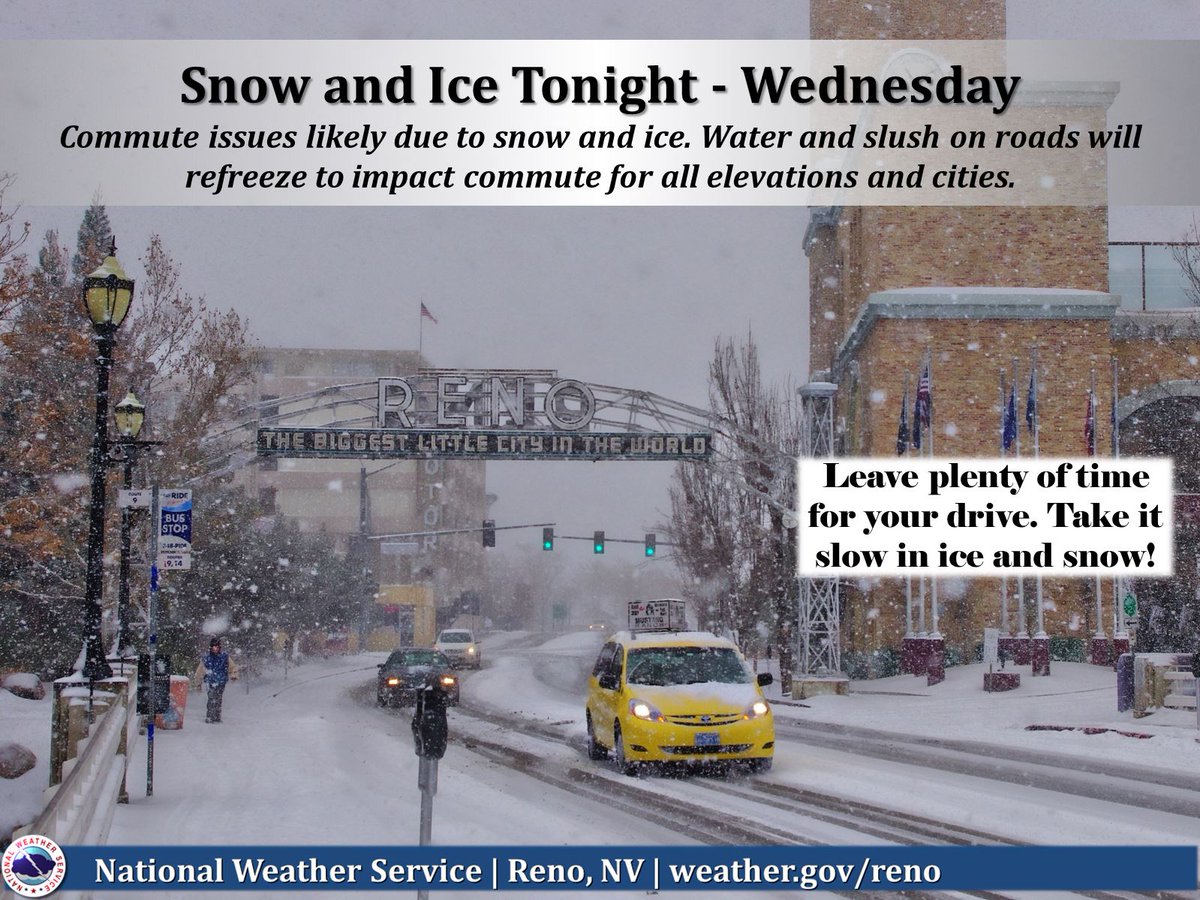
Reno, Nv.
Dan Collins‏@collinds06 Feb 20
https://twitter.com/collinds06/media
C5Kg_SiUMAA55Fz.jpg

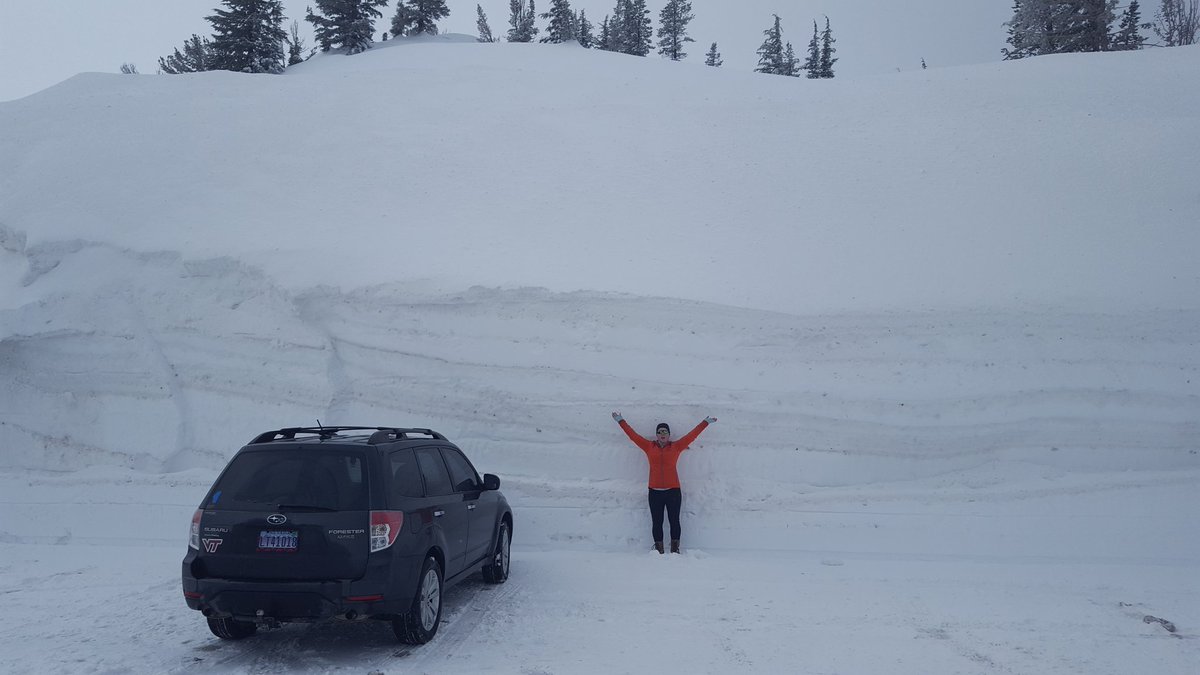
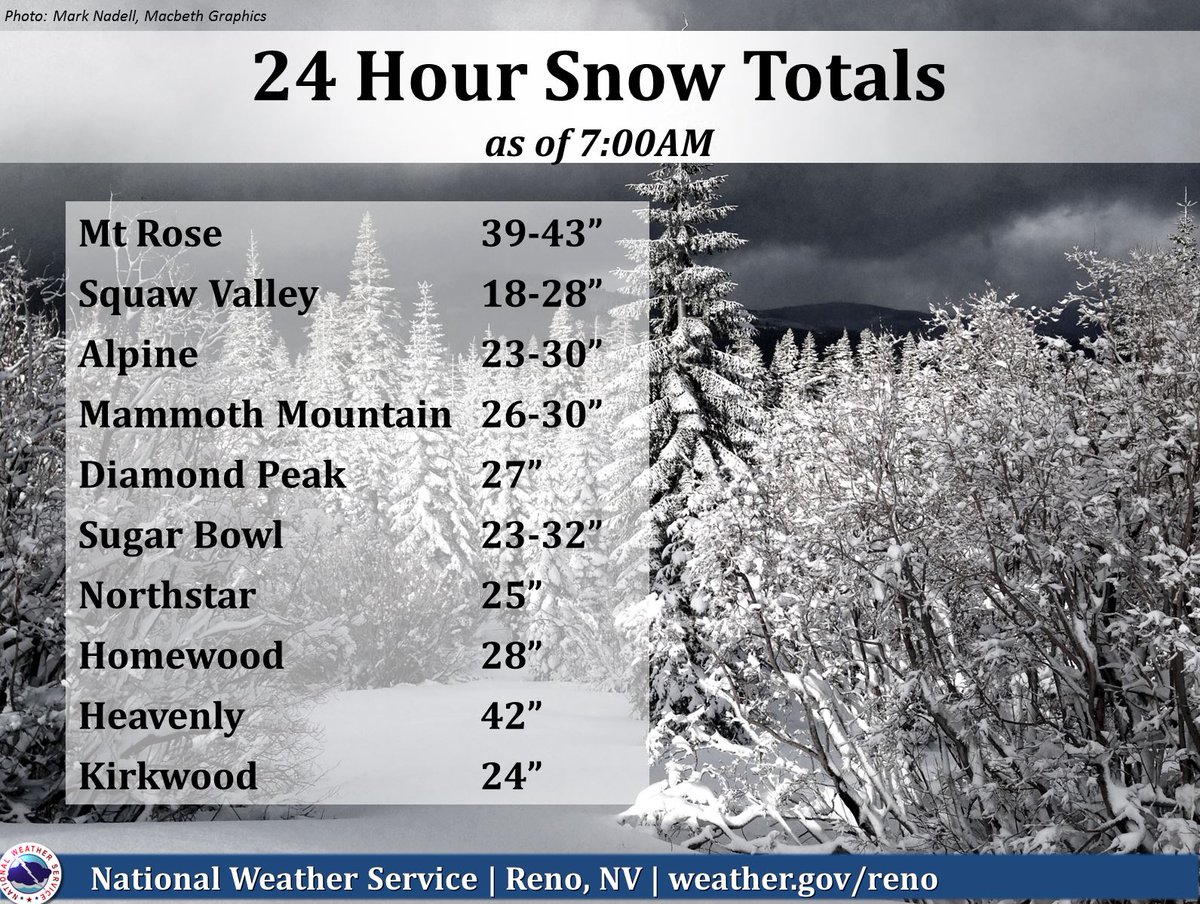
@NWSReno @JimCantore @ReedTimmerAccu @findOpenSnow @breakingweather Top of Mt. Rose Highway 2.19.2017. Crazy amounts of snow with more today

1-22-17 2-hrs ago
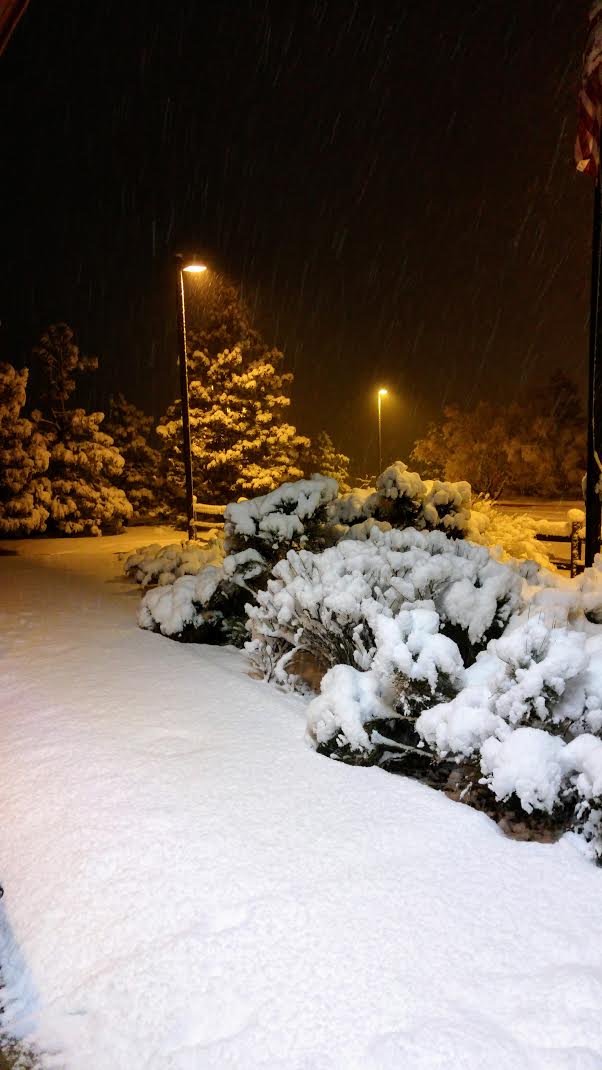
Snow continues to fall with road conditions worsening as temps fall. Remember to allow extra time for the commute in the morning! Be safe!
C5P3ELNVMAEcWa_.jpg

https://twitter.com/NWSReno/status/834282186887032832
Comments:
MarketingGoddes‏@MarketingGoddes 2h2 hours ago
@NWSReno wow. SNOWmaggeden. Just like Idaho this year, Keep it there pretty please. #nomoresnow.
C5Nsb9HVcAAyLla.jpg

C5MmU_VUkAMi_ff.jpg


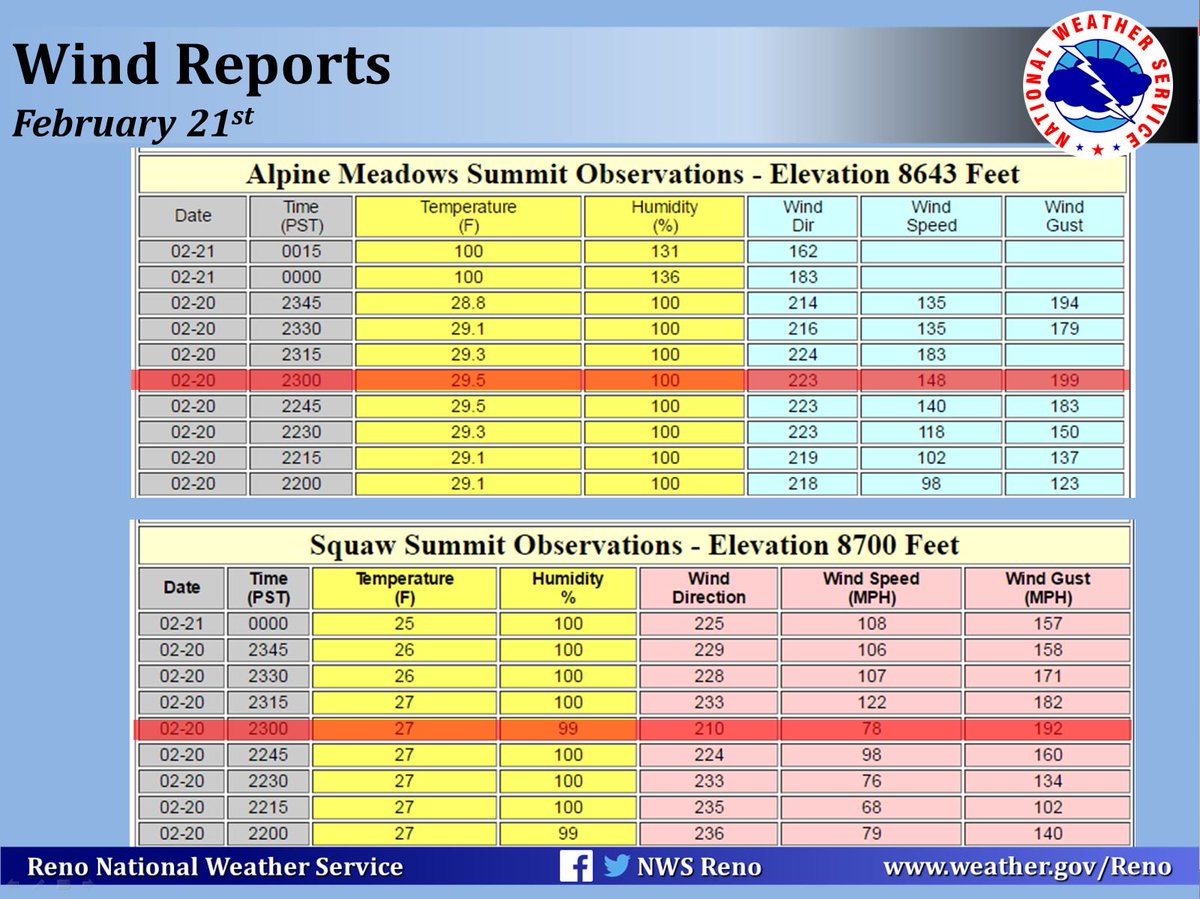
Category F-1 and F-2 winds Feb. 21, 17
Holy wind! Observations from the top of Squaw Summit. Yes...those gusts to 177 mph are for real!
C5MMVBDUcAAWyEH.jpg
 
Severe weather conditions in Spain and Italy, including snowfall and flooding, have resulted in vegetable shortages in countries that rely on importing from these locations at this time of the year. The UK has been one of them and I certainly have been struggling to buy my veggies over the last couple of weeks. This prompted me to check what was going on and I found a couple of articles that talk about this. Some of them are 'entertainment media sources' (aka tabloids) but I can confirm that what they are describing is in fact visible on supermarket shelves. Apparently these problems are expected to last until April - June 2017.

http://www.bbc.co.uk/news/uk-38666752
Anyone trying to stock their kitchen full of vegetables may have noticed a shortage of their favourite greens or salad items.
It started last month with some supermarkets having problems stocking courgettes and spinach, while iceberg lettuce is now being rationed by some chains.

Retailers have blamed empty shelves on bad weather in Spain and Italy.

Why are we facing a shortage?
A combination of flooding, cold weather and poor light levels in southern Europe is said to have created the "perfect storm" of poor growing conditions.
During the winter months, Spain's south-eastern Murcia region supplies 80% of Europe's fresh produce. But after suffering its heaviest rainfall in 30 years, only 30% of Murcia's growing fields are useable.

This has coincided with a cold snap in Italy, which normally exports vegetables at this time of the year but is now having to import them.
The effects of shortages are particularly pronounced in Britain, which imports an estimated 50% of its vegetables and 90% of its fruit.
The Grocer magazine's fresh and chilled foods editor, Kevin White, told the BBC he could not recall the weather affecting supplies so severely. (...)

https://www.thesun.co.uk/news/2773682/vegetable-rationing-lettuce-broccoli-courgettes-supermarkets-uk/
VEGETABLES are being rationed in supermarkets across the UK after storms and snow in Spain decimated crops, causing a supply shortage.

Signs warning customers they can only buy limited numbers of certain items have sprung up in stores, while online shoppers are unable to order basic vegetables such as lettuces as they are out of stock. And there are fears the severe shortage could lead to a European trade war – with industry experts warning the UK could end up with nothing if France and Germany are prepared to pay more for their veg.

The drought began with aubergines and courgettes, but customers can expect shortages of iceberg lettuce, baby spinach, mixed leaves, rocket, lollo rossa, cauliflower, broccoli, peppers, cucumbers, tomatoes, lemons, and oranges, reports the Daily Mail.

Morrisons has imposed a limit of three heads of broccoli and three iceberg lettuces per customer throughout its 492 stores. And some Tesco stores are also displaying signs capping lettuces at three per person.

Earlier this month, The Sun Online was the first publication to report about shortages of courgettes due to the bad weather in Spain. Storms and snow in parts of Spain, including the southern eastern area of Murcia, are to blame for supply problems with crops. The region produces 80 per cent of vegetables sold in the UK during winter.

Italy has also been affected by a cold snap, meaning the region is having to import more produce that it would expect at this time of year. Industry experts told this newspaper that supply shortages of courgettes could continue until June at least.

While the availability of tomatoes, peppers, broccoli and lettuce may be tight until at least May.

(...)

Industry experts warned Britain could end up fighting with its European rivals to snap up the limited supply of veg from the Mediterranean.

British Leafy Salads Association (BLSA) spokesman Dieter Lloyd said: “If the German or French markets are prepared to pay more for the product, we could end up with nothing.

“These difficult trading conditions are set to continue into February and March.” He said contingency supplies were expected to be flown in from the US but this was an “expensive solution”.

(...)

Flooding, plummeting temperatures and poor light are said to have created a “perfect storm” which is to blame for the poor crop.

Spain’s south-eastern Murcia region – estimated to supply 80 per cent of the continent’s fresh produce in winter – has experienced the heaviest rainfall seen in 30 years. Italy, which normally exports vegetables at this time of year, is being forced to import after unusually cold temperatures took their toll on crops. And the Spanish regions of Andalucia and Valencia have also seen a dramatic dip in production.

Philippe Binard, of produce industry forum Freshfel Europe, told the BBC the problems crippling agriculture were unprecedented. Production levels of some crops had dropped by as much as 25 per cent, with prices rising by between 25 and 40 per cent, he said.
 
Altair said:
Pierre said:
thorbiorn said:
In the last post, I left out some folks, here we go, this own shows the Northern hemisphere, but it does not cover all the seas, or is is just that tilt of the Earth shifted?
http://ice.tsu.ru/files/paul/WorldLGMr.jpg

Earth shift is a definite possibility. Do you know to what period (which ice age) this ice cover model refers to?

Here is an article in English with this image: _http://www.qpg.geog.cam.ac.uk/lgmextent.html

This map for the northern hemisphere Last Glacial Maximum (Weichselian, Valdaian, Würmian, Devensian, Wisconsinan, MIS 2) was compiled by Jürgen Ehlers for 2005 from data and maps assembled and published in the books Quaternary glaciations - Extent and Chronology by Jürgen Ehlers & Philip Gibbard (Elsevier, 2004). A second map compiled plotted onto a Google Earth north polar view is now available below in static form but it is planned to make these maps interactive with Google Earth shortly.

Thanks for finding the answer.

The model suggests a North geographic pole located in Canada during the last glacial maximum. At the end of this ice age (around 12500 BCE), a comet might have hit Hudson Bay, this comet following an almost tangential trajectory and travelling towards the South-East could have shifted the North pole to a position closer to its current one.

That might explain why during the younger dryas (c. 12500 BCE), most regions experienced a sudden cooling except Northern America (because it moved away from the pole). It would also explain the location and orientation of the Carolina Bays (South East of Hudson Bay).
 
Back
Top Bottom