From another thread, cross referenced Svensmark theory (interesting graphic here) after reading from Dr. Tim Ball:
In reading the article by Dr. Tim Ball 'No Scientific Basis for Canadian Carbon (CO2) Tax plan' the other day, which deconstructs the general arguments in the main. He brings up Svensmark.
People sometimes send me stuff on 'climate change' - mostly funny graphs or poor arguments on AGW to bolster its case. They never mention the Sun and other cosmic matters, though, as that would get in the way of the narrative. If not mistaken, the AGW crowd likes to keep the whole bag in the lower atmosphere - that's it, that's all. I sometimes ask people about the other influences, usually without response, although they might blink a few times and change the subject.
Tried an experiment related to what kids would find out today, what they study of the climate. I know many people were always taught, that that bright thing in the sky and space itself, well it's a bid deal. So, Googled 'Why is the sun not a factor in climate models?' and the very fist reference, for me anyway, is Ruled Out | A Student's Guide to Global Climate Change | US EPA (aka Environmental Protection Agency).
Being that this is from 2017, I was a bit surprised it was still there (re a new government who had pulled out of the Paris Accord).
The link is a 101 Q&A guild for kids (poor kids). Perhaps it i used extensively in school curriculum today, not sure (maybe some peeps with kids can reaffirm or not)
Here is how the info-test went. As for the sun, their answer is 'Ruled Out’ in the Q&A:
You can then take their “Climate Challenge’ by picking either the Sun, the Earth's Orbit or Volcanoes. I’ve picked the everyday visual one, the Sun.

Going back to Dr. Ball, he provides an interesting review of the Sun in this article Svensmark’s Cosmic Theory Confirmed; Explains More Than Solar Role in Climate Change
Here is how Ball explains it:
No 'comet dust' talk, yet he offers his take on it from the CT papers.
In the Canadian article - which is not new here for many, Ball points out (here starting with a political note):
So, it's "justice and equality" and taxes of course.
Probably a good idea to monitor our kids (if you have any) homework. The problem is that if parents try and help with the revisionist Q&A homework, the kids will get an 'F' and the parents will likely be asked to come to a parent teacher interview and explain.
There are a great many programs running, yet I've never seen one so coordinated and entrenched as this AGW one - from kindergarten to university to old age.
Here is a good graphical summary of Henrik Svensmark’s theory: Effects of galactic cosmic ray flux on Earth climate and biological diversity.
Original article here : _A stellar revision of the story of life
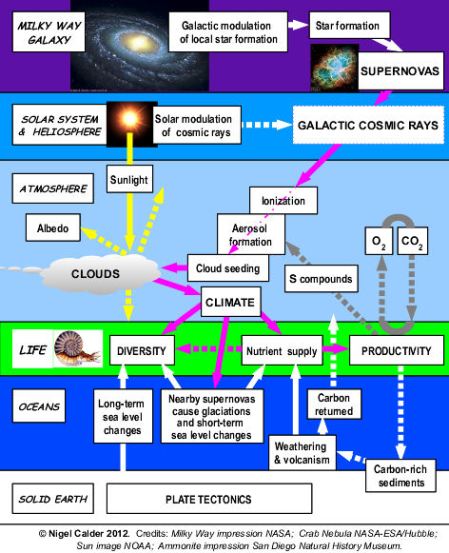
Cosmic rays in action. The main findings in the new Svensmark paper concern the uppermost stellar band, the green band of living things and, on the right, atmospheric chemistry. Although solar modulation of galactic cosmic rays is important to us on short timescales, its effects are smaller and briefer than the major long-term changes controlled by the rate of formation of big stars in our vicinity, and their self-destruction as supernovae. Although copyrighted, this figure may be reproduced with due acknowledgement in the context of Henrik Svensmark's work.
In reading the article by Dr. Tim Ball 'No Scientific Basis for Canadian Carbon (CO2) Tax plan' the other day, which deconstructs the general arguments in the main. He brings up Svensmark.
People sometimes send me stuff on 'climate change' - mostly funny graphs or poor arguments on AGW to bolster its case. They never mention the Sun and other cosmic matters, though, as that would get in the way of the narrative. If not mistaken, the AGW crowd likes to keep the whole bag in the lower atmosphere - that's it, that's all. I sometimes ask people about the other influences, usually without response, although they might blink a few times and change the subject.
Tried an experiment related to what kids would find out today, what they study of the climate. I know many people were always taught, that that bright thing in the sky and space itself, well it's a bid deal. So, Googled 'Why is the sun not a factor in climate models?' and the very fist reference, for me anyway, is Ruled Out | A Student's Guide to Global Climate Change | US EPA (aka Environmental Protection Agency).
Being that this is from 2017, I was a bit surprised it was still there (re a new government who had pulled out of the Paris Accord).
The link is a 101 Q&A guild for kids (poor kids). Perhaps it i used extensively in school curriculum today, not sure (maybe some peeps with kids can reaffirm or not)
Here is how the info-test went. As for the sun, their answer is 'Ruled Out’ in the Q&A:
"Many factors, such as the sun, the Earth's orbit, and sometimes even volcanic eruptions, can affect the Earth's climate. Scientists use climate models to look at all these factors and determine what is causing climate change. They find that there's only one clear explanation for what's happening now: Extra greenhouse gases in the atmosphere are warming the Earth. Learn more about climate models."
You can then take their “Climate Challenge’ by picking either the Sun, the Earth's Orbit or Volcanoes. I’ve picked the everyday visual one, the Sun.
The Sun
The facts: Since the 1970s, the sun has been cooling slightly. Over this same time period, the Earth has gotten warmer. Most of the warming has occurred in the lower atmosphere near the Earth's surface.
- Could the sun be responsible for today's climate change?
No. If the sun were the cause of climate change, the Earth's temperature would be cooling, not warming! Also, if the sun were responsible for the increased warming, it would occur throughout the entire atmosphere.
So, "the sun is NOT the cause of today's climate change" (here the bold is theirs). And there you have it, the Sun is irrelevant (it's no big deal - its “NOT” a thing, it is not even required in the IPCC's model - nothing to see here.
Going back to Dr. Ball, he provides an interesting review of the Sun in this article Svensmark’s Cosmic Theory Confirmed; Explains More Than Solar Role in Climate Change
Here is how Ball explains it:
The IPCC consistently ignore the relationship between sunspot and global temperature though there’s extensive literature beginning with Galileo’s observations of sunspots in 1610. They said there was no explanatory mechanism, but that wasn’t true after 1991 when Friis-Christensen and Larsen published“Length of the Solar Cycle: An Indicator of Solar Activity Closely Associated with Climate” in Science. In 1996 Friis-Christensen, Director of the Danish National Space Institute, DTU, said,
“The evidence has piled up, first for the link between cosmic rays and low-level clouds and then, by experiment and observation, for the mechanism involving aerosols. All these consistent scientific results illustrate that the current climate models used to predict future climate are lacking important parts of the physics”
It appeared more fully in 1997 as the CT in embryonic form with Svensmark and Friis-Christensen’s “Variation of Cosmic Ray Flux and Global Cloud Coverage – a Missing Link in Solar-Climate relationships”. The 2001 IPCC Report mentioned it briefly, but it was omitted in the 2007 Report. The IPCC proponents claimed there was no evidence that cosmic radiation was creating as condensation nuclei in the atmosphere.
The problem was given to a supposedly neutral agency.
“The Director General of CERN stirred controversy last month, by saying that the CLOUD team’s report should be politically correct about climate change.”
Why? Now the results are published and the final piece in the puzzle is confirmed. Besides confirming the CT, they answer a longstanding problem. However, an important part of the discovery is missed, partly because of lack of focus on water vapor and precipitation, but mostly because the IPCC control of climate science blocked knowledge and advances for 30 years. A major problem in early meteorology and weather and climate research was there were more clouds than nuclei.
Evaporation occurs when water molecules use energy from the Sun to escape from a surface. This is a phase change, as water in liquid form becomes a gas, water vapor. The energy is not lost but becomes latent heat in the water vapor. If the air temperature is cooled below the Dew Point Temperature then a reverse phase change occurs called condensation and water vapor becomes liquid. The latent heat is released, which is why temperatures usually rise when precipitation occurs. The problem is this process requires a critical component, a solid surface. In the atmosphere this is provided by the CN. Water vapor condenses on to them to form water droplets, which are microscopic. They’re visible as clouds and remain suspended because they are so small – it’s estimated 1 million must combine to form a moderate sized raindrop.
The majority of CN were salt particles, kaolinite, the smallest clay particles and other particulates. Now the CT provides the missing nuclei. The amount of cosmic radiation is reduced as it passes through the Sun’s magnetic field and then the Earth’s magnetic field and then the upper atmosphere. In the atmosphere the cosmic rays become muons or heavy electrons that penetrate to sea level. They are the missing CN.
Proof that cosmic rays provide CN to form clouds in the lower atmosphere is an ugly fact that even the professional scientific spin-doctors cannot avoid. These clouds vary with the intensity of cosmic rays reaching the atmosphere and act like a shade in the global greenhouse to control temperature. We now have proof of the mechanism or cause and effect for what was previously only a correlation. Sunspots are not the cause but a manifestation of changes in the Sun’s magnetic field that in turn modulates the intensity of cosmic rays reaching the Earth. So another ugly fact creates a large cloud that destroys the politically driven AGW hypothesis.
No 'comet dust' talk, yet he offers his take on it from the CT papers.
In the Canadian article - which is not new here for many, Ball points out (here starting with a political note):
Andrew Scherr was elected Conservative leader opposing the human-caused global warming claim. One of his first actions as leader was to have the Conservatives vote to support the Paris Climate Accord. The Conservatives knew the science was wrong because we told them. We told Nancy Green and anyone who would listen all to no avail.
The farce begins with the fact it is not a carbon tax. What they intend to limit is the amount of CO2 that Canadians produce with the false belief it will stop global warming. There are three areas, any of which invalidates the plan.
1. Science: CO2 is only 4% of the greenhouse gases and the human portion is 3.4% of that making it on average 0.032% of all atmospheric gases. These numbers are so imprecise that even if the complete Paris treaty was applied the atmospheric difference would be undetectable. Estimates say it would reduce the global temperature by 0.048°C by 2100. That assumes that a CO2 increase will cause a temperature increase. Every record shows the opposite, temperature increases first. The only place where a CO2 increases raises temperatures is in the computer models of the Intergovernmental Panel on Climate Change (IPCC). This is partly why the model predictions (projections) are consistently wrong yet that is the basis of the Paris Agreement and the Canadian tax plan.
2. Economic Context: Trump exited the Paris Agreement because it is a bad deal for all developed nations including Canada. While they roll back production the developing nations, including China, Russia, and India can develop unrestricted some until 2030. Worse, the developed nations must put $100 billion a year into the Green Climate Fund (GCF) from which even China, now the world’s biggest producer of CO2 is entitled to draw. The developed nations are in a bar fight with both hands tied behind their back and blindfolded.
3. Comments of Proponents: The entire global warming deception was never about the climate. Don’t believe us, take it from the people at the center of the scheme. Climate was a convenient global threat that allowed the UN planners, primarily Maurice Strong {a Canadian}, to overcome nation-states claiming only a world government could handle the problem. Elaine Dewar said after 5 days with Strong at the UN, “Strong was using the U.N. as a platform to sell a global environment crisis and the Global Governance Agenda.” In 2015, Christiana Figueres, Executive Secretary of the UN’s Framework Convention on Climate Change said, “This is the first time in the history of mankind that we are setting ourselves the task of intentionally, within a defined period of time, to change the economic development model that has been reigning for at least 150 years, since the Industrial Revolution.”This follows former US Senator and now Vice Chair of the United Nations Foundation and the Better World Fund Timothy Wirth’s earlier (1993) comment that, “We’ve got to ride the global warming issue. Even with the theory of global warming is wrong, we will be doing the right thing…” look at his self-described manipulation in this PBS interview. A former Canadian Liberal Minister of the Environment, Christine Stewart said, “No matter if the science of global warming is all phony, climate change provides the greatest opportunity to bring about justice and equality in the world.”
So, it's "justice and equality" and taxes of course.
Probably a good idea to monitor our kids (if you have any) homework. The problem is that if parents try and help with the revisionist Q&A homework, the kids will get an 'F' and the parents will likely be asked to come to a parent teacher interview and explain.
There are a great many programs running, yet I've never seen one so coordinated and entrenched as this AGW one - from kindergarten to university to old age.