Very good points there! As far as I understood, they
dug down 268 feet in 1992 to reach the Glacier Girl and around "350+ feet" down in 2018, to reach the same relative depth the Glacier Girl (on same plane as the others?) was located back in 1992. So they must be referring to the depth, I suppose, that they had dug into the ice, measured from top of the ice/snow they were standing at, at the time, rather than taking the sea level or any other fixed point as reference.
Indeed it could be, that if you would measure the depth of the same planes in 1992 and 2018 respectively, taking the sea level for example as reference point, that the height on which the people of the digging crew were standing on the ice above the planes, wouldn't have changed much, since as you pointed out, compression and melting of bottom parts could have contributed at the same time. I say could, since the melting (not the compression though!) is just an assumption at this point, since I don't have the data for that. What you are suggesting with the melting on the bottom, which seems likely to me and within the norms of Greenland glaciers, is an interesting point. Also the compression component. Although it seems to me that both of those components you have brought up, make the whole thing even more problematic to date (referring here to ice core sample dating and the previous calculations of the Greenland Ice Sheet).
The big problem we still haven't figured out is the exact geographic location the planes landed and the geographic location they were in when they were found in 1992 and rediscovered in 2018. Where exactly was that each time? And had it changed in those 76 years?
One clue we have though is "that the crew of the planes was rescued by the coastguard" that I heard or read somewhere. So the planes probably (obviously a guess) weren't too far away from the coast when they landed. When you look at Greenland on the map, it is quite a huge stretch of land. So anything to far from the coast would have probably made the survival/rescue of the crew unlikely. Also the planes stranded in July, which is in the
middle of the summer season, which
various very widely/profoundly on the island. Even in summer though, if they would have landed near the middle of the island and/or far away from the coast, I think today, it would have been pretty hard for those people to survive and be rescued by coastguards, let alone in 1942.
So if we assume that the planes were not far away from the coast, which seems likely, that also makes the problem worse rather than better, since as far as I understood, it is mostly the outer parts of the ice sheet (namely the coast areas) that experience a lot of melting in the summer. And jet we still have 350+ feet of ice over the planes.
As for the compression, it makes the 350+ feet even more interesting. If we are talking about
ice sheet cover over the planes here, then this means that this ice has about a density of
0.9167 g/cm3. Snow has a lot less density, because a lot of air is still in between: between
0.15 - 0.5 g/cm3. So obviously, the average amount of ice height previously calculated, that has accumulated over the plane every year since 1942 with 4,605 feet [1,4036 Meters], probably means that significantly more snow (measured in height) fell to create that ice?
How much snow (measured in height) has to fall, that 4,605 feet of ice accumulate in one year? And how much snow (measured in height) has to fall that 350+ feet of ice accumulates in 76 years? The mathematical "simple rule of three" (Dreisatzrechnung) can not be used here with those density parameters, since we have to calculate with cubic centimeters of ice and snow density here. Anyone able to do that?
And what about the melting of bottom layers that you brought up, and the dating of ice core samples, do they take that into account, and if so, how sure can they be that they know exactly when and how much things melted on the bottom of the glaciers? I mean, if the 3026 Meters are supposed to be when snow fell 970.000 years ago, wouldn't that point in time quickly disappear backwards in time? In other words, wouldn't the bottom layer above the ground at 3026 Meters, constantly being moving forward in time significantly? And do they calculate that in and if so how?
") but there might be problem: Even if the plane had been covered with a certain height of ice, that doesn't necessarily mean that the top of the ice layer is - measured from sea level for example - elevated by the same height over that period. Additional layers will be compressed by later layers and also melting from the bottom might be possible? What I mean is that it's probably not linear. 10 meters of new ice on the top won't be 10 meters anymore when they are being covered by additional 100 meters and they also might have sunk as a whole.
but there might be problem: Even if the plane had been covered with a certain height of ice, that doesn't necessarily mean that the top of the ice layer is - measured from sea level for example - elevated by the same height over that period. Additional layers will be compressed by later layers and also melting from the bottom might be possible? What I mean is that it's probably not linear. 10 meters of new ice on the top won't be 10 meters anymore when they are being covered by additional 100 meters and they also might have sunk as a whole.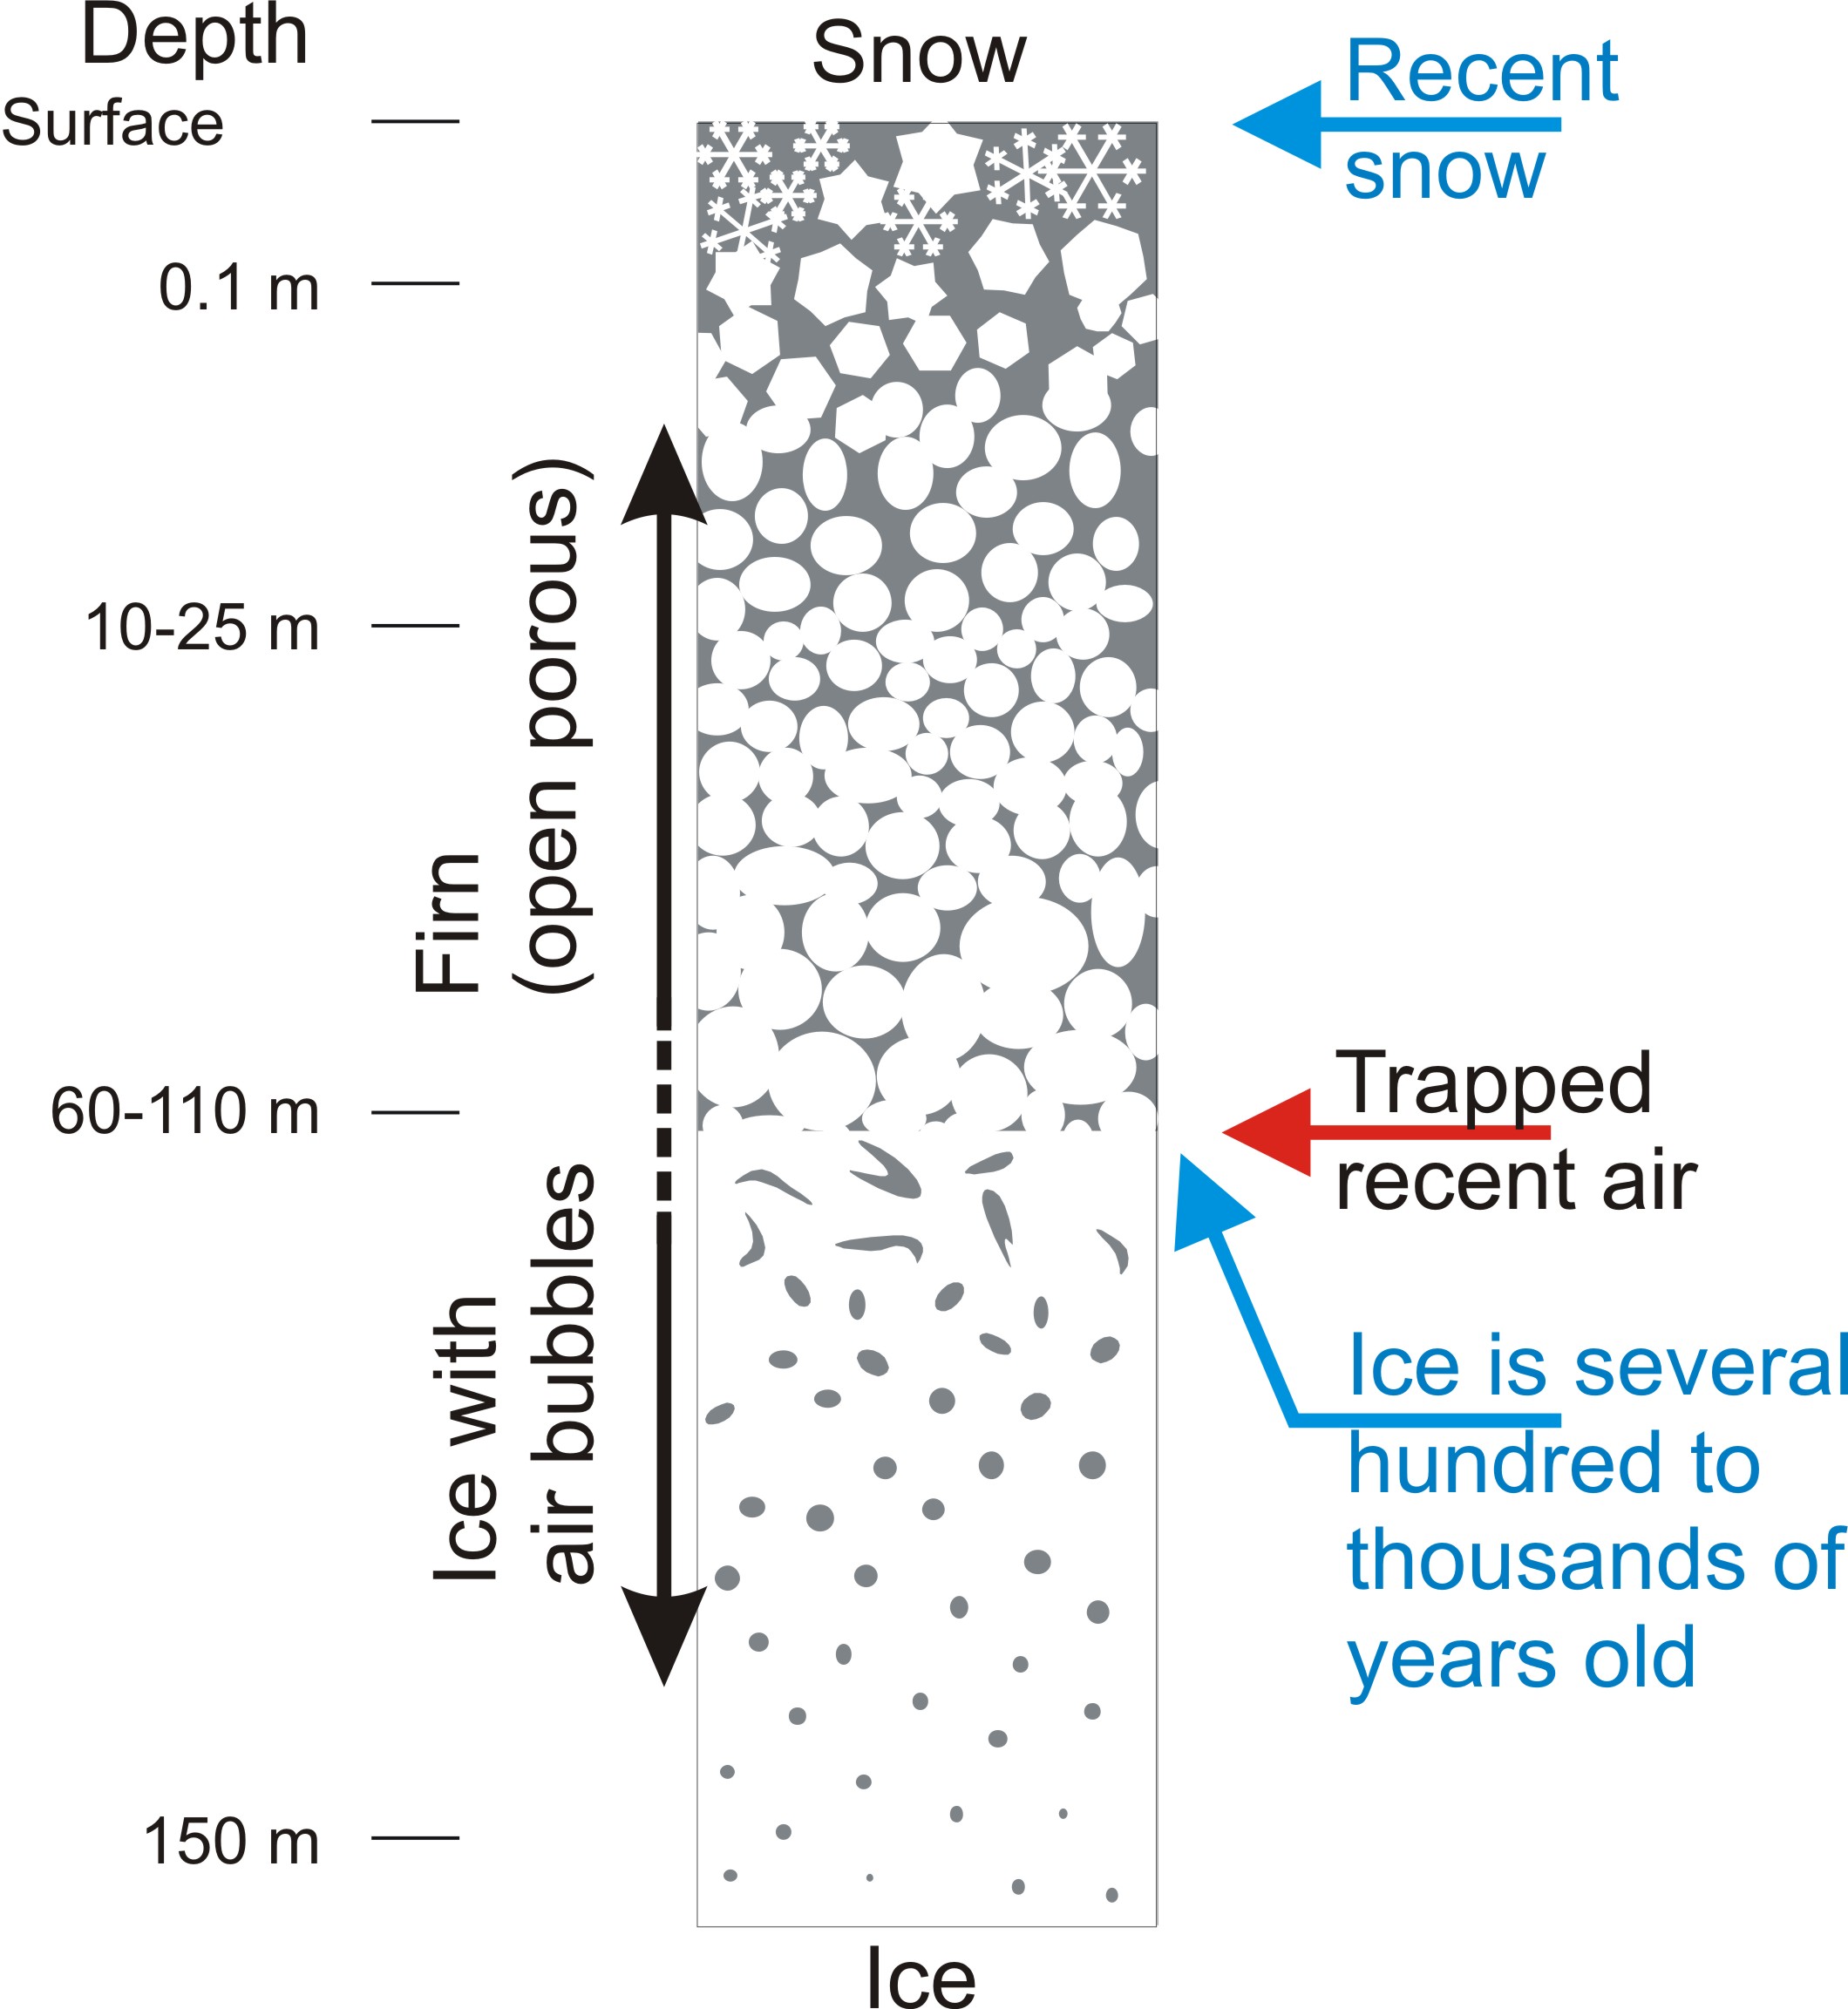

") on climate change with a spot light on the usual characters going back to Maurice Strong; a meddler of old par none from my own backyard.
on climate change with a spot light on the usual characters going back to Maurice Strong; a meddler of old par none from my own backyard. 
 from Wednesday it becomes icy cold