The Ice Age Cometh! Forget Global Warming!

According to SevereWeather.eu the stratospheric polar vortex is the coldest it has been in 40 years, measured at -96°C (-141°F) over Iceland.

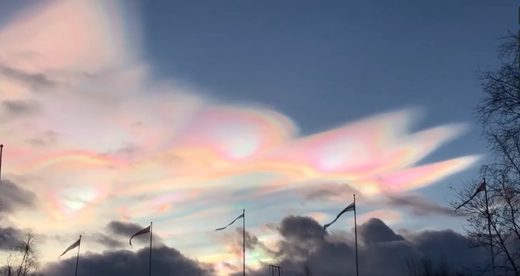
They're also relating this to the current outbreaks of Polar Stratospheric clouds which have been called the most vivid locals have ever seen - although to note that these began at least a week or 2 before this report. Maybe even earlier.

It states that the strength of the vortex is often correlated with how cold it is, so it's unusually cold and therefore likely strong. They state that it seems to be "quite beastly"

And the impact it could have on weather:

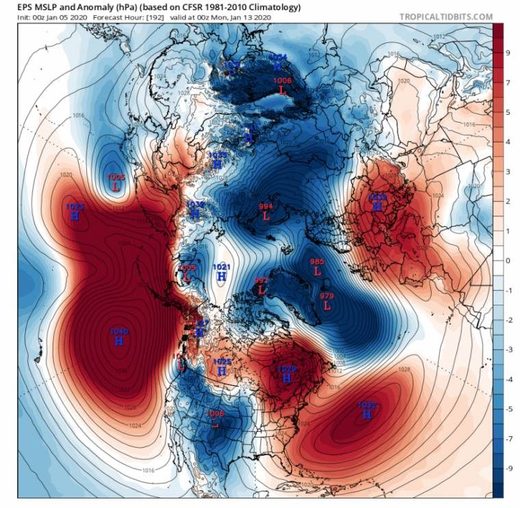
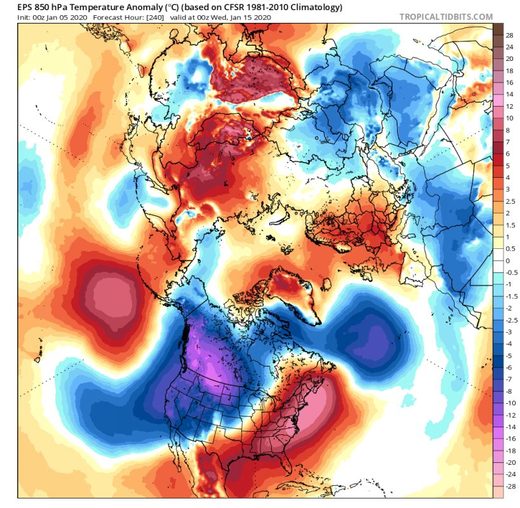
Combined with the unusually high pressure in the Pacific, this is a perfect recipe for cold air outbreaks into Canada and western/northern United States. The core polar vortex circulation over the Greenland area promotes cold north flow down into the United States, as seen on the temperature anomaly forecast below. Sadly that means W/SW flow for the SE United States and less chance of a colder winter episode. On the other side, that same polar vortex core over Greenland lowers the pressure in the North Atlantic, and creates a mild zonal flow towards Europe, and promotes pressure building, keeping winter mainly away from the continent. This is a very fine example of a "coupling" between the stronger stratospheric polar vortex and the troposphere.

The full article - which i don't fully understand! - explains it better than i could:

Stratospheric polar vortex reaches coldest temperature in 40 years
polar vortex


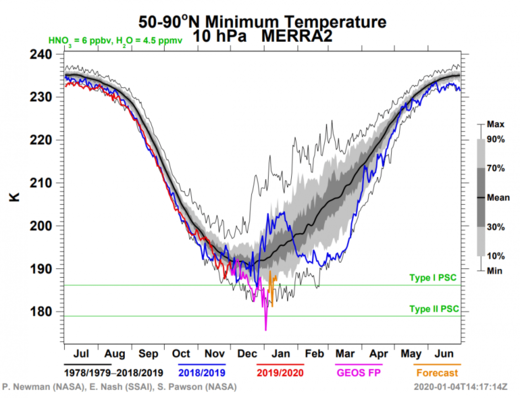
The graph shows the lowest temperature across the Northern Hemisphere, from 50-90°N latitude, where the coldest area of the polar vortex usually is.
The polar vortex has been gaining strength and has reached its peak climatological strength. It is set to be connected with the lower levels, pushing its influence on the weather patterns.

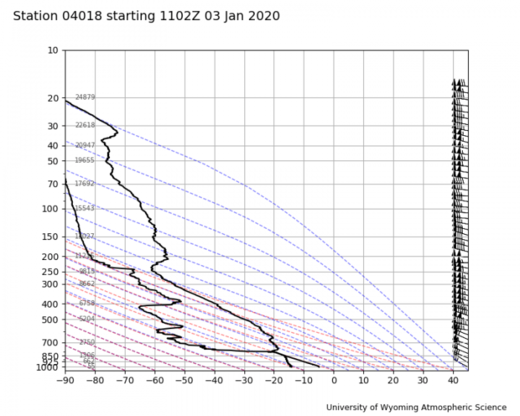
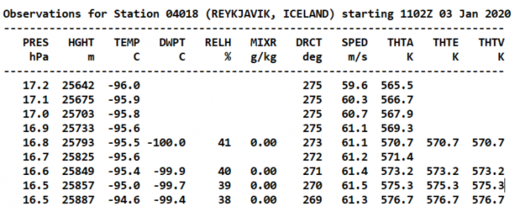
On January 3rd, a radiosonde has made measurements of the mid-stratospheric layers. Measuring over Reykjavik, Iceland, it has recorded the lowest temperature in the stratosphere in the past 40 years, at -96°C (-141°F). The image and data below from the Universtiy of Wyoming, shows the direct measurements made, where we can see the temperature line disappearing below -90°C near the 20mb level. The raw data shows the temperature and altitude, where we can see the -96°C being reached at 17.2mb level, which was around 25.6 km altitude.


iceland stratosphere cold
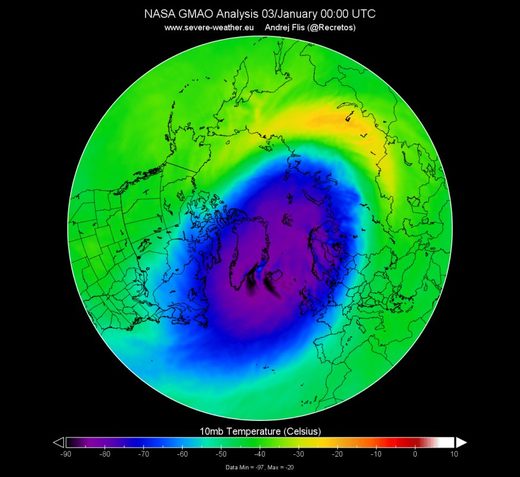
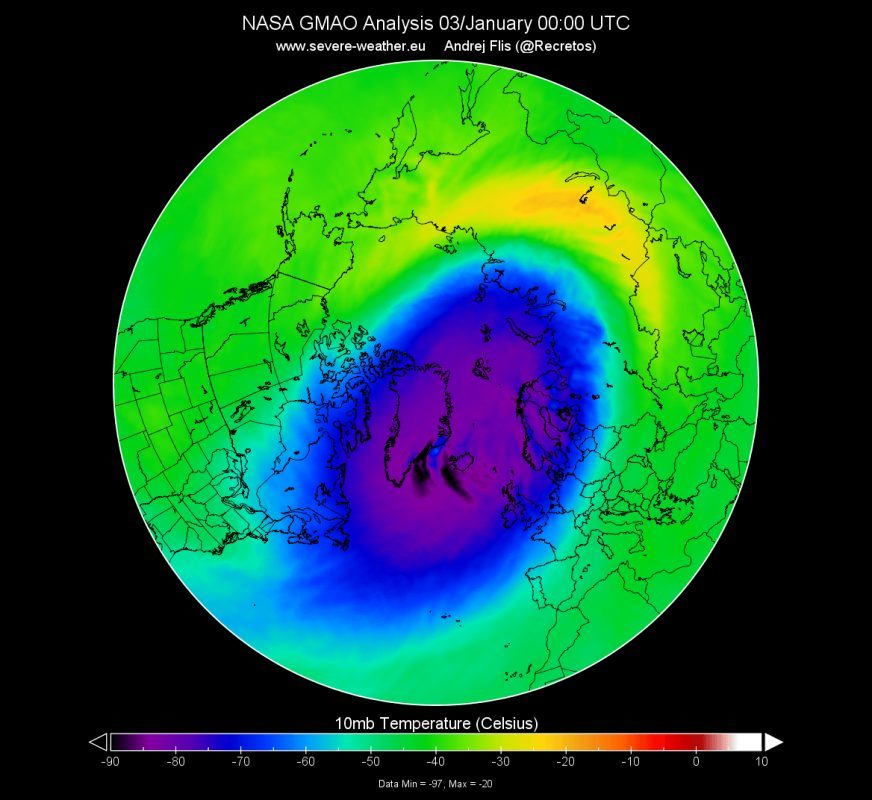
Looking at the 10mb level analysis, we can see the lowest temperatures developing as darker/black spots, right around W Iceland and SE Greenland. The analysis from NASA/GMAO actually shows the Greenland dark spot at -97°C, but we do not have direct measurements from that area.
polar vortex

The graph shows the lowest temperature across the Northern Hemisphere, from 50-90°N latitude, where the coldest area of the polar vortex usually is.
NASA/GMAO analysis graph actually showed this minimum to be the coldest temperature in the 40-year record (MERRA-2 data set). The graph shows the lowest temperature across the Northern Hemisphere, from 50-90°N latitude, where the coldest area of the polar vortex usually is. The graph is set for 10mb, while the minimum was directly observed at 17mb. Later fine-analysis will have to confirm the results at 10mb. But in any case, this truly was/is one of the coldest polar vortex peaks in the past 40-60 years. Such cold temperatures enable the development of the Polar Stratospheric Clouds (PSC), which are truly a stunning sight to see!

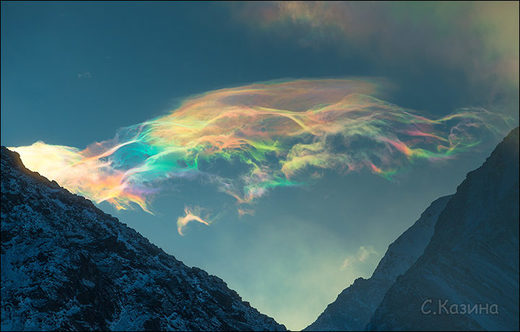
Comment: Two examples would be the sighting over Siberia on the 23rd of December 2019
Svetlana Kazina
© Svetlana Kazina
"The clouds in my photos are so thin that they look more like lace."


And Sweden on the 29th December 2019 - and these occurred prior to the above record low temperatures were observed - there have been a number of other related events since:

polar stratospheric clouds
© Vimeo/Lights Over Lapland


iceland stratosphere cold
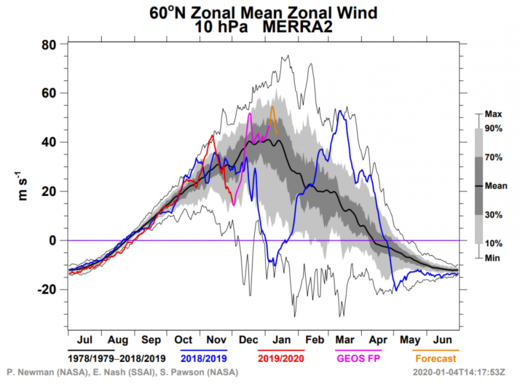
Temperature is one indicator of the strength of the polar vortex, as it is usually as cold as it is strong. A better estimate of strength is perhaps the actual power, or wind speed of the polar vortex, or the stratospheric polar jet. The stronger the polar jet, the more likely it is for the polar vortex to connect down with our weather and influence the weather patterns. Of course, the actual coupling can be denied by the troposphere, even if we have a strong stratospheric polar vortex, so we need to look at each case individually. We must look at the entire polar vortex to estimate its overall composure and strength, but usually, the 10mb level (~30km altitude) is the sweet spot in the mid stratosphere. The graph from NASA/GMAO shows the strength progression of the stratospheric polar jet stream. We can see the reduction of the jet stream around the time the warming phase was active, which weakened the polar vortex. The warming has ended prematurely, and the polar vortex quickly regained its strength in December and is currently running above-average strength of the polar jet stream.
iceland stratosphere cold
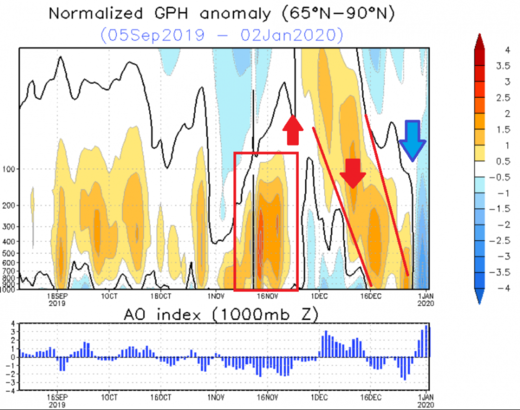
The graph below from NOAA/CPC shows the progression of the weakening cycle of the polar vortex. First, we had high pressure in the lower levels, in the troposphere (where our weather is), which caused energy waves upwards into the stratosphere, disrupting the polar vortex. The disrupted polar vortex has sent its influence back down, as nicely seen by the progression in December, influencing a more dynamic weather pattern. But while any influence came down from the stratosphere, the stratospheric polar vortex already re-organized and is now starting to "couple" with the troposphere. The coupling means that both the tropospheric and the stratospheric polar vortex are connected and work in a semi-synchronous way.
iceland stratosphere cold
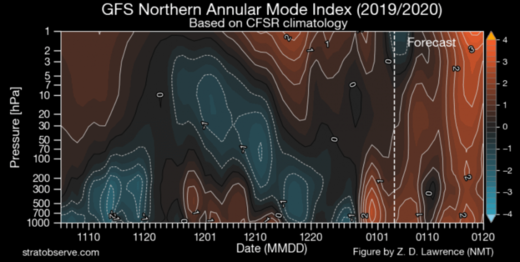
Another way to look for this coupling, is by looking at the NAM (Northern Annular Mode). Without going into too much detail, it is just one of the ways to estimate the strength of the polar vortex/circulation. Negative values mean a weaker vortex, and positive values mean a stronger vortex. We can nicely see the progression of the negative values and the weaker vortex episode we mentioned above. But what is more important here, is the forecast, which shows positive values across the entire altitude layer, meaning a more likely coupling of the tropospheric and stronger stratospheric polar vortex.
iceland stratosphere cold
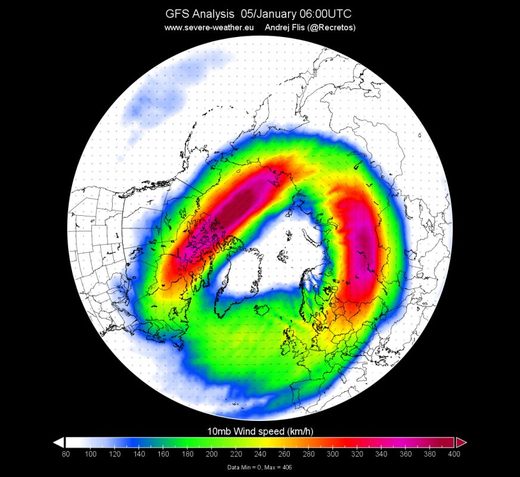
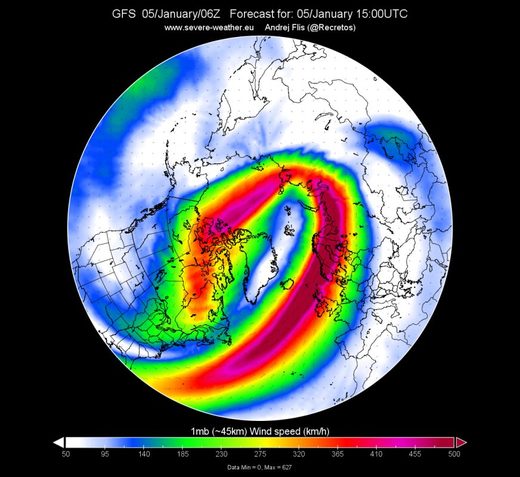
But what exactly are we "coupling" with? Looking at the current analysis, we take a look at the wind speeds at different altitudes. More specifically at the 10mb (30km) and 1mb (45km) level. The strength of the stratospheric polar jet is very impressive. At 10mb, the wind speeds are currently reaching over 400 km/h. But on the top of the stratosphere at 1mb (45km) the wind speeds exceed 600 km/h. So the polar vortex is very healthy and in a good shape. The actual wind speed at this altitude does not really have a direct influence on our weather but combined with the shape of the polar vortex, it does tell us what kind of a beast it is. And currently, the stratospheric polar vortex is quite beastly.
iceland stratosphere cold
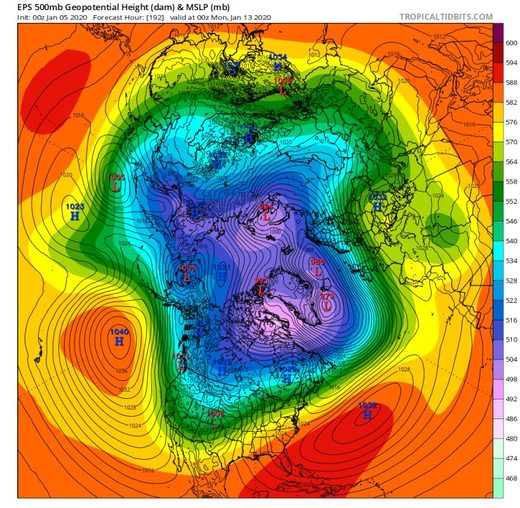
Looking lower down at the troposphere and our weather, we can see the same core location of the polar vortex, over the pole and Greenland/North Atlantic. The North Atlantic region is usually more evident at the surface levels (MSLP).
iceland stratosphere cold

iceland stratosphere cold
Combined with the unusually high pressure in the Pacific, this is a perfect recipe for cold air outbreaks into Canada and western/northern United States. The core polar vortex circulation over the Greenland area promotes cold north flow down into the United States, as seen on the temperature anomaly forecast below. Sadly that means W/SW flow for the SE United States and less chance of a colder winter episode. On the other side, that same polar vortex core over Greenland lowers the pressure in the North Atlantic, and creates a mild zonal flow towards Europe, and promotes pressure building, keeping winter mainly away from the continent. This is a very fine example of a "coupling" between the stronger stratospheric polar vortex and the troposphere.
iceland stratosphere cold
We will keep you updated on any important further development.
 
According to SevereWeather.eu the stratospheric polar vortex is the coldest it has been in 40 years, measured at -96°C (-141°F) over Iceland.
Yes, that also fits with the news that Greenland recorded the coldest temperature, 86.8F (-66C)
 
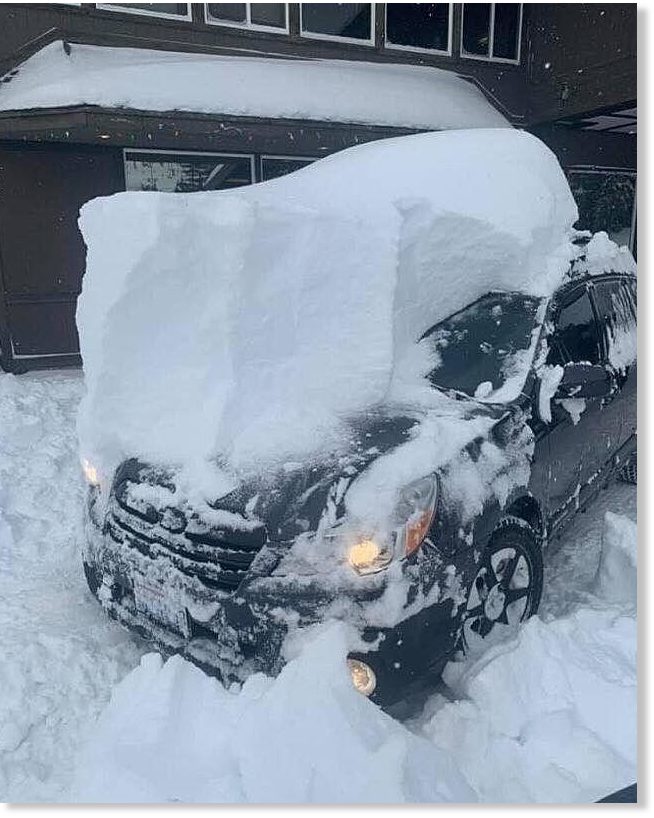
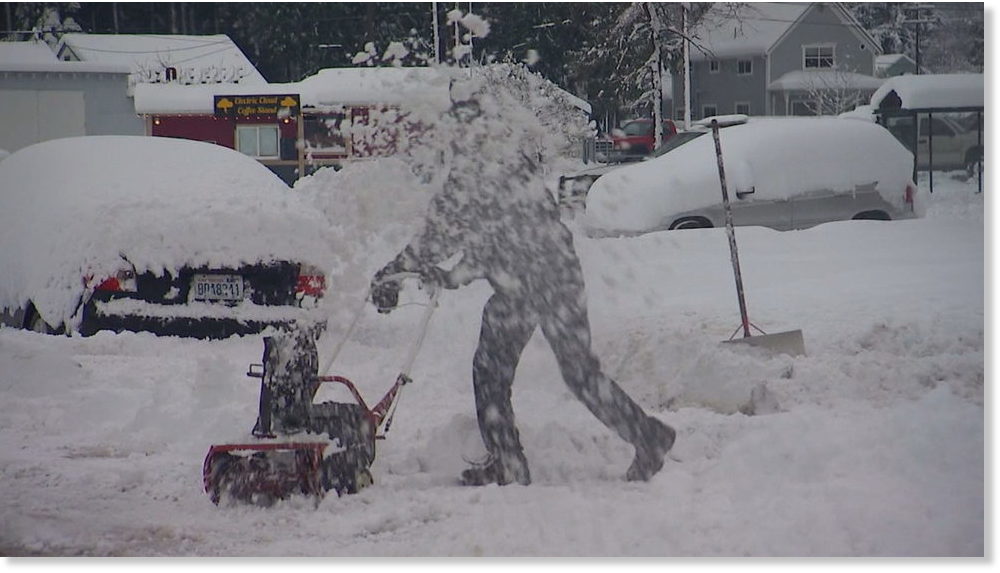
Washington state is being hammered by heavy snowfall in the last few days, even down to low lying coastal areas-


Snoqualmie Pass in Washington buried under 6.7 feet of snow in 6 days - Nearly 10 feet since Jan 1st, 11.8 at Stevens Pass

The busiest mountain pass in Washington state has received several feet of snow in less than a week and more snow is in the forecast.

The state Department of Transportation tweeted that, over the past five days, Snoqualmie Pass had received 77 inches of snow that forced the closure of Interstate 90 on several occasions. Three more inches have fallen so far Thursday for a total of 80 inches - or 6.67 feet - of snow.

Going back to Jan. 1, an impressive 117 inches of snow have fallen so far this year at Snoqualmie Pass. That's only three inches shy of 10 feet.

Gusty winds have also been reported at the summit, making travel even more treacherous. And forecasters predict more snow through the weekend.

Currently, traction tires are required at Snoqualmie Pass, and chains are required for vehicles over 10,000 pounds gross weight.

Meanwhile, Stevens Pass has received 73 inches of snow since Saturday, or 6.1 feet. Since the beginning of the year, 142 inches have fallen at Stevens Pass, for 11.8 feet of snow.

Currently, Stevens Pass is closed from the Skykomish area to the summit due to danger from falling trees and other hazards.


Below is a very useful resource for tracking snowfall across the US in (almost) real time - at either 1, 3, 6, 12, 24, 36, 48 or 72 hourly intervals (use sliding bar above map to choose time range).

 
No snow here.

In my hometown Nyköping in Sweden, where I am at, there hasn't been any snow this year, almost. It is the first time I experience a snow-less year. It did snow maybe some hours some month ago but it quickly disappeared. So it has been degrees above zero mostly, even at night. In the past few weeks it has been 9°C at day time, or there about. But the winter time isn't over yet and snow could fall, but at this time it doesn't look like it. But I am not complaining, I don't like the cold.

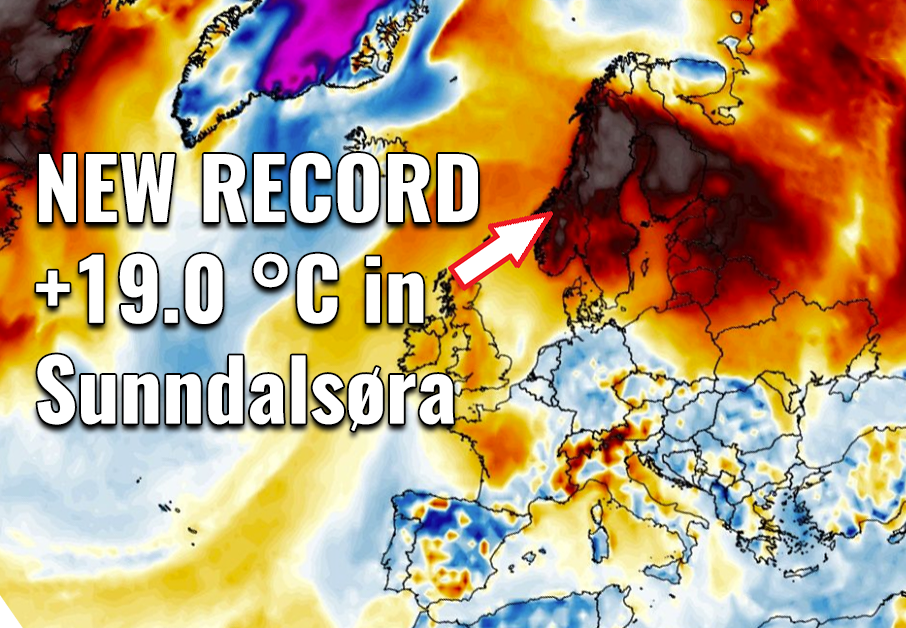
Also, the highest temperature in Scandinavia was recorded in Norway at the beginning of January:
 
i'm reading this book The power of color by Morton Walker, and stumble on this passage:
After reading the article, I first understood that the test is no more valid since 1938. I don't think it's the case, it would be so strange.

So I checked here: spaceweatherlive the sunspot number for 1938. And it was the peak of the cycle (see attached picture). So now, what I understand is that Takata test was accurate when she discovered it around 1930 because the sunspot number was very low. And in 1938, sunspot number was hight and the it made the test inaccurate.

We can speculate it's always the case, but the article is not clear about this.
 

Attachments

  • sunspot 1920-1950.jpg
    sunspot 1920-1950.jpg
    39.3 KB · Views: 6
Last edited:
I read my message and realized I should have said up to 9°C, or there about, mostly. But not everyday. Right now it is only 4°C at the moment.
 
‘Bomb’ blizzard buried cars and homes with more than 12 feet of snow in parts of Newfoundland


An explosive blizzard hit Newfoundland, Canada, on Jan. 17, bringing heavy snow and hurricane-force winds. (The Washington Post)
By Andrew Freedman and
Hannah Knowles
January 19 at 1:13 PM
The historic blizzard that slammed Canada’s easternmost province is headed for Greenland — but it left snow-buried neighborhoods, a slew of power outages and shattered records in its wake.
St. John’s superseded its record for the most snow in 24 hours, recording 30 inches, as the storm hit Newfoundland and Labrador on Friday. A state of emergency continued in the provincial capital and elsewhere through Sunday as most businesses were ordered closed and few beyond emergency vehicles were allowed on the roads. Snow drifts rose 12 to 15 feet high on some highways, officials said. The Canadian armed forces were called in to help clear the deluge.
“Newfoundlanders are going to be talking about this for a very, very long time,” said Ashley Brauweiler, a meteorologist for the Canadian Broadcasting Corp. in the province. Her station lost power during the storm and had to stop broadcasting. At one point, she told The Washington Post, people there couldn’t even open the door because of the snow that had piled up on the other side.[...]

1579490440483.png
I have a Niece is living there. This is a picture from one of her friends. He is a Firefighter, in St Johns, his house is to the left, he is waiting to be picked up by the Crew to go to the Station.

 
Oh, Wow! 30 inches in 24 hours? Those snow drifts are unbelievable!

Canada's government to help Newfoundland dig out after massive blizzard
A man is pictured in a snowy street in St. John's, Newfoundland and Labrador, Canada January 17, 2020. Zach Bonnell/via REUTERS
Canada's federal government will help Newfoundland on the Atlantic coast dig out in the wake of a massive winter blizzard that buried cars and left thousands without power, a Cabinet minister said on Saturday.

Hundreds of troops to help Canadian province recover from huge blizzard
Pile of snow is pictured outside a house in St John's, Newfoundland And Labrador, Canada January 18, 2020 in this picture obtained from social media. J. David Mitchell/via REUTERS
Between 150 and 200 Canadian troops should be in the Atlantic province of Newfoundland and Labrador by the end of Sunday to help it dig out from a massive blizzard, Defense Minister Harjit Sajjan said.


The armed forces will also provide two transport planes and at least two helicopters. The storm dumped up to 76.2 cm (30 inches) of snow on St. John’s, the capital of Newfoundland, and packed wind gusts as high as 130 km per hour (81 mph).

Many major roads are totally impassable. Although a state of emergency remains in the town, authorities said on Sunday that gas stations and pharmacies would be allowed to reopen.

“Probably by the end of today you’ll have about 150 to 200 personnel on the ground ready to provide support. This could surge up to anywhere between 250 to 300 by tomorrow and the coming days,” Sajjan said on the sidelines of a cabinet retreat in Winnipeg, Manitoba. The troops would be a mix of reserves already in the province and soldiers arriving from elsewhere, he added.

Conditions could continue to be difficult, since Environment Canada is predicting an additional 10 cm of snow on Sunday night.


Nepal rescuers call off search for trekkers after new avalanches
FILE PHOTO: An aerial view of climbers who await rescue after an avalanche hit in Deurali, Nepal January 18, 2020 in this picture obtained from social media.  Simrik Air/Captain Ananda Thapa/via REUTERS
Rescuers in Nepal called off efforts on Monday to find seven people, including four South Korean trekkers, after fresh avalanches hit the Annapurna region where the group went missing last week, an official said.

Despite great snow, Lebanon's ski slopes suffer in economic crisis
People ride a ski lift at Mzaar Ski Resort in Kfardebian, Lebanon January 11, 2020. REUTERS/Aziz Taher
It is a sunny day on Lebanon's ski slopes after weeks of snowfall but, as the economic crisis bites, there is no sign of the traffic that would typically jam the road.

But what about "global warming"?

Climate activists dressed as koalas set off on mountain hike to Davos

Climate activists set off on a three-day hike from Landquart in eastern Switzerland to the ski resort of Davos on Sunday to draw attention to global warming at the World Economic Forum this week.
 
and the it made the test inaccurate.

We can speculate it's always the case, but the article is not clear about this.
Should read : and the it made the test inaccurate.

By the way I was thinking: if sunspots influence a fertility indicator of women, can it have an influence directly on the fertility?
 
Many of the proponents of global warming/change/meltdown have talked about the arctic sea ice and how the lower and lower seaice would lead to a death spiral marking the end of sea ice on the arctic. This has not happened and even if the sea ice did go low this year, the rebound is quite impressive. To give a comparison, below are the sea ice (15%) figures from Nansen since 2002, day 352:
I decided to check out the values today and do an update. The values are for 2004-2020 as 2002 and 2003 didn't have any values for this day.
Sea ice area Jan 20th 2004-2020.gif
A chart for one day does not show the whole picture and can be misleading as one can choose different start and end date to give the message one wishes. In this case I took all the values that were available for this day and added a trend line. Even if summer ice goes low, there is no indication that it leads to a run away meltdown. It appears that the Arctic is very resilient and bounces back every winter with great vigor. The trend for the 20th of January is not showing a decline but instead a very slight increase. The average Sea ice for the period was 12.265.049 km2.
 
Should read : and the it made the test inaccurate.

By the way I was thinking: if sunspots influence a fertility indicator of women, can it have an influence directly on the fertility?

About 10 years ago i read a few books by Maurice Cotterell (discussed on the forum briefly here - and his work didn't get a great reception - his website is here), in the majority of them he takes famous ancient artifacts and claims to decode them, stating that they encode 'the science of the Sun' in their design. If i recall correctly, in particular he thought he saw in them the duration of time it would take for the Sun to do a full rotation at it's pole and around at it's equator, something like 28 days and 32/1 days respectively.

Now, whilst the books were interesting i can't say whether or not they were true. I'm working on the premise they were not. Because he also investigated the causes of leaky gut, something he suffered from, and part of his recommendations in how to cure it involved eating a vegetarian diet for months.

Then again he does link the sun with warm periods and ice ages.

Anyway, he believes ancient civilisations documented the solar cycles because of the profound effect they had on human life. There was some link with sunspots and heightened risk of schizophrenia, as well as, what's relevant here, low sunspot numbers meant something like more radiation from space that in turn resulted in low fertility rates.

He claims that at some ancient sites they built the outline of 'windows' into the buildings but the windows were actually deliberately closed off, and women, whose fertility would be negatively effected by the increased radiation at these times, would be kept within these buildings.

I don't recall him ever mentioning comets or cosmic catastrophes of any kind.

So, i can't say whether any of this is true or not - it's quite possible that he's seeing patterns everywhere - but below are a few screenshots to get an idea of what he's saying all the same:

On fertility:


1 page from his 14 page PDF on leaky gut:
 
The province in Canada, Newfoundland, is finally digging out of the Polar Vortex Snow dump. The people living there are generally considered to be very friendly, and able to find humor in almost any situation.
Here are a few pictures.
The pics are from friends, Family and local news.

1579798249165.png
Humor and creativity...


1579798417030.png
One Grocery Store/warehouse was opened on day 3 AFTER the storm, and the lineup began.


1579799405135.png
The west end of the City of St.Johns, NFL.

1579799632207.png
Residential side street.

And a Canadian tradition, STORM CHIPS!
1579800268697.png

What are Storm Chips?
"Storm chips are a weird Atlantic Canadian phenomenon. If there’s a storm in the forecast you best stock up on potato chips. Those are your storm chips. There’s something about a snowstorm that makes a person snacky here. Being housebound means normal rules don’t apply. Treat yo’self."
 
Back
Top Bottom