Sol (Sun) and its phenomena

SOLAR CYCLE 25 ACTIVITY REPORT JUNE 05_2023

Solar activity has been at low levels for the past 24 hours. The largest solar event of the period was a C8 event observed at 03:45 UTC on June 08 from Region 3323 (S07E20)


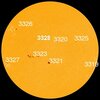
There are currently 7 numbered sunspot regions on the solar disk: AR3319, AR3320, AR3321, AR3323, AR3325, AR3326 and new region AR3327

Total number of sunspots has decreased to 110 (40 of these are grouped into 7 active regions) NOAA forecasts for the next 24h: 99% chance for C flares, 35% chance for M flares and 10% chance for X flares.

AR3319 (S20W84 size 220MH) and AR3323 (S05E18 size 320MH) possess a beta-gamma magnetic field that harbors energy to produce M-class flares.

● Auroral Activity

The geomagnetic field has been at quiet to unsettled levels for the past 24 hours. Solar wind speed reached a peak of 388 km/s at 29:16 UTC June 04 Total IMF reached 11 nT at 17:02 UTC on June 04 this means moderately strong magnetic field

Aurora Oval Bz: -1.35 nT South
aurora-map.jpg

● Current Conditions at 04: 50 UTC on June 05

▪︎ Geospace quiet (kp 1)
▪︎ Solar wind speed record: 334.2 km/sec (Normal speed)
▪︎ density: 2.31 p/cm³ (low density)
▪︎ Interplanetary Magnetic Field (IMF)
Bt: 7.36 nT (normal nano-Tesla valor)
▪︎ Neutron Counts today: +0.0 % (average)
▪︎ X-ray Solar Flare: C4 at 00:17 UTC
▪︎ Sunspot number: 110 (SN 112 June 04)
▪︎ Spotless Days 2023 total: 0 days (0%)
-
-SpaceWeatherlive..com
-SpaceWeather.com
 
SOLAR CYCLE 25 ACTIVITY REPORT JUNE 06_2023

Solar activity has been at low levels for the past 24 hours. The largest solar event of the period was a C4 event observed at 00:17 UTC on June 5 from Region 3320 (N10W21)

There are currently 7 numbered sunspot regions on the solar disk: AR3320, AR3321, AR3323, AR3325, AR3326, AR3327 and new region AR3328. AR3319 is gone

Total number of sunspots has increased to 151 (70 of these are grouped into 7 active regions) NOAA forecasts for the next 24h: 99% chance for C flares, 30% chance for M flares and 10% chance for X flares.

AR3323 (S08E06 size 330MH) has a beta-gamma magnetic field that harbors energy to produce M-class flares.

● Auroral Activity

The geomagnetic field has been at quiet levels for the past 24 hours. Solar wind speed reached a peak of 457 km/s at 08:20 UTC June 05 Total IMF reached 9 nT at 19:31UTC the same day.

POSSIBLE EARTH-DIRECTED CME (UPDATED): Yesterday, June 4th, a magnetic filament erupted from the sun's southern hemisphere: movie. The eruption hurled a CME into space and possibly toward Earth. A NASA model suggests a glancing blow on June 7th (NOAA models say June 8th), possibly causing G1-class geomagnetic storms. SpaceWeather.com

Aurora Oval Bz: 7.42 nT North
aurora-map.jpg
● Current Conditions at 04: 10 UTC on June 06

▪︎ Geospace unsettled (kp 3)
▪︎ Solar wind speed record: 382.6 km/sec (Normal speed)
▪︎ density: 6.54 p/cm³ (low density)
▪︎ Interplanetary Magnetic Field (IMF)
Bt: 8.07 nT (normal nano-Tesla valor)
▪︎ Neutron Counts today: -0.8 % (Below average)
▪︎ X-ray Solar Flare: C2 at 03:20 UTC
▪︎ Sunspot number: 151 (SN 110 June 05)
▪︎ Spotless Days 2023 total: 0 days (0%)
-
-SpaceWeatherlive..com
-SpaceWeather.com
 

Attachments

  • hmi200 (1).jpg
    hmi200 (1).jpg
    15.3 KB · Views: 0
SOLAR CYCLE 25 ACTIVITY REPORT JUNE 07_2023

Solar activity has been at low levels for the past 24 hours. The largest solar event of the period was a C7 event observed at 19:00 UTC on June 06 from Region 3327 (S14E40).

There are currently 10 numbered sunspot regions on the solar disk: AR3320, AR3321, AR3323, AR3324, AR3325, AR3326, AR3327, AR3328 and new regions AR3329, AR3330

Total number of sunspots has decreased to 133 (60 of these are grouped into 10 active regions) NOAA forecasts for the next 24h: 99% chance for C flares, 30% chance for M flares and 10% chance for X flares.

AR3323 (S08E06 size 330MH) has a beta-gamma magnetic field that harbors energy to produce M-class flares.

AR3327 (S13E40 size 300MH) has a beta-gamma-delta-class magnetic field that harbors energy for M and X-class flares.
I think ChatGPT wants to rewrite history

HOW BIG WAS CARRINGTON'S SUNSPOT? If you want to have a bit of fun with ChatGPT, ask it the following question: "How big was Carrington's sunspot?"
ChatGPT's response: "Richard Carrington's observations of the great solar storm in 1859 did not provide a direct measurement of the size of the sunspot."
Poor Carrington must be turning in his grave. The astronomer made beautiful drawings of the sunspot, shown here in a figure from Carrington's report in a 1859 issue of the Monthly Notices of the Royal Astronomical Society:
og_drawing_crop2_strip.jpg
On Sept. 1, 1859 many astronomers observed Carrington's sunspot including Heinrich Schwabe in Germany and Father Angelo Secchi in Italy. Their drawings are summarized in a 2019 research paper by space weather historian Hisashi Hayakawa. The body of Carrington's sunspot was about 9% as wide as the solar disk (14.3% if we include a retinue of smaller surrounding spots). The surface area of the sunspot was ~2300 millionths of the solar disk.
hmi4096_blank_carrington_crop_strip.jpg
That's huge, but no record setter. "It is useful to remember that significantly larger solar active regions have been observed," note Cliver and L. Svalgaard in a 2004 Solar Physics review paper. "Regions with spot areas ~5000 millionths appeared during cycle 18."
To illustrate the scale of Carrington's sunspot, we have pasted it onto an image of the sun taken by NASA's Solar Dynamics Observatory on June 6, 2023. There is actually a sunspot today nearly as wide as Carrington's: AR3323. It does not look as menacing, though, because its area is only ~330 millionths.
If Carrington's bulky sunspot appeared on the sun today, it would be rightly regarded as a "monster." To find a sunspot of similar width and area, we have to turn back to early November 2003 when giant sunspot AR486 unleashed the strongest solar flare of the modern era (X28). This image compares AR486 to Carrington's sunspot; they are almost exactly the same size. SpaceWeather.com
ar486vCarrington.jpg

● Auroral Activity

The geomagnetic field has been at quiet to unsettled levels for the past 24 hours. Solar wind speed reached a peak of 424 km/s (Elevated speed) at 09:53 UTC June 06 Total IMF reached 19 nT at 23:39 UTC the same day.

GLANCING-BLOW CME EXPECTED: NOAA forecasters say that a CME might hit Earth's magnetic field late on June 7th or June 8th. It was hurled into space on June 4th by an erupting filament of magnetism in the sun's southern hemisphere: movie. The glancing impact could cause minor G1-class geomagnetic storms. SpaceWeather.com

Aurora Oval Bz 3.68 nT North
aurora-map.jpg

● Current Conditions at 05: 10 UTC on June 07

▪︎ Geospace quiet (kp 1)
▪︎ Solar wind speed record: 333.3 km/sec (Normal speed)
▪︎ density: 2.5 p/cm³ (low density)
▪︎ Interplanetary Magnetic Field (IMF)
Bt: 4.95 nT (normal nano-Tesla valor)
▪︎ Neutron Counts today: -0.7 % (Below average)
▪︎ X-ray Solar Flare: C1 at 03:40 UTC
▪︎ Sunspot number: 133 (SN 151 June 06)
▪︎ Spotless Days 2023 total: 0 days (0%)
-
-SpaceWeatherlive..com
-SpaceWeather.com
 

Attachments

  • 1686112554687.gif
    1686112554687.gif
    42 bytes · Views: 1
SOLAR CYCLE 25 ACTIVITY REPORT JUNE 08_2023

Solar activity has been at moderate levels for the past 24 hours. The largest solar event of the period was a M4.7 event observed at 1146 UTC on June 07 from Region 3327 (S16E28) it caused a Minor R1 radio blackout over North Africa
AR3327 (S13E40 size 300MH) has a beta-gamma-delta-class magnetic field that harbors energy for M and X-class flares.

There are currently 10 numbered sunspot regions on the solar disk: AR3320, AR3321, AR3323, AR3324, AR3325, AR3326, AR3327, AR3329, AR3330, ans new region AR3331

Total number of sunspots has increased to 177 (67 of these are grouped into 10 active regions) NOAA forecasts for the next 24h: 99% chance for C flares, 30% chance for M flares and 10% chance for X flares.

INCREASING SOLAR ACTIVITY: Sunspot AR3327 has developed an unstable 'delta-class' magnetic field that poses a threat for strong solar flares. This morning (June 7th @ 1146 UT) it produced an M4.5-class explosion (movie) and a radio blackout over Africa (map). More flares are in the offing as the sunspot turns toward Earth. SpaceWeather.com

AR3323 (S08E06 size 330MH) has a beta-gamma magnetic field that harbors energy to produce M-class flares.

● Auroral Activity

The geomagnetic field has been at quiet levels for the past 24 hours. Solar wind speed reached a peak of 376 km/s (Normal speed) at 22:30 UTC June 07 Total IMF reached -4 nT at 23:39 UTC the same day.

Aurora Oval Bz: 0.93 nT North
aurora-map.jpg

● Current Conditions at 03: 30 UTC on June 08

▪︎ Geospace quiet (kp 2)
▪︎ Solar wind speed record: 362.1 km/sec (Normal speed)
▪︎ density: 3.82 p/cm³ (low density)
▪︎ Interplanetary Magnetic Field (IMF)
Bt: 8.09 nT (normal nano-Tesla valor)
▪︎ Neutron Counts today: -0.6 % (Below average)
▪︎ X-ray Solar Flare: C3 at 02:50 UTC
▪︎ Sunspot number: 177 (SN 133 June 07)
▪︎ Spotless Days 2023 total: 0 days (0%)
-
-SpaceWeatherlive..com
-SpaceWeather.com
 
As a cross-information I just saw the last crop circle, which can be interpreted as a double sun in alignment or an increase in solar intensity.
DJI_20230607065741_0080_D.jpg

I think the crop circle looks more like a Mandala.

mandalas-para-colorear-1z-z.jpg

The Lotus flower is used in Mandalas. In Asia it is believed that it emerges from the muddy waters but that is not an impediment for it to show its beauty when it opens its leaves with the arrival of the sun.

Thus, the lotus flower symbolizes the closure of a stage that has been especially negative, so it is often used when you want to start a new beginning, a future marked by hope.

Well, this is just one interpretation and could mean other things such as solar activity, which in fact in this cycle 25 has already exceeded projections.
 
SOLAR CYCLE 25 ACTIVITY REPORT JUNE 09_2023

Solar activity has been at low levels for the past 24 hours. The largest solar event of the period was a C7.2 event observed at 04:59 UTC on June 08 from Region 3327 (S16E14)

NOAA declares the arrival of El Nino.​

The expected El Nino has emerged, according to scientists at NOAA’s Climate Prediction Center, a division of the National Weather Service. In the monthly outlook released today, forecasters issued an El Nino Advisory, noting that El Nino conditions are present and are expected to gradually strengthen into the winter.

El Nino is a natural climate phenomenon marked by warmer-than-average sea surface temperatures in the central and eastern Pacific Ocean near the equator, which occurs on average every 2-7 years. El Nino’s impacts on the climate extend far beyond the Pacific Ocean.

"Depending on its strength, El Nino can cause a range of impacts, such as increasing the risk of heavy rainfall and droughts in certain locations around the world," said Michelle L'Heureux, climate scientist at the Climate Prediction Center. "Climate change can exacerbate or mitigate certain impacts related to El Nino. For example, El Nino could lead to new records for temperatures, particularly in areas that already experience above-average temperatures during El Nino.”

El Nino’s influence on the U.S. is weak during the summer and more pronounced starting in the late fall through spring. By winter, there is an 84% chance of greater than a moderate strength El Nino, and a 56% chance of a strong El Nino developing. Typically, moderate to strong El Nino conditions during the fall and winter result in wetter-than-average conditions from southern California to along the Gulf Coast and drier-than-average conditions in the Pacific Northwest and Ohio Valley. El Nino winters also bring better chances for warmer-than-average temperatures across the northern tier of the country.

A single El Nino event will not result in all of these impacts, but El Nino increases the odds of them occurring.

The anticipated persistence of El Nino also contributed to the 2023 Atlantic and Eastern Pacific Hurricane Outlooks issued by NOAA last month. El Nino conditions usually help to suppress Atlantic Hurricane activity, while the presence of El Nino typically favors strong hurricane activity in the central and eastern Pacific Basins.

The Climate Prediction Center’s seasonal temperature and precipitation outlooks will continue to take into account current and forecasted El Nino conditions. These seasonal outlooks are updated monthly, with the next update on June 15. The Atlantic Hurricane Season Outlook will be updated in early August.

Scientists have been forecasting the development of El Nino for the last few months and issued the first El Nino Watch on April 13.
National Weather Service

There are currently 11 numbered sunspot regions on the solar disk: AR3320, AR3321, AR3323, AR3324, AR3325, AR3326, AR3327, AR3329, AR3330, AR3331 and new region AR3332
hmi200.jpg
Total number of sunspots has decreased to 149 (62 of these are grouped into 11 active regions) NOAA forecasts for the next 24h: 99% chance for C flares, 30% chance for M flares and 10% chance for X flares.
CHANCE OF FLARES: NOAA forecasters say there is a 30% chance of M-class solar flares and a 10% chance of X-flares today, June 8th. The likely source would be sunspot AR3327, which has an unstable 'delta-class' magnetic field. Any explosions will be geoeffective as the sunspot is almost directly facing Earth. SpaceWeather.com
AR3327 (S16E14 size 270MH) has a beta-gamma-delta-class magnetic field that harbors energy for M and X-class flares.

AR3323 (S08W35 size 150MH) has a beta-gamma magnetic field that harbors energy to produce M-class flares.

● Auroral Activity

The geomagnetic field has been at quiet levels for the past 24 hours. Solar wind speed reached a peak of 367.3 km/s (Normal speed) at 20:23 UTC June 08 Total IMF reached 8.85 nT at 00:01 UTC the same day.

Aurora Oval Bz: 2.89 nT North
aurora-map.jpg

● Current Conditions at 04: 00 UTC on June 09

▪︎ Geospace quiet (kp 1)
▪︎ Solar wind speed record: 304.7 km/sec (Normal speed)
▪︎ density: 2 32 p/cm³ (low density)
▪︎ Interplanetary Magnetic Field (IMF)
Bt: 4.69 nT (normal nano-Tesla valor)
▪︎ Neutron Counts today: -0.8 % (Below average)
▪︎ X-ray Solar Flare: C2 at 00:07 UTC
▪︎ Sunspot number: 149 (SN 177 June 08)
▪︎ Spotless Days 2023 total: 0 days (0%)
-
-SpaceWeatherlive..com
-SpaceWeather.com
 
SOLAR CYCLE 25 ACTIVITY REPORT JUNE 10_2023

Solar activity has been at moderate levels for the past 24 hours. The largest solar event of the period was a M2.5 event observed at 17:11 UTC on June 09 from Region 3331 (S22E37) it caused a Minor R1 radio blackout over Gulf of Mexico

M-CLASS SOLAR FLARE: Sunspot AR3331 exploded on June 9th (1711 UT), producing an M2.5-class solar flare. NASA's Solar Dynamics Observatory captured the extreme ultraviolet flash:​
A pulse of radiation ionized the top of Earth's atmosphere. This, in turn, caused a minor blackout of shortwave radio transmissions over the Gulf of Mexico: map. Mariners may have noticed loss of signal at frequencies below 15 MHz for as much as 30 minutes after the flare.

Priviously, this sunspot was not thought to pose a threat for strong solar flares. AR3331 may have some tricks up its sleeve as it turns toward Earth this weekend. SpaceWeather.com​
MANY FARSIDE SUNSPOTS: Helioseismic maps of the farside of the sun show multiple large active regions, probably sunspots. This means the sunspot number should remain high as the sun turns on its axis in the weeks ahead. Disappearing Earthside sunspots will be replaced by farside counterparts. SpaceWeather.com

There are currently 9 numbered sunspot regions on the solar disk: AR3320, AR3321, AR3323, AR3326, AR3327, AR3329, AR3330, AR3331, AR3332
AR3324, AR3325 are gone
hmi200.gif

Total number of sunspots has increased to 152 (62 of these are grouped into 9 active regions) NOAA forecasts for the next 24h: 99% chance for C flares, 25% chance for M flares and 5% chance for X flares due to decaying active regions

AR3327 (S16E02 size 180MH) is decaying and now has a beta-gamma magnetic field that harbors energy for M-class flares.

AR3323 (S08W46 size 70MH) has a stable beta magnetic field and will be leaving the solar disk this weekend

● Auroral Activity

The geomagnetic field has been at quiet levels for the past 24 hours. Solar wind speed reached a peak of 366 km/s (Normal speed) at 13:27 UTC June 09 Total IMF reached 11 nT at 11:12 UTC the same day.

Aurora Oval Bz: 2.69 nT North
aurora-map.jpg
Current Conditions at 04: 00 UTC on June 10

▪︎ Geospace quiet (kp 1)
▪︎ Solar wind speed record: 313.6 km/sec (Normal speed)
▪︎ density: 3.22 p/cm³ (low density)
▪︎ Interplanetary Magnetic Field (IMF)
Bt: 2.96 nT (normal nano-Tesla valor)
▪︎ Neutron Counts today: -0.2 % (Below average)
▪︎ X-ray Solar Flare: C2 at 23:42 UTC
▪︎ Sunspot number: 152 (SN 149 June 09)
▪︎ Spotless Days 2023 total: 0 days (0%)
-
-SpaceWeatherlive..com
-SpaceWeather.com
 
SOLAR CYCLE 25 ACTIVITY REPORT JUNE 11_2023

Solar activity has been at low levels for the past 24 hours. The largest solar event of the period was a C4 event observed at 18:51 UTC on June 10 from Region 3327 (S15W13).

There are currently 9 numbered sunspot regions on the solar disk: AR3320, AR3321, AR3323, AR3326, AR3327, AR3329, AR3330, AR3331, AR3332

Total number of sunspots has decreased to 116 (62 of these are grouped into 9 active regions) NOAA forecasts for the next 24h: 99% chance for C flares, 25% chance for M flares and 5% chance for X flares due to decaying active regions

AR3327 (S16E02 size 180MH) is decaying and now has a beta-gamma magnetic field that harbors energy for M-class flares.

● Auroral Activity

The geomagnetic field has been at quiet levels for the past 24 hours. Solar wind speed reached a peak of 369 km/s (Normal speed) at 20:38 UTC June 10 Total IMF reached 5 nT at 09:27 UTC the same day.

Aurora Oval Bz: 3.5 nT North
aurora-map.jpg
● Current Conditions at 03: 40 UTC on June 11

▪︎ Geospace unsettled (kp 3)
▪︎ Solar wind speed record: 357.3 km/sec (Normal speed)
▪︎ density: 4.95 p/cm³ (low density)
▪︎ Interplanetary Magnetic Field (IMF)
Bt: 15.17 nT (Magnetic Field Moderately strong)

▪︎ Neutron Counts today: -0.1 % (Below average)
▪︎ X-ray Solar Flare: C2 at 02:02 UTC
▪︎ Sunspot number: 116 (SN 152 June 10)
▪︎ Spotless Days 2023 total: 0 days (0%)
-
-SpaceWeatherlive..com
-SpaceWeather.com
 
Valentina Zharkova - Heartbeat of the Sun - Terrestrial Volcanic Eruptions Links With Solar Activity
Premiered Jun 10, 2023 Oppenheimer Ranch Project
Prof Valentina Zharkova https://www.northumbria.ac.uk/about-u...VALENTINA ZHARKOVA'S GSM A site to report about my research in solar activity and energetic particles https://solargsm.com/2023/Heartbeat of the Sun from Principal Component Analysis and prediction of solar activity on a millennium timescale https://www.nature.com/articles/srep1...Terrestrial volcanic eruptions and their possible links with solar activity https://solargsm.com/wp-content/uploa...
 
SOLAR CYCLE 25 ACTIVITY REPORT JUNE 12_2023

ALL QUIET. Solar activity has been at low levels for the past 24 hours. The largest solar event of the period was a C5 event observed at 21:16 UTC on June 11 from Region 3323 (S08W61)

A MEGA-BUBBLE IN THE SUN'S ATMOSPHERE: Last week, NOAA released a list of space weather highlights so far from Solar Cycle 25. Visually, the most spectacular was an X1-class solar flare on Oct. 28, 2021, which blew a mega-bubble in the sun's atmosphere:​
bubble_half_strip_opt.gif
NOAA's GOES-16 satellite recorded the event using an extreme ultraviolet telescope called the Solar Ultraviolet Imager (SUVI). Compared to NASA's better-known Solar Dynamics Observatory, SUVI has a wider field of view which allows it to capture extremely large structures like this.​
The expanding bubble pushed a CME out of the sun's atmosphere. At the time, space weather forecasters predicted it would hit Earth and trigger a strong geomagnetic storm. That's not what happened, though. The CME passed mostly south of our planet, delivering only a glancing blow. The resulting G1-class geomagnetic storm on Oct. 31, 2021, was a minor event with only a brief display auroras over Canada.​
NOAA's list of highlights will grow longer in the years ahead. Solar Cycle 25 is still a relatively young cycle with maximum activity expected in 2024-2025. The next mega-bubble might have better aim. SpaceWeather.com​

There are currently 8 numbered sunspot regions on the solar disk: AR3321, AR3323, AR3326, AR3327, AR3329, AR3330, AR3331, AR3332
AR3320 is gone

Total number of sunspots remains at 116 (62 of these are grouped into 8 active regions) NOAA forecasts for the next 24h: 99% chance for C flares, 20% chance for M flares and 5% chance for X flares due to decaying active regions

AR3327 (S17W28 size 130MH) is decaying and now has a beta-gamma magnetic field that harbors energy for M-class flares.

● Auroral Activity

The geomagnetic field has been at quiet to unsettled levels for the past 24 hours. Solar wind speed reached a peak of 479 km/s (Normal speed) at 19:50 UTC June 11 Total IMF reached 15 nT (Magnetic Field Moderately strong) at 03:04 UTC the same day.

Aurora Oval Bz: 2.42 nT North
aurora-map.jpg

● Current Conditions at 04: 00 UTC on June 11

▪︎ Geospace quiet (kp 2)
▪︎ Solar wind speed record: 457.1 km/sec (Elevated speed)
▪︎ density: 7.51 p/cm³ (low density)
▪︎ Interplanetary Magnetic Field (IMF)
Bt: 6.94 nT (Normal Magnetic Field)
▪︎ Neutron Counts today: -0.7 % (Below average)
▪︎ X-ray Solar Flare: C1 at 01:42 UTC
▪︎ Sunspot number: 116 (SN 116 June 11)
▪︎ Spotless Days 2023 total: 0 days (0%)
-
-SpaceWeatherlive..com
-SpaceWeather.com
 

Screenshot 2023-06-12 at 13-05-35 Andy Smith on Twitter.png

Screenshot 2023-06-12 at 12-37-15 Andy Smith on Twitter.png


POSSIBLE GLANCING-BLOW CME: NOAA forecasters say that a CME might hit Earth's magnetic field on June 13th. It was hurled into space by an M2.5-class explosion (movie) on June 9th. The glancing blow could cause, at most, G1-class geomagnetic storms. Aurora alerts: SMS Text

A MEGA-BUBBLE IN THE SUN'S ATMOSPHERE: Last week, NOAA released a list of space weather highlights so far from Solar Cycle 25. Visually, the most spectacular was an X1-class solar flare on Oct. 28, 2021, which blew a mega-bubble in the sun's atmosphere:​

bubble.gif
See also a contrast-enhanced movie of the explosion.​

NOAA's GOES-16 satellite recorded the event using an extreme ultraviolet telescope called the Solar Ultraviolet Imager (SUVI). Compared to NASA's better-known Solar Dynamics Observatory, SUVI has a wider field of view which allows it to capture extremely large structures like this.

The expanding bubble pushed a CME out of the sun's atmosphere. At the time, space weather forecasters predicted it would hit Earth and trigger a strong geomagnetic storm. That's not what happened, though. The CME passed mostly south of our planet, delivering only a glancing blow. The resulting G1-class geomagnetic storm on Oct. 31, 2021, was a minor event with only a brief display auroras over Canada.

NOAA's list of highlights will grow longer in the years ahead. Solar Cycle 25 is still a relatively young cycle with maximum activity expected in 2024-2025. The next mega-bubble might have better aim. Stay tuned! Solar flare alerts: SMS Text


Back
Top Bottom