The Ice Age Cometh! Forget Global Warming!

4 feet of summer snow on road to Chandratal lake hindering evacuation of 293 stranded tourists in Himachal Pradesh, India.
A video grab.
A video grab.
Heavy snow on the way to Chandratal Lake from Losar in Himachal Pradesh's Lahaul and Spiti district has proved a major deterrent for the district administration to evacuate the 293 stranded tourists out of the area safely for the past four days.

The tourists were stranded at Chandratal since Saturday due to blockade of road in the region.

On Tuesday, a rescue team comprising the Indo Tibetan Border Police (ITBP) and Border Roads Organisation (BRO) personnel, local youths and officials led by Kaza ADC Rahul Jain moved towards Chandratal from Losar, but heavy snow on the Losar-Chandratal road disrupted their access to the site.

The BRO started the snow clearing operation on the road on Tuesday and were able to restore only 12km of road from Losar towards Chandratal.

According to officials, 25-km-long road is still covered under thick blanket of snow upto Chandratal
, where up to 4 feet of snow has been reported.
Due to freezing temperatures in the region, the BRO could not continue the restoration work on the road, which resumed on Wednesday morning.

On Tuesday, seven critically ill tourists were evacuated from Chandratal to Bhunter airport, Kullu, in an Indian Air Force chopper.

The state government has deployed six choppers to evacuate stranded tourists. All stranded tourists are safe at Chandratal, said officials.
 
There was recently pretty intense flooding on the Russia's Black Sea coast.

TASS_53973216.jpg

photo_2022-07-25_09-12-46.jpg


photo_2022-07-25_11-35-37.jpg


photo_2022-07-25_11-37-58.jpg


Up to two months of rainfall in four days on the Russia's Black Sea coast. Here is a precipitation map from Gismeteo.ru:

RR-640x583.jpg


What is interesting, is Gismeteo's explanation of why it happened. Translated from Russian:

The cause of the anomalous rains, which resulted in great damage, was the deepening of the polar trough. Arctic air spread far to the south. Its collision with the heat of subtropical seas caused the formation of powerful convective systems.

What caused the polar trough to spread so much to the south is not explained.
 
What caused the polar trough to spread so much to the south is not explained.

I think that has been explained elsewhere - I got that from one of Valentina Zakharova's more recent video, but don't remember where I saw it.

As far as I understand, under certain circumstances (which I don't remember) the jetstream, which flows in a fairly uniform circle around the globe suddenly starts to wobble and meander. Thus arctic cold air flows to far lower latitudes, while at the same time, kinda next to it, warm air from lower latitudes flows to much higher latitudes than usual, creating unusually hot weather for those latitudes.

I found this graphic illustration on a mainstream climate blog, but you get the drift:

Voila_Capture 2023-07-15_20-45-38_.jpg
 
This post began as a response to the ice in Greenland, which then connected to revisiting the North Atlantic Oscillation, which again led to the topic of the Arctic Oscillation and later on a comment on wind directions and the recent flooding in Russia.

The melting of the ice in Greenland was off to a late start
A part of the image from June 28, showed:
1689938618176.png
A newer image shows the trend as of July 20:

1689938705700.png
From now on, the rate of melting usually begins to decrease.

1689938372940.png
Nature or the model tries to make up for a late start:
1689940133034.png
The melt extent area does not translate directly to melt extent in terms of units of volumes of water. There is a difference for the effect of melting if the air is just above freezing or well above freezing. Both would qualify to give a red colour in the map, but not lead to the same amount of melting. If one goes to Ventusky one can get an idea of the temperatures. like this from the time of posting:

1689941818200.png
The Polarportal page about current weather has this image below, which shows predominant wind directions with temperature anomalies for the current period. Parts of Greenland are warmer, some slightly cooler, or as usual.

1689944115826.png
Note the small diagrams, in the lower left corner, which shows the North Atlantic Oscillation index for since May 1.
The North Atlantic Oscillation
The Polar Portal has:
Generally speaking, there is very often high pressure over the Azores and surrounding areas, whilst there is very often low pressure over Iceland. The pressure difference between the Azores and Iceland varies over time, and this variation is described by the so-called North Atlantic Oscillation (NAO). The NAO index is thus a measure of how strong westerly winds are over the East Atlantic and surrounding regions. If the pressure difference is great, strong westerly winds blow, and we say that the NAO index is positive; if the pressure difference is small, the westerly winds will be light, and the NAO negative. Occasionally, the pressure over Iceland may even be higher than that over the Azores. This will result in an easterly wind and a strongly negative NAO index.

In simple terms, a high NAO index means mild winters and cool summers in large parts of Europe, whilst a negative index results in cold winters and hot summers. It has also been a well-known phenomenon for more than 250 years that it is often cold in Greenland when it is warm in Denmark, and vice versa. When the NAO index is negative, the weak westerly air currents have a tendency to exhibit greater curvature, which increases the probability of warmer air from the south flowing up towards Greenland.

The NAO index can be determined in different ways. It can, for example, be seen directly from measurements of air pressure on Iceland and the Azores or Gibraltar. Re-analyses, however, are performed on a grid, and it is therefore more accurate to use a so-called EOF analysis, which provides more or less the same result, although based on the distribution of pressure throughout the Atlantic region.

The NAO index presented here on this page is calculated by the Climate Prediction Center at NOAA/ National Weather Service, and the calculation is described here.

Daily NAO data is obtained here.
The NAO index varies, sometimes negative, sometimes positive. One illustration found here shows:

1689945039139.png
From a German Wiki page about the NOA, there is an illustration of what it means for the winds and the weather:
1689947371128.png
The North Atlantic Oscillation connects to Arctic Oscillation.
The Wiki explains:
The Arctic oscillation (AO) or Northern Annular Mode/Northern Hemisphere Annular Mode (NAM) is a weather phenomenon at the Arctic pole north of 20 degrees latitude. It is an important mode of climate variability for the Northern Hemisphere. The southern hemisphere analogue is called the Antarctic oscillation or Southern Annular Mode (SAM). The index varies over time with no particular periodicity, and is characterized by non-seasonal sea-level pressure anomalies of one sign in the Arctic, balanced by anomalies of opposite sign centered at about 37–45° N.[1]

The North Atlantic oscillation (NAO) is a close relative of the Arctic oscillation. There is debate over whether one or the other is more fundamentally representative of the atmosphere's dynamics. The NAO may be identified in a more physically meaningful way, which may carry more impact on measurable effects of changes in the atmosphere.[2]
In June 2023, the Arctic oscillation index was slightly negative according to the data set.

How the Arctic oscillation index is calculated
The Arctic oscillation index is defined using the daily or monthly 1000 hPa geopotential height anomalies from latitudes 20° N to 90° N. The anomalies are projected onto the Arctic oscillation loading pattern,[5] which is defined as the first empirical orthogonal function (EOF) of monthly mean 1000 hPa geopotential height during the 1979-2000 period. The time series is then normalized with the monthly mean index's standard deviation.
Of importance in the above description is geopotential height:
Geopotential height or geopotential altitude is a vertical coordinate referenced to Earth's mean sea level (assumed zero potential) that represents the work done by lifting one unit mass one unit distance through a region in which the acceleration of gravity is uniformly 9.80665 m/s2.[1] Geopotential height (altitude) differs from geometric (tapeline) height but remains a historical convention in aeronautics[2] as the altitude used for calibration of aircraft barometric altimeters.
The topic of barometric altimeters is found under pressure altitude:
Pressure altitude is the altitude in the International Standard Atmosphere (ISA) with the same atmospheric pressure as that of the part of the atmosphere in question.

The National Oceanic and Atmospheric Administration (NOAA) published the following formula[1] for directly converting atmospheric pressure in millibars (mb) to pressure altitude in feet (ft):

ℎ=145366.45[1−(Station pressure in millibars/1013.25)^0.190284].
Assuming a standard pressure of 1013.25 millibar which is the same a 10025.25 hectopascal (hPa )at surface, a pressure indication in a plane can be converted to an altitude using a table or a calculator. In this way, a pressure of a 1000 hPa, corresponds to an altitude of 363.6 ft or 110.8 meters. Returning to the Wiki about the Arctic Oscillation, there is an image of the loading pattern, which from what I understand shows the average deviation of where the 1000 hPa level is found compared to expected. In the yellow and red areas, it is found at a higher altitude and in the blue areas at a lower altitude.

1689949428659.png
If we imagine a low pressure in the blue area, then the air will flow counterclockwise, whereas a high pressure system over the red area will push the air in a clockwise direction. Between them, the air will be pushed from West to East giving a westerly wind. If the low pressure is deep and the high pressure high, then the push will be stonger than if they both are weak.
Next is the image illustrating the concepts of a negative and a negative and a positive Arctic Oscillation:
1689948708472.png

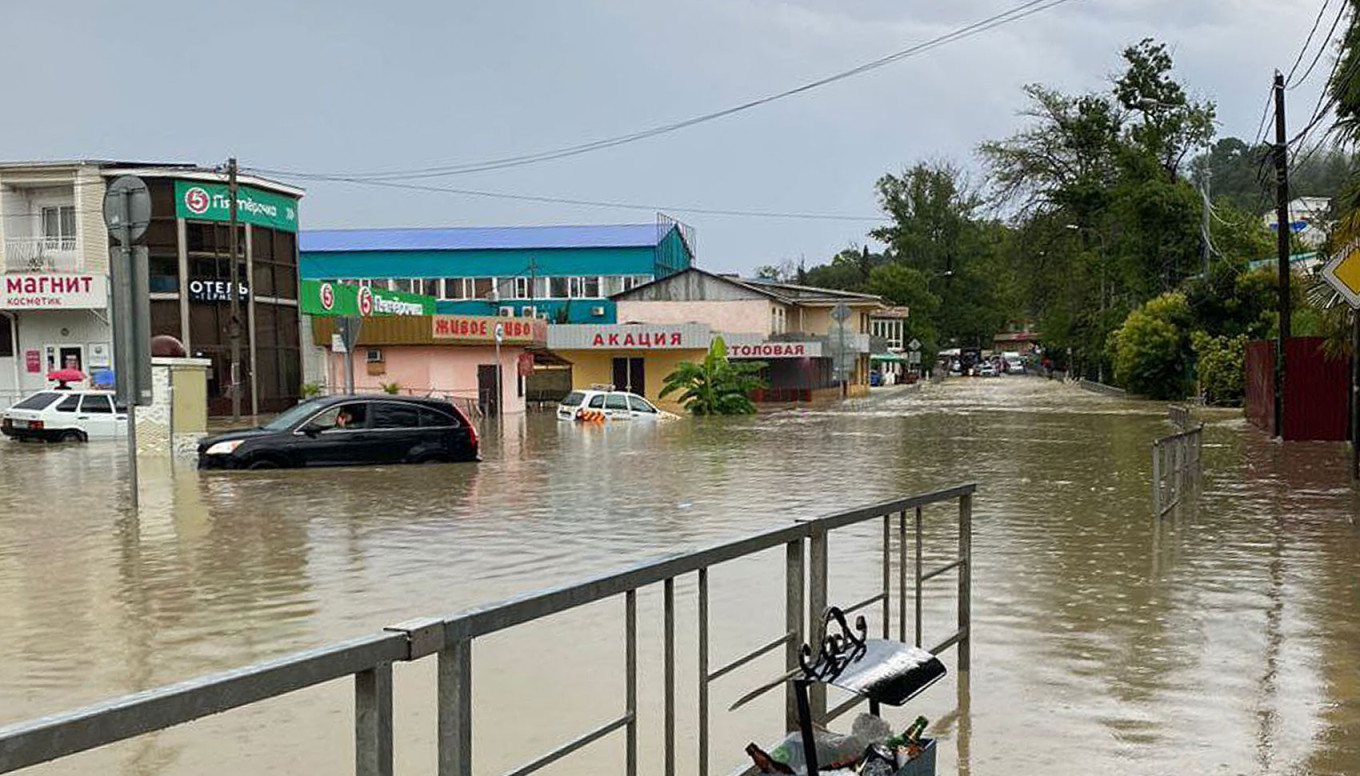
A comment on the flooding in Russia
What caused the polar trough to spread so much to the south is not explained.
Maybe a negative NOA index, favouring weak westerlies and meandering air currents, was a contributing factor for the downpour on the Black Sea. This is along the lines that @nicklebleu suggested:
As far as I understand, under certain circumstances (which I don't remember) the jetstream, which flows in a fairly uniform circle around the globe suddenly starts to wobble and meander.
However, if one looks into the index, then it has been positive and negative many times without causing such flooding. Perhaps it was not so much that the low pressure system went south that caused the influx of cold air, but more that the low pressure system became unusually deep, thus allowing it to set in motion a larger mass of air and forcefully pull in much more cold air from the Arctic regions.

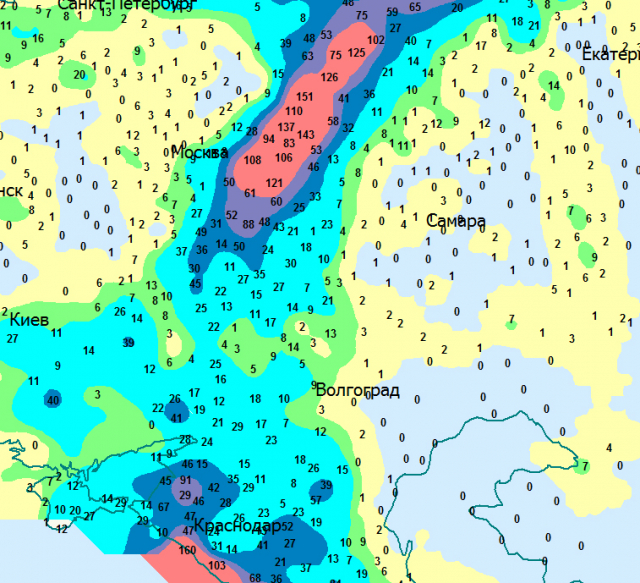
To verify this idea, one would need a map of where the centre of the low was, how it moved, and how deep it was. Even if this is not included in the Russian article, to get an impression of how large an area even a small low can affect, the next map of the current situation from Gismeteo, shows a small low pressure system, 995 millibars, close to Arkhangelsk, (the round circle to the upper right) which influences the direction of the wind directions in Scandinavia up to 2000 km away, and pulls in cold air from the north, giving people cloudy, and rainy summer days with temperatures around 15 degrees Celsius.
1689958377182.png
If a small low can move air 2000 km away, then an even deeper low should be able to move air still further away. Perhaps this is what happened for the regions near the Black Sea.
 
Good post from Glaziev’s TG:

Heat-crazed carbon dioxide activists and journalists are ringing the bells, accusing developed countries of failing to meet their obligations to reduce its emissions.
The fighters against carbon dioxide emissions refer to the consensus, as it exists in the world scientific community, that it is anthropogenic greenhouse gas emissions that are the main cause of global warming. However, there is no consensus on this issue among scientists. Many of them, having succumbed to pressure and direct bribery through grants, publications and academic degrees from those interested in destroying the traditional energy of forces, really sing along with them in full voice. At the same time, the voices of those authoritative scientists who have not succumbed to this pressure and remain objective are shut up. Just yesterday, the IMF canceled a speech at an international conference by Nobel laureate Clauser, who questioned the leading role of anthropogenic greenhouse gas emissions in global warming.
The research of Russian scientists, recently presented at our Scientific Council of the Russian Academy of Sciences (previously, at the end of May, published on this channel), showed very clearly that their real role is reduced to 0.01%. The main role in climate change is played by fluctuations in solar activity, including a long-term decrease in the angle of inclination of the earth, as well as heating of the earth's surface from the inside due to thermal energy emitted during the decay of the potassium isotope 40. An important additional factor is the degassing of natural hydrogen, over the places of which ozone holes are formed, entailing increased exposure to solar radiation on the Earth's surface and a sharp increase in the likelihood of forest fires. By the way, along the way, the "scientific" basis of the Montreal Protocol was completely exposed, fulfilling which we destroyed entire branches of the chemical industry and undermined the competitiveness of our refrigeration equipment. Despite the almost complete cessation of freon production, ozone holes not only did not disappear, but also multiplied in size and geography. Today we can reliably state that the Montreal Protocol was based on falsified data and false hypotheses. It is no accident that Soviet scientists criticized it and refused to sign it. Approximately the same picture is emerging with the Paris Agreement. The underlying hypothesis that global warming is caused by the results of human economic activity, and specifically by an increase in carbon dioxide emissions, is based not on an analysis of cause—and-effect relationships, but on a simple correlation between the average planetary temperature and carbon dioxide emissions due to economic activity. The degree of scientific validity here is the same as in the statement that global warming is caused by an increase in average human growth — there will also be an almost 100% correlation between this indicator and the average planetary temperature. Will we conclude from this that in order to stop global warming, we need to fight growth hormone in children?
Unfortunately, even if we completely stop economic activity and do not create greenhouse gases, global warming will not stop. It will continue, and climate disasters will become more frequent for reasons beyond human control. And instead of fighting for the commercial interests of new energy lobbyists, the available resources should be focused on anticipating climate change and developing measures to neutralize their harmful effects. In particular, we can predict with high reliability fluctuations in the intensity of hydrogen degassing from the bowels of the Earth, affecting the dynamics of ozone holes and fire hazard, as well as the intensity of heavy rains in various regions. We also have to accept the inevitability of global warming in the foreseeable future and focus on adapting humanity to this process.


By the way, dear forumites from Europe, could you please comment on temperature in your places. That is mass media forecast from a couple of days ago. There are opinions, that they over-blow the real temperature the same way they made with covid victims.
F783C719-15FC-4F72-BE68-4229ADB3BFF9.jpeg
 
Last edited:
By the way, dear forumites from Europe, could you please comment on temperature in your places. That is mass media forecast from a couple of days ago. There are opinions, that they over-blow the real temperature the same way they made with covid victims.
Check the end of the latest show:
Which referred to Record Breaking Heatwave in Europe?, see:
One point being made is that certain issues, like this expected heat forecast, become the focus of hysterical attention, while other real factual occurrences that could cause concern, or could need a broader context for greater understanding, remain ignored, and underreported. The result is that people are left misinformed.

When extreme temperature claims come up, one can look at other representations of data, like the temperature anomaly map posted by Polarportal.dk averaged over the last few days
1690146460623.png
It was a little warmer in the Mediterranean area, but nothing exceptional for the summer. However, some parties need a unified truth to guide the politics.
The "unified version of the truth" in Western democracy.

There was on the TG channels Underside, if translated to English an introduction to a long article about the work done in Britain to control the populations psychologically. It was introduced during COVID and has since been used in G7 countries
Which in this instance might connect to the politics of depopulation written about in this thread: Depopulation of a Planet, where this post, has an image that puts climate change in the middle and at the top:
1690148271065.png
In the country I live, the united scout organizations issued a strong appeal to the PM to take even more political action with respect to climate change. We can add that if the population asks for more control, they may well get it.

And is it more than a coincidence that Zelensky is received with cold shoulders, while others try to turn on the heat elsewhere, fudging the data COVID style to support an alarming headline. And what can we do about it? An article from 2009: Fudging Data: The How, The Why and Catching it ends:
As the saying goes- In God we Trust, Everybody else has to bring data (which we will have to check before trusting it)
 
Ramping up the fear porn?

As temperatures rise in BC, experts worry about the risks of indoor heat to our health. The City of Vancouver is asking residents to fill out an indoor temperature survey as it seeks to create better policy dealing with extreme heat in the area

Btw, it is so cold here you need a jacket...:-D

(Oh, and the government is going to be giving away free air conditioners... )


Vancouver residents asked to track, report hot indoor temperatures​


Elizabeth_McSheffrey_Web1.jpg


By Elizabeth McSheffrey Global News


Posted July 24, 2023 1:37 pm


As temperatures rise in BC, experts worry about the risks of indoor heat to our health.
View image in full screen
As temperatures rise in BC, experts worry about the risks of indoor heat to our health. The City of Vancouver is asking residents to fill out an indoor temperature survey as it seeks to create better policy dealing with extreme heat in the area. Alan Schein Photography


The City of Vancouver is encouraging residents to track their indoor temperatures this summer as part of a survey to inform regulation and policy that deals with extreme heat.


70c8fc80

The survey, conducted after the fatal heat dome two years ago, is meant to provide the municipality, Vancouver Coastal Health and BC Centre for Disease Control with data for programs “to protect residents and provide more cooling spaces,” the city said Monday.

“The survey takes approximately six minutes to complete and indoor temperatures can be measured using a digital wall thermostat, free-standing thermometer, a food thermometer, or a standard manual thermometer,” it wrote in a news release.

“Respondents are encouraged to record the temperature in the late afternoon or evening when indoor temperatures are highest.”


Click to play video: 'Renters in B.C. told they can’t have air conditioners'


2:09 Renters in B.C. told they can’t have air conditioners


To date, some 6,000 residents have submitted results. The city said this year’s survey is expected to be the last.


Results so far have indicated that residents are becoming increasingly concerned about about climate change, and those concerns are elevated during periods of extreme heat. The survey has also found that many rely on accessing cooling opportunities outside their home.

In June, the B.C. government announced $10 million in funds to provide an estimated 8,000 vulnerable residents with air conditioners over the next three years.

More than 600 people died during the province’s record-breaking heat dome between June 25 and July 1, 2021. The village of Lytton, in particular, set a national record for the hottest temperature ever recorded at 49.5 C on June 29, 2021.


Click to play video: 'B.C. government to provide air conditioners for some at-risk individuals'


4:32 B.C. government to provide air conditioners for some at-risk individuals


In the aftermath of the casualties, a report from the BC Coroners Service recommended changes to the province’s building codes to require “passive and active cooling” in both new and existing developments by 2024. Passive cooling includes building design options like insulation, air tightness, ventilation and shading. Mechanical — or active — options include heat pumps and air conditioning.

The report, published last August, found that 98 per cent of those who died in the 2021 heat wave were indoors and most victims “lived in socially or materially deprived neighbourhoods,” compared with the general population. It estimated 93 per cent may have been without air conditioning and 76 per cent may have been without a fan.


Click to play video: 'B.C. to invest $10 million in free air conditioners for vulnerable residents'


2:16 B.C. to invest $10 million in free air conditioners for vulnerable residents


Vancouver’s indoor temperature survey is open online until Sept. 10.

Residents are asked to record their indoor temperature on hotter days, as well as information on their building’s characteristics and any barriers they experience trying to access cool weather inside or outside their homes.

The city recommends that if indoor temperatures exceed 31 C, people seek out an air-conditioned space or public cooling centres, a list of which is available online. A map of public fountains and misting stations active during the summer is also available on the city’s website

Symptoms of heat exhaustion include heavy sweating, dizziness, nausea or vomiting, rapid breathing, headache, extreme thirst, muscle cramps, dark urination and new skin rashes, according to Vancouver Coastal Health.
 
🤔 It's all coming together. Just like, the sessions said, sweet! 🥶

See you tomorrow in the #Hochalpen part #WintereinbruchBut despite the coolest day this #Juli , we are far away from the record value for the coldest day in July. In #Bern on July 6, 1948 there was a #Höchsttemperatur of only 9.6 degrees. ^yes

Behind the cold front that reaches us on Tuesday, colder and colder air flows to us, which originally comes from Greenland. Thus, the snow line drops temporarily to 2400 to locally below 2000 m. A similar onset of winter also occurred, for example, on July 14, 2016. On this day, Säntis reported a new snowfall of 13 cm, the July new snowfall record is 44 cm on July 9, 1996.

Such a cold snap
is therefore not unusual in July and can happen every now and then. However, we are far from the lowest maximum temperatures on Wednesday. The records are 10.3 in Basel, 10 in Lucerne, 9.6 in Bern, and even 8 degrees on the Zurichberg.

Screenshot 2023-07-26 at 14-15-40 Frühherbstliche Temperaturen - Der kälteste Tag im Juli.png


A phenomenon that has become rare: snowfall in summer below 2000 m altitude. Feratel

The #neige therefore made its return to the Northern Alps from 2500/2600 meters, here at the Conscrits refuge (74) in the Mont-Blanc massif. Thanks to Sylvain for his photo.
https://twitter.com/ThomasBlanchar2/status/1684090865633882113/photo/1
 
The survey, conducted after the fatal heat dome two years ago, is meant to provide the municipality, Vancouver Coastal Health and BC Centre for Disease Control with data for programs “to protect residents and provide more cooling spaces,” the city said Monday.
I saw this reported on the local news a couple nights ago.
Isn’t it so touching, so wonderfully caring, and opportunistic that ol Bonnie Henry and her lap dog, Adrian Dix are amassing all the data from the surveys, “to protect residents”?
Results so far have indicated that residents are becoming increasingly concerned about about climate change, and those concerns are elevated during periods of extreme heat. The survey has also found that many rely on accessing cooling opportunities outside their home
Oh, of course “the residents” are concerned about climate change, it’s all they see on the programming box these days, and if it’s on T.V...then it’s the “experts” talkin’!
The report, published last August, found that 98 per cent of those who died in the 2021 heat wave were indoors and most victims “lived in socially or materially deprived neighbourhoods,” compared with the general population. It estimated 93 per
cent may have been without air conditioning and 76 per cent may have been without a fan.
Oh, but wait a minute...
What else was happening during that time?

Geez, it’s so long ago now, but, wait, wasn’t the heat dome a couple months after the “injection” program ramped right up?

Weren’t all those elderly “socially and materially deprived” recently injected with the Moderna Molotov mix?
I seem to recall, they were one of the first groups “invited”.
Oh, look at that! I found an article!
February - March: Approximately 400,000 individuals for dose 1
  • Community-based seniors 80+ (65+ Indigenous seniors and elders) –approximately 260,000 individuals
  • People experiencing homelessness and/or using shelters; provincial correctional facilities, group homes (adults); mental health residential care (adults) –up to approximately 40,000 of individuals
  • Long term home support recipients and staff –approximately 60,000 individuals
  • Hospital staff, community GPs and medical specialists –approximately 20,000 individuals
  • First Nation Communities –approximately 25,000”[…]
Remember when:
They were All locked in their low income apartments, or care home room, wearing one or several face masks, cowering in a corner, every window and door shut, some duct taped and papered over.
Never going out, or, letting anyone in.
Those elderly people were already ailing from disastrous side effects, dying already, and out of their minds scared of the invisible “killer Covid”.
Yeah, there’s quite a bit of evidence and information that contributes to the outcome of “the Heat dome” deaths that has been purposely left out.
Ramping up the fear porn?
Definitely ramping up the fear!
I’d also wonder about the safety and reliability of the free “air conditioner units” the government is so kindly offering and supplying.
***Warning! Way out Conspiracy Prediction incoming!***
Whose to say there won’t be a little AI gizmo or some preset little aerosol canister inside every “free” unit?
Set to go off at a certain point in time, or remotely triggered, and then...I don’t know, maybe deliver a new and improved “Gates” experiment?
Or just straight out euthanize the inhabitants and finish the job?
Geez, sorry about that last part.
I’m going out to my garden, it’s way too early to feel so jaded...
 
Such a cold snap is therefore not unusual in July and can happen every now and then. However, we are far from the lowest maximum temperatures on Wednesday. The records are 10.3 in Basel, 10 in Lucerne, 9.6 in Bern, and even 8 degrees on the Zurichberg

That’s quite the contortion … compare that to when the temperature is going by the same amount in the other direction, and everyone screams ”Global Warming! We’re all going to die!”. When it’s on the cold side - nothing unusual, the weather changes, nothing to see here!

Disgusting …
 

Record-Breaking 19 cm Hailstorm Hits Italy
Record-breaking 19 cm hailstone in Italy

Severe thunderstorms in Europe appeared to set a continental hail record twice in the span of five days in Italy.

The most recent rash of severe weather on Monday included supercell thunderstorms that dumped giant hail from parts of northern Italy into neighboring Slovenia.

One massive oblong hailstone recovered Monday night in Azzano Decimo, about 35 miles northeast of Venice, Italy, was estimated to be 19 centimeters - almost 7.5 inches - long.

According to the European Severe Storms Laboratory (ESSL), this was the largest diameter hailstone of record anywhere in Europe.


The giant hail and destructive winds uprooted trees, heavily damaged vehicles and destroyed crops, Pordenone Today reported.

Incredibly that European hail record only stood for five days prior to Monday.

Last Wednesday, there were two dozen reports of hail over 10 centimeters - almost 4 inches - in diameter received by the ESSL in Italy and Croatia.

Huge 20 cm hail in northern Italy, a new record could fall
Huge 20 cm hail in northern Italy.

That included a 16-centimeter - 6.3-inch - diameter hailstone recovered in Carmignano di Brenta, about 25 miles northwest of Venice, which the ESSL found topped the previous record size stone from June 20, 2016, in Romania.


The July 19 hailstorms injured over 100 in northeast Italy alone, and also damaged trees, homes and crops.

The World Meteorological Organization maintains official world weather records, including the heaviest hailstone (2.25 pounds in Bangladesh on April 14, 1986) and the deadliest hailstorm (246 killed in India on April 20, 1888).

However, no records for hail size are maintained by the WMO and no information was provided to ESSL about the weight of either of the Italian hailstones from July 19 or 24.

The July 24 hailstone was of comparable diameter to the U.S. record size hailstone, an 8-inch diameter giant recovered in Vivian, South Dakota, on July 23, 2010.
 
Comme cela c’est plus lisible. Etude du Lancet sur le supposé réchauffement climatique. En rouge les décès par an à cause de la chaleur. En bleu, à cause du froid.
Mais pourquoi ils ne veulent protéger que contre les vagues de chaud ???????????
1690709189382.png
That way it's more readable. Lancet study on supposed global warming. In red the deaths per year due to heat. In blue, because of the cold.
But why they only want to protect against heat waves???????????
 
Back
Top Bottom