Auroral Evidence of Upcoming Mini or Little Ice Age?
Guest Blogger /
8 hours ago March 9, 2019
Guest Opinion; Dr. Tim Ball
A
recent article in the British newspaper
The Express titled, “
Northern Lights in the UK: Can you watch Aurora Borealis from UK? Where can you see it?” raises interesting questions and comparisons with historical events. It also appears to reinforce the climate forecasts for the next few decades.
Source: Daily Express
Sir Edmund Halley (1656 – 1742) was one of the great astronomers in history. He proved his science in the best way possible by making an accurate prediction. He predicted the return of a comet that they then named after him. I became familiar with his work while working on the climate record of the Hudson’s Bay Company (HBC) at Churchill, Manitoba.
The record was given a great scientific boost when in 1768/9 two astronomers, William Wales and Joseph Dymond arrived in Churchill to measure the Transit of Venus. Halley first identified this event and devised a procedure to gather data to determine the distance of the Earth from the Sun. This distance was critical to accurately testing Newton’s theory of gravity. A Transit occurred in 1761, but lack of knowledge and a useable technique resulted in failure. The 1769 Transit was critical because another Transit would not occur for 105 years.
Sir Neville Maskelyne, President of the Royal Society, sent the astronomers. They brought a range of instruments made specifically for them by the Society to carry out a range of scientific measures including thermometers and barometers. They left them at Churchill where the HBC employees continued to maintain some of the earliest instrumental records in North America.
In an interesting irony, Halley’s life spanned the coldest portion of the Little Ice Age with the nadir in 1680. To my knowledge, he did not write about this, but he did write about astronomical events related to it. For example, he was invited by the Royal Society to visit Scotland to observe and submit a report on the newly seen
Aurora Borealis. His submission was published in their
Philosophical Transactions, in 1714 under the magnificent title,
An account of the late surprizing appearance of the lights seen in the air, on the sixth of March last; with an attempt to explain the principal phænomena thereof; as it was laid before the Royal Society by Edmund Halley, J. V. D. Savilian Professor of Geom. Oxon, and Reg. Soc. Secr.
His abstract is very different from those we see in today’s academic or scientific journals, but this is a time when the title scientist did not exist. He wrote,
The Royal Society, having received accounts from very many parts of Great Britain, of the unusual lights which have of late appeared in the heavens ; were pleased to signify their desires to me, that I should draw up a general resation (sic)
of the fact, and explain more at large some conceptions of mine I had proposed to them about it, as seeming to some of them to render a tollerable solution of the very strange and surprizing phænomena thereof.
He knew about them from earlier reports, and he also knew about their relationship with sunspots. He knew about sunspots from Galileo’s work but had not seen them either because his life also spanned a period with very few sunspots. The
diagram shows the most accepted reproduction of sunspot numbers with only a few over Halley’s lifetime.
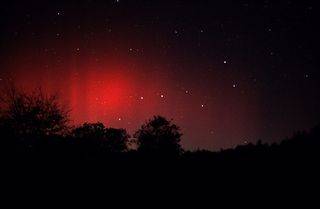
Aurora borealis or northern lights are among the most spectacular atmospheric displays. Called
Aurora australis in the southern hemisphere they are visible evidence of the relationship between the sun and climate. In early days they called them Petty Dancers from the French
petite danseurs. In England, they were also called Lord Derwentwater’s lights because they were unusually bright on February 24th, 1716, the day he was beheaded. A bad omen for him, but they were also an indicator of the bad weather and harvest failures of the period.
Ionized particles streaming out from the sun are called the solar wind. The term is misleading because they are solid electrically charged particles. Activity on the Sun is seen as sunspots and solar flares and coincides with variations in the strength of the solar wind. When these charged particles reach the upper levels of the earth’s atmosphere, they collide with the molecules of nitrogen and oxygen. This collision creates electrical charges that make the gas molecules glow. The gas determines the colours of the Aurora. Nitrogen produces red and oxygen the shades from almost white through yellow to green.
Many northern North American First Nations people used them to predict the weather. The Cree in Manitoba expected three to four weeks of cold weather after a prolonged period of display. This is very accurate as it relates to the average eastward movement of the Rossby Waves. Henry Youle Hind, leader of a scientific expedition across Canada, wrote on the 19th of September 1858 about Ojibway predictions:
We arrived at the mouth of the river at 10 A.M. and hastened to avail ourselves of a south-east wind just to rise. Last night the aurora was very beautiful, and extended far beyond the zenith, leading the voyageurs to predict a windy day. The notion prevails with them that when the aurora is low, the following day will be calm; when high, stormy.
Samuel Hearne spent two and one-half years with the Chipewyan, (then called the Northern Indians.) His report on their explanation of the aurora is fascinating.
The Northern Indians call the Aurora Borealis, Ed-thin; and when that meteor is very bright, they say that deer is plentiful in that part of the atmosphere;,,, Their ideas in this respect are founded on a principle one would not imagine. Experience has shewn tham, (sic)
that when a hairy deer-skin is briskly stroked with the hand in a dark night, it will emit many sparks of electrical fire, as the back of a cat will.
This describes the phenomenon of static electricity and is remarkably close to the current explanation of the Aurora.
The composite image from NASA shows the Aurora from space as a circle around the Magnetic Pole.
Although at a higher altitude it is coincident with the dome of cold air that sits over the Pole.
The auroral ring expands and contracts as the cold air dome expands and contracts. This means when the Aurora is seen closer to the Equator there is cold pervading the Northern hemisphere. This is the situation of the last several years. It is accentuated by the change of pattern in the Rossby Waves along the Polar Front from low to high amplitude Waves. It results in more extreme outbreaks of cold air pushing further toward the Equator and warm air penetrating further to the Pole as the cold air moves out of the way.
Similar conditions occurred in the 17th century. Diarist Samuel Pepys (1633-1703) wrote about the conditions on many occasions. They were especially concerned about the mild winters, so the government recommended action. On January 15, 1662, Pepys wrote,
“
And after we had eaten, he (Mr. Bechenshaw, a friend) asked me whether we have not committed a fault in eating today, telling me that it is a fastday, ordered by the parliament to pray for more seasonable weather it hitherto had been some summer weather, that is, both as to warm and every other thing, just as if it were the middle of May or June, which doth threaten a plague (as all men think) to follow, for so it was almost all last winter, and the whole year after hath been a very sickly time, to this day.”
The prayers paid off. On January 26th Pepys wrote,
“It having been a very fine clear frosty day. God send us more of them, for the warm weather all this winter makes us fear a sick summer.”
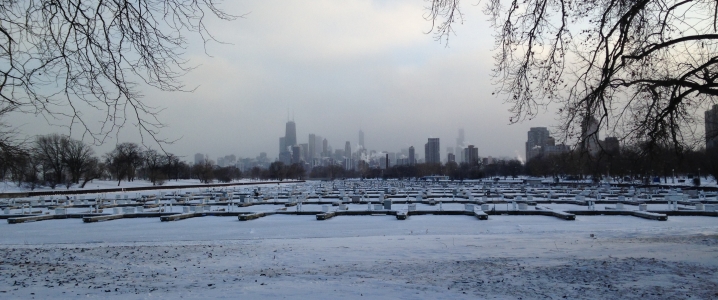
Pepys’ concern mirrors an old English saying that,
“A green winter makes a fat churchyard.”
His concern was well-founded because the plague returned, reaching London in 1665.
When you read the entire series of weather entries in Pepys’ diaries that cover the period 1660 – 1690, the pattern of remarkably variable weather is symptomatic of a Meridional Rossby Wave flow.
It was a similar pattern described in Barbara Tuchman’s 1978 book “
A Distant Mirror; The Calamitous Fourteenth Century.” It was another example, like Halley of an important person, the nobleman Enguerrand VII de Courcy, whose life spanned an important climate period the 14th century, with weather comparable to the 17th century and the early 21st century. It lasted longer and was more profound because it was a transitional century as the world cooled from the Medieval Warm Period (MWP) to the Little Ice Age (LIA).
The current debate attracting more and more people is that we are cooling with the only question left as to the extent and intensity. Will it be weather similar to the cooler period coincident with the Dalton Minimum from 1790 – 1830? Alternatively, will it be colder with similar conditions to those by the early fur traders in Hudson Bay or those that spanned the life of Sir Edmund Halley? The appearance of Aurora in northern England suggests the latter, although I can predict who will protest this suggestion.


")