Also many options on this Amazon page for heating water pipes and pumps...
You are using an out of date browser. It may not display this or other websites correctly.
You should upgrade or use an alternative browser.
You should upgrade or use an alternative browser.
The Ice Age Cometh! Forget Global Warming!
- Thread starter Gaby
- Start date
Pearce
Jedi Master
Thanks for the suggestions and feedback everyone. Got the water flowing yesterday, as far as we can tell no burst pipes. Talked with my dad yesterday and decided next time (he said 'if' and I kept saying 'when') we would shut off the pump like we did this time, but open all the faucets so the water completely drains out of the pipes instead of the drip cause that didn't really help in this case. Not before of course filling the bathtub, ice chests, sinks, and any container possible with water to have extra on hand. Such a good idea but I never would have thought to do it mostly cause I didn't think it would be that bad, so I really didn't plan ahead for much. Gotta love those famous last words and definitely will be on top of it more for the next time. Also going to put in an effort to finish the fireplace situation, as I've just put it off for too long.
I was thinking about it last night and with all of the extreme weather and things we are seeing with what looks like the approach of an Ice Age, we may see in the future in places like Texas or where future hurricanes and natural disasters hit that the areas just are unable to recover and build back what was destroyed.So, with our ability to forecast general weather conditions in advance - as in our understanding of el nino and la nina weather patterns, politicians can 'bungle' their policy decisions in advance of these knowns, and calculate how to best take advantage of upcoming catastrophes.
To maximise empowerment to themselves, and business interests. And hide it behind politics.
We all see the complaints about government when disasters happen, and it is common for it to become politicized. It seems as though the politics provide cover for the destruction and dysfunction that is prepared for in a eventual meteorological event, and with el nina and la nina events giving them a timeline to work with.
This would be due to the above quote and total corruption and incompetence relating to government, supply and supply chain issues relating to available materials that started with the Covid business, and connected to this a seriously degraded financial and economic system due to the corruption and a possible crashing of the systems, such as this being at first planned by TPTB for agendas and greed and then it gets out of hand due to events and unplanned for chaos.
All good ideas. I think draining pipes is a great idea. Damage can be catastrophic, and no telling when you'll get help with repairs. I'm told that homeowner's insurance has a very high deductible for damage because of 'named storms' (aren't they all named lately?) Don't know if true, so read the fine print. ANYTHING you can do to prevent damage is worthwhile.Thanks for the suggestions and feedback everyone. Got the water flowing yesterday, as far as we can tell no burst pipes. Talked with my dad yesterday and decided next time (he said 'if' and I kept saying 'when') we would shut off the pump like we did this time, but open all the faucets so the water completely drains out of the pipes instead of the drip cause that didn't really help in this case. Not before of course filling the bathtub, ice chests, sinks, and any container possible with water to have extra on hand. Such a good idea but I never would have thought to do it mostly cause I didn't think it would be that bad, so I really didn't plan ahead for much. Gotta love those famous last words and definitely will be on top of it more for the next time. Also going to put in an effort to finish the fireplace situation, as I've just put it off for too long.
If you frequent yard sales, you can find old heating pads and electric blankets without the safety shut off system. Multitude of uses for these, like under pet beds, making yogurt or other fermentations. There are special bathtub bags sold for containing a large amount of water ahead of any worrisome storm.
It is easy to set up an inexpensive hygiene system with bags, 5 gallon buckets and snap on toilet seats (made for just this purpose). Baby wipes are great for bathing and hand washing. Dry shampoo is very effective.
Berkey water filters are good enough for drinking even pond water. Pricey, but worth it.
Sodajaxon
Jedi
What do chemtrails have to do with snow not melting considering that the coming of an ice age has been predicted for years now? What do you think happens in an ice age?
Ok, ya got me, har har, so then how does snow not melt when a flame is applied? probably does not have anything to do with chemtrails, or does it? i did the flame test here in west michigan and had carbon build up on the ice but the ice did melt. can anyone explain the phenomena observed in the above photos and videos?
link to videos mypatriotsnetwork.com/patriot/texas-snow-that-doesnt-melt-weather-modification-technology/
Metrist
The Living Force
I have a woodstove I use once in a while, and some years ago we had a -20F cold spell that stuck around for several weeks. Well, the room where my stove is has a concrete floor, and the ceiling is 9ft.
So, the concrete gets cold, and with the high ceiling height, the temp difference between the ceiling and floor is great.
So I put a duct that went from ceiling to floor that drew the hot air at the ceiling to the floor. This heated the concrete and concrete stores the heat, and it rises from the floor making the comfort zone consistent. And it stored the heat so that the next day, I would have residual heating until I got the fire going again.
Chad
The Living Force
Ok, ya got me, har har, so then how does snow not melt when a flame is applied? probably does not have anything to do with chemtrails, or does it? i did the flame test here in west michigan and had carbon build up on the ice but the ice did melt. can anyone explain the phenomena observed in the above photos and videos?
link to videos mypatriotsnetwork.com/patriot/texas-snow-that-doesnt-melt-weather-modification-technology/
Do you realise how rude your tone is, Sodajaxon?
This distraction has been going around for a while, and all over the world (i saw a similar clip on social media last winter by someone in Europe). A quick online search brings up the following explanation:
{snip}

Fact check: Sublimation, not government conspiracy, explains snowmelt videos
A Facebook claim contains three TikTok videos that allegedly show that snow is synthetic. We rated it false.www.yahoo.com
Slate magazine also addressed the conspiracy theories in a 2014 article. Phil Plait, writer for Slate's Bad Astronomy blog, recorded a replication of the snowball experiment and posted it to Bad Astronmy's YouTube page. Sure enough, the snow did not melt right away.
"To summarize, two things happen: One is that as the snow melts, the remaining snow absorbs the water. That’s why it doesn’t appear to drip; the snowball becomes a slushball," Plait wrote.
The process is called "sublimation," according to Mike Stone, a meteorologist for WTVR News in Richmond, Virginia. When heavy snowfall fell in Virginia's capital back in 2014, the station performed its own test and posted it to YouTube.
"When you heat something like this, it goes from a solid to a gas. It's called sublimation," Stone told then-colleague Alix Bryan when her snowball failed to melt. "This is actually disappearing by going into vapor."
Dr. Tandy Grubbs, professor and chair of the department of chemistry and biochemistry at Stetson University, told USA TODAY that given time, the snowball would have melted.
"Firstly, I would note that the demonstrator did not hold the lighter under the snowball long enough to melt enough of the snow to potentially see water formation (and dripping)," he wrote in an email.
Grubbs also explained why the snowball turned black where the flame touched it.
"The formation of black on the snow when the lighter is held under it is due to the incomplete combustion and formation of soot when the lighter fuel is burning," he wrote. "Soot would ordinarily not be visible when a lighter is burning in open air, but the snowball in this case is acting like a filter, catching and accumulating the black soot particles, which show up quite visibly on the white snow after a few seconds of exposure."
Sublimation demos are some of the outrageous claims about synthetic snow posted to the internet in recent years. Some blamed "chemtrails" sprayed by passing airplanes for the snow that gridlocked Atlanta seven years ago, while others pointed to nanobots, according to a 2014 Yahoo! News article. The latter does not yet exist, per a Dec. 30 GlobeNewswire press release about a major nanorobotics report.
"Even if the government was perpetrating such a diabolical scheme (they aren't), and was able to cover it up and keep people quiet (no need because it isn't happening), it just wouldn't work. It would be the most inefficient and ineffective way of dosing the population with anything," Scott Sutherland of Yahoo! News wrote.
Our rating: False
We rate this claim FALSE, based on our research. A claim containing TikTok videos that purport to illustrate snow that won't melt is based on unproven and previously debunked conspiracy theories. A snowball will melt under a flame, turning from a solid to a gas due to a process called sublimation. Other claims tying snowfall to chemtrails or nanobot technology are unfounded, according to experts.
You will also want to familiarize yourself with these articles:
Last edited:
Just wanted to share some thoughts since I had many friends and colleagues effected by the recent extreme cold weather around the US. They were mostly bewildered or just ¯\_(ツ)_/¯ by it all. I wanted to share articles on how we’ve likely entered an ice age but I know that would’ve been too much of a curveball for them.
Something that stood out to me from their descriptions and photos was how even after a lot of snow had fallen there would be mention of how it was then raining. This then caused everything to turn to ice as the temp dropped again.
This snow, rain, ice cycle got me thinking that what if this could pick up in higher altitudes where if enough precipitation gathered then large chunks of ice could form and then eventually fall. I do recall reading accounts about huge chunks of snow and ice falling at the onset of an ice age (Cs may have mentioned as well).
Another thought (kinda out there) but what if the ice is already in the atmosphere just waiting for a catalyst to bind into massive hunks of ice? Perhaps then some harmonizing/vibratory frequency (sky trumpets?) binds and then holds the ice above until it’s cancelled out and then flop - tons of ice falls. Imagine if an atmospheric river froze in the sky and then fell all at once - that wouldn’t bode well for anyone underneath it.
The possibility of hoarfrost forming at a grand scale comes to mind. Here’s a quick video from a Boise broadcast that explains hoarfrost during winter inversions -
https://www.ktvb.com/video/weather/...lley/277-112412fe-5555-42ed-b9ff-d2b9a71e9a30
Hope this isn’t noise, but does seem only a “click” away until all this ice slides into place Stay warm and vigilant wherever you are.
Something that stood out to me from their descriptions and photos was how even after a lot of snow had fallen there would be mention of how it was then raining. This then caused everything to turn to ice as the temp dropped again.
This snow, rain, ice cycle got me thinking that what if this could pick up in higher altitudes where if enough precipitation gathered then large chunks of ice could form and then eventually fall. I do recall reading accounts about huge chunks of snow and ice falling at the onset of an ice age (Cs may have mentioned as well).
Another thought (kinda out there) but what if the ice is already in the atmosphere just waiting for a catalyst to bind into massive hunks of ice? Perhaps then some harmonizing/vibratory frequency (sky trumpets?) binds and then holds the ice above until it’s cancelled out and then flop - tons of ice falls. Imagine if an atmospheric river froze in the sky and then fell all at once - that wouldn’t bode well for anyone underneath it.
The possibility of hoarfrost forming at a grand scale comes to mind. Here’s a quick video from a Boise broadcast that explains hoarfrost during winter inversions -
https://www.ktvb.com/video/weather/...lley/277-112412fe-5555-42ed-b9ff-d2b9a71e9a30
Hope this isn’t noise, but does seem only a “click” away until all this ice slides into place
Stay warm and vigilant wherever you are.Chad
The Living Force
Hey Maxwell, Depending on how receptive they are, sometimes its best to say nothing, sometimes it's better to go at the topic in a more roundabout way. Should anyone express an interest, then you can be more explicit in telling them that you came across other theories about what's contributing to the strange weather.Just wanted to share some thoughts since I had many friends and colleagues effected by the recent extreme cold weather around the US. They were mostly bewildered or just ¯\_(ツ)_/¯ by it all. I wanted to share articles on how we’ve likely entered an ice age but I know that would’ve been too much of a curveball for them.
You might find some ideas about how to handle these kinds of conversations in this thread. It's not about extreme weather but the suggestions are probably applicable.
Do you have the passage from the C's? I don't recall anything like that, but maybe i missed it.Something that stood out to me from their descriptions and photos was how even after a lot of snow had fallen there would be mention of how it was then raining. This then caused everything to turn to ice as the temp dropped again.
This snow, rain, ice cycle got me thinking that what if this could pick up in higher altitudes where if enough precipitation gathered then large chunks of ice could form and then eventually fall. I do recall reading accounts about huge chunks of snow and ice falling at the onset of an ice age (Cs may have mentioned as well).
Another thought (kinda out there) but what if the ice is already in the atmosphere just waiting for a catalyst to bind into massive hunks of ice? Perhaps then some harmonizing/vibratory frequency (sky trumpets?) binds and then holds the ice above until it’s cancelled out and then flop - tons of ice falls. Imagine if an atmospheric river froze in the sky and then fell all at once - that wouldn’t bode well for anyone underneath it.
My understanding is that when these atmospheric rivers fall, they cause unprecedented rainfall and flooding, and we've seen countless headlines stating things like 'a months worth of rain fell in 12 hours'. At the same time, in other areas there's unprecedented drought. I'm guessing that these extremes are related since similar patterns have been found to have happened in the past (see this link that describes drought in the Middle Ages).
Indeed, when it's cold enough, these rivers can then fall as snow, which cause record snow fall; roofs collapse due to the weight, people can't open their doors, roads remain blocked, and so on. Also, at some point that snow will melt and in turn can cause flooding.
As for 'ice falling from the sky', what comes to mind is the record breaking hail, both in the size of the individual hail as well as the amount that falls (i.e. 'rivers of hail'). It seems one of the most destructive aspects to this is crop damage, that can lead to crop failure, although some chunks are big enough that, were it to hit a person, it'd likely injure them pretty badly - and there have been reports of this happening.
If you're interested in the mechanics of how this happens, i think you'll find some answers in Pierre and Laura's book, Earth Changes and the Human-Cosmic Connection. You can listen to the podcast about the book here, and you might also like this one.
The possibility of hoarfrost forming at a grand scale comes to mind. Here’s a quick video from a Boise broadcast that explains hoarfrost during winter inversions -
https://www.ktvb.com/video/weather/...lley/277-112412fe-5555-42ed-b9ff-d2b9a71e9a30
Hope this isn’t noise, but does seem only a “click” away until all this ice slides into place
Unfortunately that video doesn't appear to be available in Europe.
Thanks for taking the time to respond, Itellsya. I appreciate the feedback. Here are some follow up comments...
Yes, I have found this to be the case, but thanks for the reminder. With close friends and family I may hint at something here or there if it's relevant. For people I don't know well or co-workers it's usually mums the word. For many waking up is worse than death so best to let sleeping dogs lay even if its certain doom. And thanks for the link to that thread, I'm not caught up on it, but will have a read.
Yeah, I searched through as well and didn't find any specific regarding 'massive hunks ice'. Closest I could find was this from 2014-07-14:
So, not exactly massive hunks of ice but will fall referenced. I think I may have been more or less recalling some the day after tomorrow discussions. I'll continue looking through articles for any reference. Below is one I found on SOTT with interesting possibilities.
Well... we do get atmospheric rivers here in Northern California every season. I was mostly using them as an analogy between my hypothesis (which could very well be half-baked ) and how large amounts of ice could form and fall from the sky. I'll try to clarify a little more below...
Yes, I've read about this as well. I did find this article that provides some plausibility to large amounts of falling ice forming: Mystery of the monster hailstones -- Sott.net
Also, info on winter inversions from Wikipedia:
So I guess to clarify my hunch - could certain inversion conditions with the formation of hoarfrost and wild fluctuations in temperatures be a catalyst for large amounts of ice to form rapidly in the sky? Maybe?
Here's a link to the video on YT about hoarfrost -
I do have the book in my library. I bought and read it right away, although it's been sometime since then. The above is just an idea and an attempt at putting what I know and understand to work, but I admit there's still much to process and understand. In any event, learning is fun!


Hey Maxwell, Depending on how receptive they are, sometimes its best to say nothing, sometimes it's better to go at the topic in a more roundabout way. Should anyone express an interest, then you can be more explicit in telling them that you came across other theories about what's contributing to the strange weather.
You might find some ideas about how to handle these kinds of conversations in this thread. It's not about extreme weather but the suggestions are probably applicable.
Yes, I have found this to be the case, but thanks for the reminder. With close friends and family I may hint at something here or there if it's relevant. For people I don't know well or co-workers it's usually mums the word. For many waking up is worse than death so best to let sleeping dogs lay even if its certain doom. And thanks for the link to that thread, I'm not caught up on it, but will have a read.
Do you have the passage from the C's? I don't recall anything like that, but maybe i missed it.
Yeah, I searched through as well and didn't find any specific regarding 'massive hunks ice'. Closest I could find was this from 2014-07-14:
(Turgonl) About the weather here in Canada... It's been fluctuating between hot and cold this summer, and in the winter time. And we were just wondering, is the way the ice age is going to occur, will the summers just start to get cooler and cooler with the precipitation as time goes on over the next few years?
A: No, glacial rebound will fall within months when the tipping point is reached.
So, not exactly massive hunks of ice but will fall referenced. I think I may have been more or less recalling some the day after tomorrow discussions. I'll continue looking through articles for any reference. Below is one I found on SOTT with interesting possibilities.
My understanding is that when these atmospheric rivers fall, they cause unprecedented rainfall and flooding, and we've seen countless headlines stating things like 'a months worth of rain fell in 12 hours'. At the same time, in other areas there's unprecedented drought. I'm guessing that these extremes are related since similar patterns have been found to have happened in the past (see this link that describes drought in the Middle Ages).
Well... we do get atmospheric rivers here in Northern California every season. I was mostly using them as an analogy between my hypothesis (which could very well be half-baked
) and how large amounts of ice could form and fall from the sky. I'll try to clarify a little more below...As for 'ice falling from the sky', what comes to mind is the record breaking hail, both in the size of the individual hail as well as the amount that falls (i.e. 'rivers of hail'). It seems one of the most destructive aspects to this is crop damage, that can lead to crop failure, although some chunks are big enough that, were it to hit a person, it'd likely injure them pretty badly - and there have been reports of this happening.
Yes, I've read about this as well. I did find this article that provides some plausibility to large amounts of falling ice forming: Mystery of the monster hailstones -- Sott.net
The ice that totalled Javage's Mustang, however, was white, pure and huge. "I've never seen that big a piece of ice fall off an airplane," Kaiser said as he began his investigation. But Kaiser has discovered that falls of large masses of white ice, though rare, are not as uncommon as he first thought. In the space of a week in April 2006, there were two such falls in California...
So how could gigantic hailstones form on a clear day? Conditions over south-east Spain in early January 2000 were certainly anomalous. Three days before the first megacryometeors hit, ozone levels in the lower stratosphere, between 10 and 50 kilometres above ground, were substantially below normal, allowing more radiation than usual to pass through to the troposphere below. With less radiation being absorbed in the lower stratosphere, it became cooler. Furthermore, satellite data showed that the boundary between the troposphere and stratosphere, known as the tropopause, dropped by 2.5 kilometres over Spain in the days before the strikes.
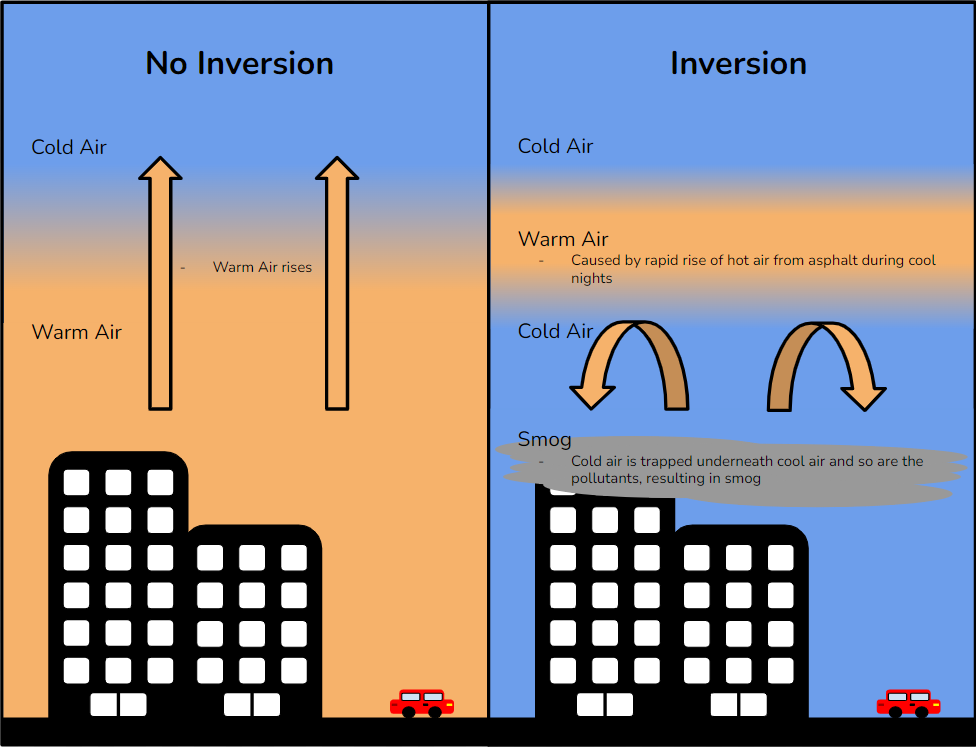
Also, info on winter inversions from Wikipedia:
During an inversion, warmer air is held above cooler air; the normal temperature profile with altitude is inverted. [2]
An inversion traps air pollution, such as smog, close to the ground. An inversion can also suppress convection by acting as a "cap". If this cap is broken for any of several reasons, convection of any moisture present can then erupt into violent thunderstorms. Temperature inversion can notoriously result in freezing rain in cold climates.
So I guess to clarify my hunch - could certain inversion conditions with the formation of hoarfrost and wild fluctuations in temperatures be a catalyst for large amounts of ice to form rapidly in the sky? Maybe?
Here's a link to the video on YT about hoarfrost -
If you're interested in the mechanics of how this happens, i think you'll find some answers in Pierre and Laura's book, Earth Changes and the Human-Cosmic Connection. You can listen to the podcast about the book here, and you might also like this one.
I do have the book in my library. I bought and read it right away, although it's been sometime since then. The above is just an idea and an attempt at putting what I know and understand to work, but I admit there's still much to process and understand. In any event, learning is fun!
Chad
The Living Force
Thanks for taking the time to respond, Itellsya. I appreciate the feedback. Here are some follow up comments...
{snip}
Yeah, I searched through as well and didn't find any specific regarding 'massive hunks ice'. Closest I could find was this from 2014-07-14:
So, not exactly massive hunks of ice but will fall referenced. I think I may have been more or less recalling some the day after tomorrow discussions. I'll continue looking through articles for any reference. Below is one I found on SOTT with interesting possibilities.
Well... we do get atmospheric rivers here in Northern California every season. I was mostly using them as an analogy between my hypothesis (which could very well be half-baked
Yes, I've read about this as well. I did find this article that provides some plausibility to large amounts of falling ice forming: Mystery of the monster hailstones -- Sott.net
Also, info on winter inversions from Wikipedia:
So I guess to clarify my hunch - could certain inversion conditions with the formation of hoarfrost and wild fluctuations in temperatures be a catalyst for large amounts of ice to form rapidly in the sky? Maybe?
{snip}
Well, it's an interesting idea that does appear to have some validity. I'm reminded of the news report (posted below) from February 2018 about a block of ice that fell from the sky nearly hitting a street cleaner, and, luckily, the incident was caught on video. Even the aviation authority speculated it could have been due to meteorological phenomenon.
At the end of the SOTT article there are links to other suspected events too.
Block of ice falls from sky landing metres from London street cleaner (VIDEO)
Chris Baynes
The Independent
Mon, 12 Feb 2018 20:37 UTC
© Bloomfield Executive Cars
The ice landed metres from a street cleaner.
A CCTV camera captured the moment a block of ice plummeted from the sky, narrowly missing a street cleaner.
Council worker Serhiy Myeshkov said he felt lucky to be alive after the sheet of ice smashed on the road metres away from him.
It is thought to have fallen from a plane flying overheard.
© Bloomfield Executive Cars
The ice smashed into pieces in North Road.
Mr Myeshkov was working in Kew, west London, under the busy Heathrow flight path when the ice crashed down nearby.
He told the Richmond and Twickenham Times: "I was sweeping on the other side of the road, then heard a loud boom.
"A piece of ice, maybe 10kg big, fell from either a plane or from the sky. It all happened very quickly.
"I wasn't scared, but it could kill you. I feel lucky."
The falling ice was captured on a taxi firm's security camera at 9am on Wednesday.
Employee Amir Khan, 39, told the Evening Standard: "It was like the start of a disaster movie, like The Day After Tomorrow.
"It made such a loud noise like a meteorite crashing down. The street cleaner was so confused and scared. Everyone came running out to look at the sky. It was crazy."
A spokesman for the CAA said: "Although ice does very occasionally fall from aircraft, it can also be the result of meteorological phenomena.
"We receive around 30 reported ice falls every year, although we are not certain how many of these incidents are the result of ice falling from an aircraft."And from Sky News:
It is understood they can be caused by leaks from planes or when ice forms on planes at higher altitudes and breaks off in warmer air.
A Civil Aviation Authority spokesman said: "Ice falls can be as a result of meteorological phenomena, however ice falls from aircraft are considered to be rare in UK airspace.
© @huldatheprophet
Onlookers took photos of the smashed ice block
Comment: The comments from the aviation authority hint at it being a meteorological phenomenon, and when we take into account the very dramatic changes occurring in our environment, it's possible these 'ice from the sky' reports may hint at the cooling of our planet:
- Chunk of ice, megacryometeor, falls from sky mysteriously crashing through Chicago man's ceiling
- Chunk of ice fell from the sky and shocked local residents
- Block of ice weighing 30kg falls from the sky in India
- 50-pound Ice Chunks Fall From Sky
- Mysterious chunks of ice fall from sky near Los Angeles in clear weatherAnd so, whilst some of these events can be attributed to airplanes dumping waste tanks, they're often easy to distinguise because they use a blue tinted disinfectant. They're also apparently not in the habit of doing it over populated areas.


About how megacryometeors form, on Wiki we can read:
Megacryometeor
A megacryometeor is a very large chunk of ice which, despite sharing many textural, hydro-chemical, and isotopic features detected in large hailstones, is formed under unusual atmospheric conditions which clearly differ from those of the cumulonimbus cloud scenario (i.e. clear-sky conditions). They are sometimes called huge hailstones, but do not need to form under thunderstorm conditions. Jesús Martínez-Frías, a planetary geologist and astrobiologist at Institute of Geosciences (Spanish: Instituto de Geociencias, IGEO) in the Spanish National Research Council (Spanish: Consejo Superior de Investigaciones Científicas, CSIC)[1] in Madrid, pioneered research into megacryometeors in January 2000 after ice chunks weighing up to 6.6 pounds (3.0 kg) rained on Spain out of cloudless skies for ten days.
Mass and size
More than 50 megacryometeors have been recorded since the year 2000. They vary in mass between 0.5 kilograms (1.1 lb) to several tens of kilograms. One in Brazil weighed in at more than 50 kilograms (110 lb).[2] Chunks about 2 m (6 ft 7 in) in size fell in Scotland on 13 August 1849.[3]
Formation
The process that creates megacryometeors is not completely understood, mainly with respect to the atmospheric dynamics necessary to produce them. They may have a similar mechanism of formation to that leading to production of hailstones.[4] Scientific studies show that their composition matches normal tropospheric rainwater for the areas in which they fall. In addition, megacryometeors display textural variations of the ice and hydro-chemical and isotopic heterogeneity, which evidence a complex formation process in the atmosphere.[5][6][7] It is known that they do not form from airplane toilet leakage because the large chunks of ice that occasionally do fall from airliners are distinctly blue due to the disinfectant used (hence their common name of "blue ice").
Some have speculated that these ice chunks must have fallen from aircraft fuselages[4] after plain water ice accumulating on those aircraft through normal atmospheric conditions has simply broken loose. However, similar events occurred prior to the invention of aircraft.[8][9] Studies indicate that fluctuations in tropopause, associated with hydration of the lower stratosphere and stratospheric cooling, can be related to their formation.[5] A detailed micro-Raman spectroscopic study made it possible to place the formation of the megacryometeors within a particular range of temperatures: −10 to −20 °C (14 to −4 °F).[10] They are sometimes confused with meteors because they can leave small impact craters.
What's interesting is that these events that may be megacryometeors or similar seem to often occur during clear skies.
It's also interesting you mention atmospheric inversions because, whilst i haven't come across many stories of megacryometeors or similar - although one article claimed there's been at least 100 events in the past 50+ years - there is quite a bit of evidence of various other kinds of atmospheric phenomenon that's attributed to these inversions or the overall cooling of the atmosphere. One would suspect that it's not 'just' temperature, as such, but that cometary dust and electrical charge has something to do with all these phenomena, too.
Wiki has some info about inversion and associated phenomena:
Inversion (meteorology) - Wikipedia
Wave propagation
Light
As the temperature of air increases, the index of refraction of air decreases, a side effect of hotter air being less dense. Normally this results in distant objects being shortened vertically, an effect that is easy to see at sunset where the sun is visible as an oval. In an inversion, the normal pattern is reversed, and distant objects are instead stretched out or appear to be above the horizon, leading to the phenomenon known as a Fata Morgana or mirage.
Inversions can magnify the so-called "green flash"—a phenomenon occurring at sunrise or sunset, usually visible for a few seconds, in which the sun's green light is isolated due to dispersion. The shorter wavelength is refracted most, so it is the first or last light from the upper rim of the solar disc to be seen.[citation needed]
Here's a story from 2018: Rare green flash sunset photographed flickering into even rarer blue in Norway - and there a few more examples of the green flash that can be found at the link.
Another related inversion phenomena seems to be Fata Morgana, Fata Morgana? 'Ghost City' mirage filmed over lake in China.
Fata morgana and inversion - wiki:
The optical phenomenon occurs because rays of light are bent when they pass through air layers of different temperatures in a steep thermal inversion where an atmospheric duct has formed.[1] (A thermal inversion is an atmospheric condition where warmer air exists in a well-defined layer above a layer of significantly cooler air. This temperature inversion is the opposite of what is normally the case; air is usually warmer close to the surface, and cooler higher up.)
Anyway, i'm glad you brought it up because it's certainly something to be aware of, and after looking into a bit more, i will have a better idea of what to keep an eye out for!
") It also seems to me that there's more to be discovered about the phenomena so it'll be interesting to see what other information is out there.
It also seems to me that there's more to be discovered about the phenomena so it'll be interesting to see what other information is out there.
Last edited:
An image of the future? Coming soon to a neighbourhood near you?
Last edited:
This afternoon there was an article in Jyllands-Posten (Danish) written by Keld Louie Pedersen. I only have the beginning and translated it with a machine. Apparently what happened in Texas, has given some analysts food for thought, or is it rather an icicle to chew on:
YANDEX.TRANSLATE:
23.02.2021 AT. 16:26
The cold shock in Texas scares the global energy industry
A winter storm has put the oil state down, and it may take 20 years to pay the bill.

The power companies in Texas, like here in Fort Worth, have been busy restoring the supply lines. Millions of consumers are left with astronomical bills. AFP / Ron Jenkins
Climate change is a reality, and temperatures know only one way: up. Also in the US state of Texas, where sun and Danish summer temperatures are not unusual in February.
Therefore, virtually everything and everyone was unprepared when the worst winter weather in a lifetime hit the State on the Gulf of Mexico.
Central parts of the energy system could not cope with the load, as demand exploded to a record high, and at least 3.5 million. people and businesses were left without electricity, ...
Last edited:
Just wanted to mention that some Russian scientists are slowly changing the narrative and are now openly declare that we are about to enter the new Ice Age. But still with some "impression management" going on.
Two Russia climate scientists shared their views on Russian mainstream sites. Here and here are the links if anyone who knows Russian reads this post. According to Kotlyakov we should expect Ice Age within10-15 years, while Matishov still claims that we have thousands of years.
It's true that we heard Russian scientists saying the same thing before, but these claims were mostly done by scientists that don't have a "renowned" reputation, and the whole tone was usually a "semi-quacky" like. Basically, Russian media and Russian government always presented the accepted narrative of Global Warming. Well, at least officially.
In reality, in recent years Russia built or in the process of building several large and advanced ice-breakers, and in general it looks like Putin and his team do take steps to be prepared for whatever comes.
For example, here's a paper that was written by Matishov and other scientists. The paper was written in 2014. In this paper he describes a situation where Northern Sea Route in the Arctic was mostly free of ice due to warming, but southern areas of Russia and Europe experienced extreme and unprecedented low temperatures. I will quote only part of the paper, but more knowledgeable people can perhaps read it in its entirety and understand it better.

 www.sciencedirect.com
In the conclusion he also mentions there following. So it seems like Putin heard him or others Russian scientists that said the same.
And this is an article that was written by Kotlyakov for the UN, where he discusses a connection between global warming and glaciers, and also a mechanism of surging glaciers.
 www.un.org
Bsically they demonstate the same logic that global warming contributes to and triggers global cooling.
Here are some relevant quotes from both articles in Russian that I mentioned:
Two Russia climate scientists shared their views on Russian mainstream sites. Here and here are the links if anyone who knows Russian reads this post. According to Kotlyakov we should expect Ice Age within10-15 years, while Matishov still claims that we have thousands of years.
It's true that we heard Russian scientists saying the same thing before, but these claims were mostly done by scientists that don't have a "renowned" reputation, and the whole tone was usually a "semi-quacky" like. Basically, Russian media and Russian government always presented the accepted narrative of Global Warming. Well, at least officially.
In reality, in recent years Russia built or in the process of building several large and advanced ice-breakers, and in general it looks like Putin and his team do take steps to be prepared for whatever comes.
For example, here's a paper that was written by Matishov and other scientists. The paper was written in 2014. In this paper he describes a situation where Northern Sea Route in the Arctic was mostly free of ice due to warming, but southern areas of Russia and Europe experienced extreme and unprecedented low temperatures. I will quote only part of the paper, but more knowledgeable people can perhaps read it in its entirety and understand it better.
Pronounced anomalies of air, water, ice conditions in the Barents and Kara Seas, and the Sea of Azov
This paper analyses the anomalous hydrometeorological situation that occurred at the beginning of 2012 in the seas of the Russian Arctic and Russian S…
Strong warming has been recorded in the Arctic Ocean and its shelf seas since the beginning of the 21st century (Matishov et al., 2009, Alekseev et al., 2010, Kattsov and Porfiryev, 2011). The positive water temperature anomaly in Atlantic water masses has remained in the Barents Sea for no less than ten years (Matishov et al., 2009, Matishov et al., 2012a).
The Arctic ice area in summer and autumn has decreased significantly in recent years; as a result, navigation on the Northern Sea Route has taken place without icebreaker support. Parts of the Pechora and Kara Seas were ice-free in the winter of 2011/12, whereas the probability of that condition based on long-term data is close to zero. Meanwhile, at the beginning of 2012 (January and February) the air temperature on Franz Josef Land reached values that were close to the absolute maximum (+ 1 − 2°C). The position of the ice edge in the Barents Sea was close to its climatic minimum with 1% probability. In the Kara Sea significant areas of water remained open until February. No such climatic data had previously been recorded (Atlas of the oceans … 1980).
Some researchers believe that the decrease in the ice extent in the Arctic basin in summer and autumn is caused by a change in the large-scale atmospheric circulation (Overland & Wang 2010), which results in an increase of blocking situations and precipitation in Europe in winter (Liu et al. 2012).
At the same time anomalously cold weather in the second half of winter has become a typical phenomenon in central and southern Europe and the adjacent seas (the Sea of Azov, the north-eastern Black Sea, the northern Caspian Sea) (Matishov et al., 2012a, Moore and Renfrew, 2012, Tourpali and Zanis, 2013). The anomalies in January and February of 2006 and 2012 were especially pronounced. The air temperature in the south of European Russia decreased in January 2006 to − 32 − 33°C; the average monthly values were about − 15°C, that is, 12 − 15°C below the climatic norms. Similar conditions were recorded in January and February 2012. At that period the influence of the Siberian High reached as far as the English Channel and Portugal. It was the first time in 30 years that the northern part of the Black Sea was frozen, the first time in 80 years when the canals of Venice were iced over, and that piers at harbours on Lake Geneva were covered by ice.
On the Sea of Azov and the Caspian Sea, navigation, which typically does not encounter any obstacles all the year round, was seriously complicated by the ice cover. The duration of the ice period was as long as 50–80 days on the Caspian Sea and the Sea of Azov. About 100 vessels were locked in the ice in offshore areas and in ports of the Sea of Azov and the Kerch Strait in February and March 2012 (Matishov et al. 2012a). On the Caspian Sea the drifting ice spread along the west coast to the Apsheron Peninsula.
At the end of the 19th century the climatologist A. I. Voeikov was analysing the connection between wind and pressure and came to basic conclusions about the development of ‘big axis of the European-Asian continent’ (Voeikov 1884). The Siberian High with its extension to south-west Europe is known as the axis of Voeikov. This climatic axis manifests itself as a wind divide, which separates winds with a southerly component (to the north of the axis) from winds with a northerly component (to the south of the axis). As a result the anomalous advection of the Siberian High circulation reaches the Pyrenees and at the same time Atlantic waters flow into the Arctic towards Franz Josef Land during winter (Figure 1).
As a consequence, the atmospheric circulation conditions above the northern hemisphere were studied in detail by Vangengeim (1940), Dzerdzeyevskiy et al. (1946), Girs (1971) and Kononova (2009). Several sets of macrosynoptic process types were developed on a similar methodological basis (zonal and meridional transfers with subtypes). The persistence of the blocking anticyclone leads to a cooling of the surface layer of the atmosphere above the continent, and this easterly transfer impairs the warming effect of southern seas.
In our opinion the intensification of these processes in the atmosphere favours the development of weather anomalies, as well as anomalies of hydrological and ice conditions, which are of different signs depending on the season and geographical location of atmospheric transfers. To estimate such anomalies we used a database of climatic and biological parameters of the Arctic and southern seas, which was created as a result of many years’ cooperation with NOAA and the World Ocean Data Center of the USA (Moiseev et al. 2012). Furthermore, the anomalous situation in January-March 2012, which is elucidated by a unique set of meteorological and oceanological data, will be considered.
In the conclusion he also mentions there following. So it seems like Putin heard him or others Russian scientists that said the same.
Climate anomaly assessments are especially important in the context of the prospective activities of oil and gas companies on the Barents and Kara Sea shelves. No less important are the ice conditions along the Northern Sea Route. The warming of 2000–2012 has already led to the refusal of ice-breaker support from companies participating in Arctic shipping. The reverse trend may bring about unfavourable consequences for all kinds of economic activity in the Russian Arctic.
And this is an article that was written by Kotlyakov for the UN, where he discusses a connection between global warming and glaciers, and also a mechanism of surging glaciers.
Global Warming and Surging Glaciers | United Nations
During global warming, solutions to surging glaciers and their unpredictable behavior are still far from being found and demand organized national and international research.
Bsically they demonstate the same logic that global warming contributes to and triggers global cooling.
Here are some relevant quotes from both articles in Russian that I mentioned:
According to the climatologist, mankind is now passing through an interglacial epoch, during which the temperature has risen again. At the same time, according to Kotlyakov, the increased heat is precisely contributing to the formation of glaciers.
"If it gets warmer now, then the air above the ground becomes more humid in general. And now this moisture, it is carried by air currents and enters including the Antarctic. There are precipitation in the form of snow, the amount of ice even increases, "- explained the academician.
According to NASA observations, a minimum of sunspots on the surface of the Sun was recorded in 2020, which could mean the beginning of a new era of cooling on the planet. But there have been cases of global cooling on Earth before. They are also called "Little Ice Ages".
"Over the past 15 years, the Taganrog Bay has been covered in ice for an average of 54 days a year. For the south, this is unusually much and closer to a cold snap," Matishov added, noting that we should be guided by data for a hundred years.
He stressed that the climate is cyclical. As an example of warming similar to that observed in recent years, the scientist cited the situation in 1878, when the ship "Vega" passed the entire Northern Sea Route in one season.
Matishov again pointed out that the climate is cyclical, but that it is now cooling rather than warming. This is evidenced by the imbalance of climate in the European part of Russia: cold winters, droughts, fires, intense precipitation.
Last edited:
Trending content
-

-
Thread 'Coronavirus Pandemic: Apocalypse Now! Or exaggerated scare story?'
- wanderingthomas
Replies: 30K -
