Careful with charts showing “the future”
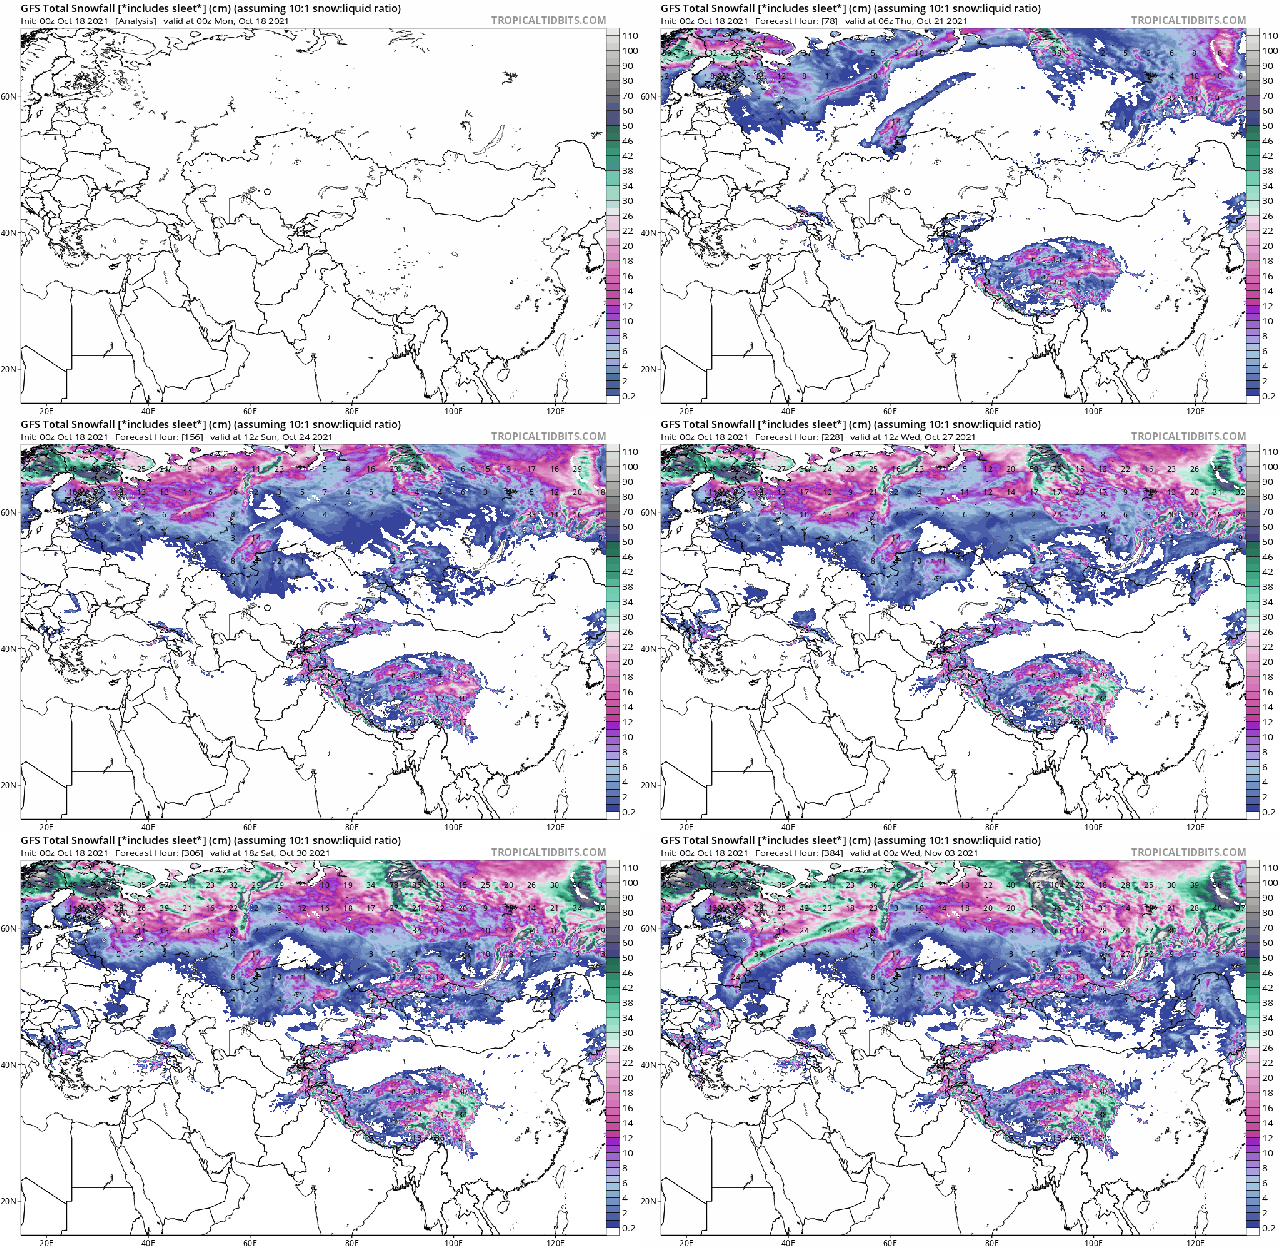
I noticed regarding GFS snowfall totals which are based on the 00z run from 18 Oct 2021 - how deceiving such prognosis charts can be (due to their rapid changes in every new prognosis every 6 hours, going into an opposite scenario at times)
Ultimately; they are just models. An assumtion.
Why do I say this ? I looked in the snow chart prognosis for Sweden where I live being more familiar with the weather patterns (compared to China i mean) - noticing that GFS predicts up to 2-3 inches of snow for our area in the aforementioned GFS 00z run.
Nope. Nix. No snow.
In the latest run this evening 18z, GFS shows now - no snow what so ever for Stockholm in the next 14 days. What a flip-flop !! Swedish SMHI isn’t indicating any snow either for the next 10 days. Albeit, their own predictions can be pretty crappy beyond day 3-4.
A good orientation would be - skip everything beyond day 4.
It is one of the reason I do not write about
expected dramatic weather events (“coming in one week”) in the forum, because it would more often than not, result into noise. GFS is the dramaqueen of predicted future weather up to 14 days - and i have in the past walked into that trap too many times at my own homepage

writing about such (pseudo) events; Up like a sun - falling flat like a pancake.
 Continental areas
There is of course the option that for continental areas like China, Russia (Siberia) and Mongolia (and north America), weather changes and flows may be a bit easier to predict; in how cyclones and anticyclones are expected to move, being more easily aligned with reality later on.
Yet, for Scandinavia the weather patterns are not really easy to predict beyond day 3 due to the countries position, wedged between the warm Atlantic and cold continental Russia (later Autumn, Winter, and early spring) It usually works better with strong, stable winter anticyclones - and a general prognosis can hold for 5+ days (e.g. permanent overcast weather to be expected, 0°C and with some snowflakes. Tralallaaaa).
So what I wish to point out is, that beyond day 4 - the weather chart predictions become pretty crappy in my opinion.
It tells a tale of computer models are creating beautiful colorful charts. Because they can, not because they are particularly accurate for day 5, 9 or 14.
October is the month
Sure is, that October is the month when snow starts to take over the arctic areas in the North, and winter is attempting to go more southwards. Sometimes it works that early but not every year.
Certain Patterns
One pattern I have noticed is that when bizarre cold air travels southeastwards over North America / East Canada repeatedly - it induces powerful cyclones over the Atlantic on their way to Europe, leading to milder than normal temperatures in Scandinavia, with lots of winds, milder airmasses and clouds keeping the atmosphere mixed (milder temperatures in the lower atmosphere, reaulting into frost free nights in south Sweden. Like a highway of constant cyclonic activity swooping over Scandinavia.
Only when a
second cold pole establish itself over northwest Russia, we get thosr really ice cold winters here; then the Atlantic cyclones are being either blocked, or lead in such a way that they pass south of Scandinavia.
Now this was an awful lot about Scandinavia and not Chinese weather

But I can’t speak for China because I am not familiar with their weather patterns and do not wish to utter things without basis.


 writing about such (pseudo) events; Up like a sun - falling flat like a pancake.
 But I can’t speak for China because I am not familiar with their weather patterns and do not wish to utter things without basis.