A sign that things are about to change drastically?

lostinself said:
no-man's-land said:
The recent post from Navigator here:

http://cassiopaea.org/forum/index.php/topic,33168.msg457036.html#msg457036

which shows two graphs of volcanic and seismic activities, and the next one from lostinself here:

http://cassiopaea.org/forum/index.php/topic,33168.msg457573.html#msg457573

which shows another graph also about volcanic activities seemingly contradict each other. In the first link the author Michael Mandeville claims that his Data is also from the Smithsonian Institute catalog. So two sets of data from one source showing two different graphs?

The answer might be that Michael Mandeville displays the "combined days of eruptive episodes" while the Smithsonian database displayed by lostinself only count the numbers of active volcano's and don't show how long the activities lasted. I don't know where Mandeville got this data from but at the Smithsonian database there is no such data, or at least they show only the date when it started, not when the volcano went silent again.

You're probably right on why these graphs don't agree. Wish i had paid more attention to the former plot. I didn't take durations into account at all, and, as you point out, there's no relevant data available at the SI site at the moment. Durations would make a critical difference here, for even a relatively calm event, like a release of ashes, can last continuously for weeks (still representing a volcanic activity). In terms of total volcanic activity on the Planet, i guess Mandeville's plots are more accurate.

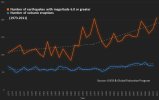
I compiled the data from USGS (number of Earthquake with 6.0 or greater - orange curve) and the data from the Global Volcanism Program (number of volcanic eruptions - blue curve) between 1973 and 2011

earthquakes_and_eruptions_crop.jpg


From 1973 to 1996, earthquake and eruption frequencies were almost stable, increasing only slightly year after year. After 1996 an acceleration is noticeable. Volcanic eruptions show an increase from about 59 eruptions a year at the end of the ’90s to roughly 75 eruptions a year in the 2007–2010 period (+30%).
 
Sweet graph Belibaste! Made a version where the color codes figure for easier reading (for possible FB purposes)
 

Attachments

  • earthquakes_and_eruptions_1973-2011.jpg
    earthquakes_and_eruptions_1973-2011.jpg
    53.3 KB · Views: 672
parallel said:
Sweet graph Belibaste! Made a version where the color codes figure for easier reading (for possible FB purposes)

Thank you Belibaste and parallel for this graphic! Another significant and useful one. :thup:
 
MK Scarlett said:
parallel said:
Sweet graph Belibaste! Made a version where the color codes figure for easier reading (for possible FB purposes)

Thank you Belibaste and parallel for this graphic! Another significant and useful one. :thup:

Great data - you might want to plot the eruptions on a scale of 1-100 to get a better visual feel for the increase.
 
Belibaste said:
I compiled the data from USGS (number of Earthquake with 6.0 or greater - orange curve) and the data from the Global Volcanism Program (number of volcanic eruptions - blue curve) between 1973 and 2011

earthquakes_and_eruptions_crop.jpg


From 1973 to 1996, earthquake and eruption frequencies were almost stable, increasing only slightly year after year. After 1996 an acceleration is noticeable. Volcanic eruptions show an increase from about 59 eruptions a year at the end of the ’90s to roughly 75 eruptions a year in the 2007–2010 period (+30%).

That's odd. In the dataset i have, also from the GVP, there's rarely more than 40 volcanic eruptions per year in the above period. I have precisely 1645 non-descredited eruptions registered for years 1973 and later, and that gives ca. 41 eruptions per year. Where did you get the data exactly?
 
I'm not even sure at all if we can say for certain if there is an decrease or increase from the data we have, for the whole earth.
For example, I don't think that there is a good enough system or long enough reliable data, to establish how many under water volcanoes are active or not.
Let alone those above sea level.

I think the only way to have a guess is to find out if those volcanoes that are above the sea have increased in their activity or have become more. That could indicate that under the ocean similar things are going on.

But as we have seen, there doesn't seem to be a reliable data place/search engine that has enough reliable data in it, to come to a definite conclusion.

My feeling says: Yes there is an increase of activity, but to proof that in a nuts and bolt's kind of way is not so easy IMO. There are so many factors and so many unknown parts of the equation.
 
Pashalis said:
I'm not even sure at all if we can say for certain if there is an decrease or increase from the data we have, for the whole earth.
For example, I don't think that there is a good enough system or long enough reliable data, to establish how many under water volcanoes are active or not.
Let alone those above sea level.

I think the only way to have a guess is to find out if those volcanoes that are above the sea have increased in their activity or have become more. That could indicate that under the ocean similar things are going on.

But as we have seen, there doesn't seem to be a reliable data place/search engine that has enough reliable data in it, to come to a definite conclusion.

My feeling says: Yes there is an increase of activity, but to proof that in a nuts and bolt's kind of way is not so easy IMO. There are so many factors and so many unknown parts of the equation.


Wanting to check if there is material that might suggest a correlation between aboveground and underwater volcano activity, a quick google search brought up this (month old, I might add) article:

_http://www.victoria.ac.nz/news/2013/award-for-research-on-underwater-volcanic-activity

30 October 2013

Dr Melissa Rotella, based in the School of Geography, Environment and Earth Sciences, has been awarded the annual Royal Society of New Zealand Hatherton Award for published research, which led to a new type of underwater volcanic eruption being discovered.

<<snip>>

Melissa says that, unlike an on-land volcano, which either explodes or generates lava flows, the volcanic material from underwater had erupted as a buoyant foam. “Instead of rocketing through the water, it lobs off and floats upwards. The outside of it chills, but the inside continues to bubble. This couldn't happen out of the water as it wouldn't have the buoyancy.”

<<snip>>

“Until now, the thinking has been that underwater volcanoes behave in exactly the same way as their above ground equivalents,” he says. “This research demonstrates that the presence of the water allows magma to float away from the vent, regardless of whether on dry land it would explode or flow as lava.”

<<snip>>


Her paper can be downloaded (215MB) at _http://researcharchive.vuw.ac.nz/handle/10063/2729. There might be clues and more that can be inferred from the observations and data.
 
parallel said:
Sweet graph Belibaste! Made a version where the color codes figure for easier reading (for possible FB purposes)

Interesting spike and possible correlation in the mid 90's - Comet Shoemaker–Levy 9?
 
I've managed to extract the GVP eruptions data together with eruption stop dates. It allowed me to draw a plot the way M. Mandeville had done. The result:


On the vertical axis the unit is a single day of activity of a single volcano. For example, a value of "8000" means that for a given year there were 8000 days of activity taking into account all the volcanos. The plot should really be bars but the line looks so much better.

Viewing it this way, there's a significant increase in global volcanic activity - around 100% (!). The final drop is probably related to the shortage of data regarding most recent events.
 
It looks that we are entering in our last minute of dance.
Thanks to everybody for all very interesting data: volcano's, earthquakes, economic breakdown...
 
Laura said:
In addition to environmental events, or even perhaps in response to them, we have to consider the human reaction factor. I think everybody ought to read the following article:
http://www.sott.net/article/269371-What-will-the-coming-civil-unrest-look-like

I think that the 100% certain event will be the economic collapse. Even those of you who have fairly secure jobs may find yourselves in a pickle in that event.
Thanks Laura. Gives much food for the mind. These are scenarios where the challenge is to remain human.
I really want to get away from any area too populated, from the urban centers. It's not easy, but it's best to prepare for the big storm in a rural location. I hope that the efforts I have to do to make this happen, give good results and same for all those here who want to get away from the city-traps.


light worker said:
It looks that we are entering in our last minute of dance.
Thanks to everybody for all very interesting data: volcano's, earthquakes, economic breakdown...
Yep. Or the last minute to learn to dance with life (after years of learning theory). We must show if we can dance or not. Times of wonders and terrors, fascinating times to learn, grow and share.
 
An interesting excerpt from Schiller's book.

A cooling planetary trend can occur due to the cyclical nature
and variation in the sun's activity, whereby the results translate into
decreases in the heat radiation outward from its surface.
Or, for example, increased and continuous volcanic activity could throw
up an effective dust screen that could affect the average amount of sunshine
reaching the planet surface over indeterminate periods of time.

NASA also updated an article they originally published in August.
"It looks like we're no more than three to four months away from a complete field reversal," said solar physicist Todd Hoeksema of Stanford University. "This change will have ripple effects throughout the solar system."

This was in August, so it's imminent.

http://www.nasa.gov/content/goddard/the-suns-magnetic-field-is-about-to-flip/#.UqNqUNLuJq0

http://www.youtube.com/watch?v=B4UtVo7-yJA
 
http://www.thejakartapost.com/news/2014/02/04/19-more-volcanoes-alert.html

19 more volcanoes on alert (Indonesia)

The government has raised the status on another 19 volcanoes in the country to alert level — the second-highest category — in the wake of the Mount Sinabung eruption in North Sumatra that killed 16 people on Saturday.

Besides the 19 new additions, three volcanos have been on high alert status since last year. They include Lokon and Karangetang in North Sulawesi and Rokatenda in East Nusa Tenggara.

The National Disaster Mitigation Agency (BNPB) issued the raised status on Monday for the 19 volcanoes, which are scattered across the archipelago, but has yet to call for the evacuation of populations living nearby.

The 19 volcanoes are Kelud, Ijen, Bromo, Semeru and Raung in East Java; Lewotobi Perempuan in East Nusa Tenggara; Ibu, Gamkonora, Dukono and Gamalama in North Maluku; Soputan in North Sulawesi; Sangeang Api in West Nusa Tenggara; Papandayan in West Java; Dieng in Central Java; Seulewah Agam in Aceh; Talang and Marapi in West Sumatra; Anak Krakatau in Banten; and Kerinci in Jambi.

Indonesia is among the world’s most seismically active countries, situated on the Pacific Ring of Fire, an arc of volcanoes and fault lines encircling the Pacific Basin. The 19 volcanoes are among about 127 active volcanoes in Indonesia.

Mt. Sinabung has been sporadically erupting since September.

Though the alert level for the 19 volcanoes had been raised, Sutopo called on nearby residents not to panic.

http://alltoptens.com/top-ten-active-volcanoes/
 
This news item was also carried on SotT a couple of days ago from a different source:

http://www.sott.net/article/273277-19-more-volcanoes-in-Indonesia-raised-to-alert-level-status
 
Back
Top Bottom