


The Cs Hit List 02: Space and Weather Science Gone Wild

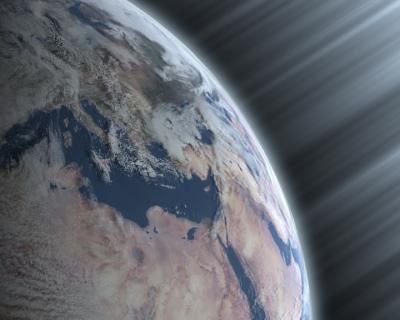
Millions of people were left without power as a snowstorm dropped as much as 32 inches (81 centimeters) on some parts of the northeastern United States in late October 2011. (© MODIS - NASA Terra satellite)
We started this series with a pretty ‘out-there’ topic: prophecy. But the Cassiopaean Experiment, while pretty ‘out-there’ to begin with (at least from the mainstream perspective), also deals with more ‘down-to-earth’ subject matter. Issues relating to more conventionally understood and practiced science (albeit with often unconventional interpretations) make up a large portion of the received data.
It’s been my experience that people tend to forget that scientists are ‘human’ too, or more precisely, scientists can be just as willfully blind, self-serving, conformist, fearful and mendacious as anyone else. Some of them are even unabashed con men who falsify their data, or intellectual prostitutes who will produce the results they are paid to, whether they believe them or not. Just because it’s been peer-reviewed, or written by a person with a string of letters after their name, doesn’t mean it’s true, or even remotely so. And if history tells us anything, it’s that the history of science is a long history of wrong or incomplete ideas. So it’s best to be skeptical whenever scientists speak in terms of absolutes with certainty, whenever they put the lid on testing alternate hypotheses. Chances are, they’re simply deceiving themselves, and you.
Science is a work in progress. The theories that are taken for granted as being true may very well turn out to be completely bogus following the intervention of new discoveries and innovations. Sadly, space and weather science are two areas where innovation not only rarely occurs, it is actively hindered by scientists and politicians with vested interests in keeping old, inadequate theories at the forefront of popular and academic belief systems. Like many of the examples that will follow in subsequent installments of this series, the ones below are just a sample of ideas that at first glance may look just plain wrong. But new discoveries have been proving many outdated preconceptions to be just that.
Hide the Decline, CYA
One of the biggest myths of recent years in weather science is that of ‘global warming’, specifically anthropogenic (manmade) global warming. What this means is that a certain cause (or ‘forcing’) leads to a change in global temperature, causing positive feedback to make it get even hotter. The idea is that as manmade carbon dioxide (a so-called ‘greenhouse gas’) emissions have increased over the last hundred or so years, so has the temperature of the earth’s oceans and atmosphere. The observed correlation is taken as causation, and thanks to the propagandizing efforts of people like Al Gore, the idea has taken hold, despite the fact that the whole façade is built on bad science. Here’s what the Cs had to say in April 2007:
Q: What percentage of what we’re seeing today as global warming is coming from manmade compared to cosmic [causes]?
A: 4 percent.
Q: (J) There ya go. So let’s buy a Hummer. [laughter] (H) And are the people that are selling us the global warming … are they aware that this is all … all fake?
A: Some.
In September 2008, Dr. Zbigniew Jaworowski published an op-ed piece for The New Zealand Centre for Political Research, ‘Sun Warms and Cools the Earth’, in which he quoted Tom Segalstad, author of a review of carbon cycle research. Here’s what Jaworowski wrote:
To fit these data into a global carbon cycle, IPCC assumed a speculative lifetime for man-made CO2 in the atmosphere as 50 to 200 years, ignoring observational evidence from 37 studies (based on natural and nuclear bomb carbon-14, Suess effect, radon-222, solubility data and carbon-13/carbon-12 mass balance) documenting that the real lifetime is about 5 years. With CO2 atmospheric lifetime of about 5 years, the maximum amount of man-made CO2 remaining now in the atmosphere is only 4%, and not 36% (see review in (Segalstad, 1998)).
Here’s Segalstad in his own words:
Water vapor is the most important “greenhouse gas”. Man’s contribution to atmospheric CO2 from the burning of fossil fuels is small, maximum 4% found by carbon isotope mass balance calculations. The “Greenhouse Effect” of this contribution is small and well within natural climatic variability. The amount of fossil fuel carbon is minute compared to the total amount of carbon in the atmosphere, hydrosphere, and lithosphere. The atmospheric CO2 lifetime is about 5 years. The ocean will be able to absorb the larger part of the CO2 that Man can produce through burning of fossil fuels. The IPCC CO2 global warming model is not supported by the scientific data. Based on geochemical knowledge there should be no reason to fear a climatic catastrophe because of Man’s release of the life-governing CO2 gas. The global climate is primarily governed by the enormous heat energy stored in the oceans and the latent heat of melting of the ice caps, not by the small amount of heat that can be absorbed in atmospheric CO2; hence legislation of “CO2 taxes” to be paid by the public cannot influence the sea level and the global climate.

© Artizons.com
What the promoters of manmade global warming ignore is the fact that the correlation between CO2 levels and global warming is just that: a correlation. But CO2 levels have been on the rise for tens of thousands of years, long before humans started releasing ‘greenhouse gases’ as a result of industrialization. In fact, there is an observable ‘lag’ in the data. CO2 levels follow temperature variations by around 800 years, not the opposite. The implication is obvious: global warming is a natural phenomenon of climate variation, probably driven by some other factor, perhaps varying solar activity. And CO2 levels may well be a result of the true cause of global warming, not the cause.
But overestimating the effect of manmade CO2 is not the only problem presented by the data. Has the earth even been warming at all in recent decades? Despite the repeated news headlines of ‘warmest day/year on record’, the answer is no, not really. First of all, many weather-reporting stations that are used to come up with global averages are placed near heat-generating sources, causing them to give results that do not reflect actual temperatures. As cities develop, more heat-generating sources are produced, resulting in higher temperature readings at these sites. But these readings of local variations do not reflect the global climate. As meteorologist Roy Spencer writes in his book The Great Global Warming Blunder (Encounter, 2010), “One recent estimate is that as much as 50 percent of the warming measured over land in the last thirty years could be spurious, due to various indirect effects of economic growth contaminating the thermometer data.” (p. 12-13)
Then there’s the fact that the more precise orbiting satellite data (measured since 1979, and only since around 2000 has NASA’s Aqua satellite been calibrated to account for periodic changes in observation time) has shown no significant warming for the last 18 years. Dr. Spencer writes that there has been no cooling since 2001, after the “particularly warm El Nino year” of 1998 (p. 6). More precisely, they have shown normal fluctuations of heating and cooling. As Spencer writes, “While we can probably say with high confidence that the climate has warmed in the last 50 to 100 years, it is more difficult to say by exactly how much, still more difficult to say whether it is unprecedented or not, and impossible to say what any of this means for future temperatures.” (pp. 13-14)
And, of course, November 2009’s ‘Climategate’ controversy showed just how far some scientists were willing to knowingly distort and falsify data in order to fit their preconceived notions and keep their research grants coming. Internal emails from scientists at the University of East Anglia’s Hadley Climate Research Unit revealed that the ‘scientists’ had knowingly excluded data from reports and graphs that would have shown an actual decline in global temperatures and the observed warming trend in recent decades and other periods of history, in order to give the false impression of continuous warming where there was none. By obscuring the historical evidence of the Medieval Warm Period and the Little Ice Age, climate scientists were able to give the impression that our current climate fluctuations were not business as usual. In fact, despite the imprecision of all methods for indirectly measuring temperature in the past (the only surefire way is direct temperature readings, which are only available for the last 100 years or so), all the data shows exactly that: natural fluctuations, periods of cold, periods of warm, with quick up-swings and down-swings in between.
In other words, they cherry-picked their data, just like they cherry-picked the reporting stations that gave them the data they needed to fit the facts around their beliefs. The graph below shows how the number of stations reporting average temperatures dropped dramatically in 1990. Coincidentally, this is when the graph shows a remarkable increase in temperature. The connection is hard to miss. For whatever reason (we can hazard a guess), the scientists responsible for hyping global warming eliminated many stations reporting lower temperatures in 1990. In all likelihood, if they had continued to use that data, there would be no warming. In fact, there might even be evidence of cooling.

© Ross McKitrik/UoGuelph
What everyone seems to be ignoring is the fact that this is a natural cyclic phenomenon. Earth temperatures do rise. But they don’t just keep going, like a house with a broken thermostat. They’re always followed by cooling. In other words: Ice Age.
Ice Age II
Here’s what the Cs had to say about ice ages on 22 February 1997:
A: [R]emember this: a change in the speed of the [earth’s] rotation may not be reported while it is imperceptible except by instrumentation. Equator is slightly “wider” than the polar zones. But, this discrepancy is decreasing slowly currently. One change to occur in 21st Century is sudden glacial rebound, over Eurasia first, then North America. Ice ages develop much, much, much faster than thought.
Then there’s this from 18 March 2000:
Q: You also made a remark once that ice ages occur much, much faster than people ever thought…
A: Yes. {…} and faster when in response to global “warming.”
Q: When you put “warming” in quotes, you obviously mean warming in more than just an ordinary sense? Is that correct?
A: And/or not really “warm.”
And this, from 9 May 1998:
Q: Why was the sea level several hundred feet lower [in the past]? Because there was ice somewhere or because there was not as much water on the earth at that time?
A: Ice.
Q: Was the ice piled up at the poles? The ice sheet of the ice age?
A: Yes.
Q: So, Atlantis existed during the ice age? [Atlantis being a designation for an alleged technologically advanced society living during Paleolithic times.]
A: Largely, yes. And the world’s climate was scarcely any colder away from the ice sheets than it is today.
Q: Well, how could that be? What caused these glaciers?
A: Global warming.
Q: How does global warming cause glaciers?
A: Increases precipitation dramatically. Then moves the belt of great precipitation much farther north. This causes rapid buildup of ice sheets, followed by increasingly rapid and intense glacial rebound.

© NASA
Recent years have seen exactly that, despite claims of continued ‘global warming’. The ozone hole is cooling the Antarctic’s stratosphere, causing increased precipitation in the subtropics and moving the westerly jet stream closer to the south, pulling storm tracks with it. Glaciers are growing on California’s Mt. Shasta, Italy’s Mount Canin and Mount Montasio, in India, Antarctica, Greenland, the Arctic, New Zealand, Argentina, Alaska, the Himalayas, Bolivia, and elsewhere. In 2006, the BBC reported that “Global warming could be causing some glaciers to grow, a new study claims. Researchers at Newcastle University looked at temperature trends in the western Himalaya over the past century. They found warmer winters and cooler summers, combined with more snow and rainfall, could be causing some mountain glaciers to increase in size.” In other words, the water cycle rebounds between periods of extended heating/evaporation and melting of ice caps, and then mass precipitation and buildup of ice at the poles, like a great global thermostat that resets when certain upper and lower limits are reached. (After all, the polar regions are consistently too cold for anything but snow to fall, so increased precipitation would lead to a buildup of ice and snow, not the opposite. (Spencer, p. 62))
What the Cs are describing is essentially a negative feedback system. Rather than out-of-control warming, the earth’s climate system has in-built mechanisms to bring rising and falling temperatures back into equilibrium. Of course, this flies in the face of global warming propaganda, but anyone looking honestly at the data can see that this is exactly how our climate has operated.
Consider also the record low atmospheric temperatures, rising ocean temperatures (probably caused by underwater volcanism) leading to massive evaporation and precipitation as evidenced in the number of extreme floods and record-breaking snowfalls in recent years, and the fact that the last ice age ended about 11,500 years ago. In the 1970s, CLIMAP (Climate: Long-range Investigation Mapping and Prediction) discovered an ice age cycle of 11,500 years. In other words, we’re right on time for another. In fact, we’re overdue. And when the next ice age comes, it’s gonna come fast, just as the Cs proposed:
According to ice core researcher Jørgen Peder Steffensen: “Our new, extremely detailed data from the examination of the ice cores shows that in the transition from the ice age to our current warm, interglacial period, the climate shift is so sudden that it is as if a button was pressed.” This discovery suggests that our current climate could undergo a similar rapid change, shifting back into ice age mode in just one year.
But would the earth experience a ‘runaway cooling’ akin to that which those who picture an ever-heating earth because of ‘global warming’ imagine? Not likely. Global warming is founded on the basis of multiple successive positive feedback mechanisms (i.e. temperatures rise and rise without any negative feedback to bring them back down). If the earth climate system in fact contains built-in negative feedback mechanisms (as Spencer argues in his book), the same isn’t true. Instead of doubling upon doubling, “it’s like halving a number, then halving it again, and then again. You slowly approach zero, but never quite reach it. As a result, there can be no climate catastrophe with net strongly negative feedbacks – only with net strongly positive feedbacks.” (Spencer, p. 63) In other words, yes, we have ice ages, but climate (or the total heat content of the earth), as always, fluctuates between its naturally defined upper and lower limits. What we do not know are the exact mechanisms by which this happens.
As for the idea that underwater volcanism contributes to the water cycle of ice ages, the Cs said the following on 18 February 1995:
A: {…} Volcanic eruption under arctic ice in 1996.
Q: (T) Cool! (L) That ought to be a real zinger. (T) That will bring us some floods then!
A: No. Weather causing increased evaporation …

An undersea volcano erupts near the Pacific island of Tongatapu in 2009. Approximately 90% of the world's millions of volcanoes lie under the oceans. (© Dana Stephenson/Getty Images)
An undersea volcano erupts near the Pacific island of Tongatapu in 2009. Approximately 90% of the world’s millions of volcanoes lie under the oceans.
According to Dr. Spencer, quoted above, “it has recently been demonstrated that if the oceans warm for any reason, global land areas can warm even more. This makes the oceans a potential key player in long-term climate change.” (pp. 11-12) Increased volcanism is just one possible example of ‘forcing’, leading to a change in temperature. If we want to know what happens after that, we need to know what kind of feedback mechanisms are involved. If cloud cover is one such mechanism, as Spencer argues, the scenario could look something like this: Warmer oceans and land temperatures lead to increased evaporation, thus increased water vapor, cloud cover and precipitation. And more low-lying cloud cover means more negative feedback (cooling) because of the increased reflection of solar radiation. And, of course, increased precipitation over the poles could plunge earth into another ice age in its efforts to re-balance.
In 2006 it was reported that German-American researchers “discovered more hydrothermal activity at the Gakkel Ridge in the Arctic Ocean than anyone ever imagined.” Expecting a ‘hydrothermally dead ridge’, the researchers were surprised to discover high levels of volcanic activity in this Arctic region. Then, in 2008 geophysicist Robert Sohn discovered volcanic explosions “at depths previously thought impossible.” He even said, “This kind of implosive seismicity is rare anywhere on Earth.” At the times that all of this data was received from the Cs, many would have found it unlikely and even outlandish, but science is proving them correct on many points. We wonder what other discoveries lie just around the corner?
Global Warming Spin, Rinse and Cycle
But what exactly are the root causes of the climate changes earth has been experiencing? The Cs have also identified possible contributing factors. From 23 July 1994:
Q: (L) What is causing the earth changes?
A: Electromagnetic wave changes.
Q: (L) Can you be more specific?
A: Gap in surge heliographic field.
On 22 February 1997, they also had this to say:
Q: (L) Is the weather being controlled or changed or in any way affected by HAARP?
A: Climate is being influenced by three factors, and soon a fourth.
Q: (L) All right, I’ll take the bait; give me the three factors, and also the fourth!
A: 1) Wave approach. 2) Chloroflorocarbon increase in atmosphere, thus affecting ozone layer. 3) Change in the planet’s axis rotation orientation. 4) Artificial tampering by 3rd and 4th density STS forces in a number of different ways. …
Q: (L) All right, were those given in the order in which they are occurring, the fourth being the one that’s coming later?
A: Maybe, but remember this: a change in the speed of the rotation may not be reported while it is imperceptible except by instrumentation. Equator is slightly “wider” than the polar zones. But, this discrepancy is decreasing slowly currently. {…}
Q: (T) Is the Earth expanding? That’s just putting it bluntly, but, is the Earth expanding, how did you put that? (Ark) Yes, that’s the theory: the idea is that the continents move away because the Earth is expanding, and this is much faster than you know, than geologists were thinking.
A: Continental “drift” is caused by the continual, though variable, propelling of gases from the interior to the surface, mainly at points of magnetic significance.
Q: (J) What causes the change in the axis?
A: By slowdown of rotation. Earth alternately heats up and cools down in interior.
Q: (L) Why does it do that? What’s the cause of this?
A: Part of cycle related to energy exerted upon surface by the frequency resonance vibrational profile of humans and others.
Of the four causes listed above, numbers 2 and 3 (as well as the reference to the “surge heliographic field” in the previous session) most readily offer themselves up for some sort of scientific verification. The chlorofluorocarbon effect on the ozone layer has been recognized at least since the 1970s. But as far as I can tell, the influence of changes in the rotation of the earth on climate hasn’t received nearly as much scientific investigation. Recently, however, the subject made the news, suggesting one possible way in which it may have such an influence. In August 2010, Physics Central published an interesting piece about new research suggesting a link between the Sun’s output, cosmic rays, earth’s rotation and weather:
One of the team members, Vincent Courtillot of the Institute of Geophysics of Paris, says they examined the length of day – as defined by the speed of the earth’s rotation in a reference frame fixed with respect to the stars – using a series of daily values over a 40-year period. They claim that up to 30 percent of changes could be directly related to the 11-year sunspot cycle.
Of course, 30 percent of that change only amounts to a few tenths of a millisecond, so you’d never actually notice it, but what’s more compelling (read ‘very highly controversial’) is the potential for cosmic rays to have such a profound effect.
Courtillot and his colleagues have been among those championing a radical theory that cosmic rays can impact the formation of clouds and in turn, play a major part in climate changes. But how could cosmic rays possibly change the speed of our planet’s rotation?
Here’s how Courtillot explained it to me in an email:
“The causal chain is the following: the changes in Earth rotation are simply reflecting the changes in angular momentum of the Earth’s atmosphere, more precisely the integral of zonal winds. And it has been suggested that cosmic rays influence cloud condensation nuclei formation. If you change the cloud cover by say 10-percent, you change the amount of energy reflected by cloud tops by 8 Watts per square meter, which is very significant in the Earth’s radiative budget. So this is the suggested link: cosmic rays affect cloud cover, which affects the atmosphere’s energy budget, which may alter the wind speeds and organization, which changes the Earth’s angular momentum hence (length of day).”
It may sound like a reach (and relationships don’t prove causation), but other physicists have claimed that the sun’s magnetic field could potentially beat back cosmic rays and slow the rate at which they reach Earth. So when solar activity decreases there’s less to deflect the cosmic rays and they can again reach Earth in greater numbers, potentially leading to a substantial enough change in winds to effect Earth’s angular momentum.
 In other words, changing weather patterns may be (at least in part) a result of cosmic ray-seeded clouds, which cause a need to conserve angular momentum, thus leading to an almost imperceptible slowing of the earth’s rotation. And according to Dr. Spencer, cloud cover is perhaps the main driver in climate fluctuation within the earth system. But while suggestive of some possible causative mechanisms, the cosmic-ray theory of climate change is based more on speculation than observable evidence. What is most interesting is the idea of possible factors affecting earth’s angular momentum and the effects they might have on earth processes affecting climate, as well as the role of the Sun in all of these phenomena. In fact, the Sun appears to be the prime mover of global weather and climate.
Note the last sentence in the above quotation. The author is essentially describing a ‘gap’ in the Sun’s ‘surge’ of charged particles sent out through the solar system. (In the 1994 Cs session, ‘heliographic field’ could essentially mean the Sun’s measurable field of electromagnetism.) But the mechanisms for how this actually affects earth weather are best found elsewhere. According to Piers Corbyn, meteorologist, astrophysicist and head of WeatherAction.com, who has made a name for himself with his revolutionary and highly accurate techniques predicting weather patterns based on solar activity, cosmic rays actually play a miniscule role. Corbyn’s method involves observing how charged particles interact with earth’s upper atmosphere and the jet stream, and the moon’s influence on these particles, matching these observations with historical records to discern patterns. According to Corbyn:
The latest advances in Sun-Earth relations show not only the primacy of magnetic-particle links between the sun and the earth but that these are modulated by lunar effects to give the observed 60 year cycle in both world and USA temperatures. This means that the world will continue general cooling at least to 2030. Neither the 60 year cycle, nor the 22 year cycle nor any fluctuations in world temperatures over the last 100 years, thousand years or million years can be explained by changes in CO2. [If cosmic rays were the main driver, the cycle would follow the 11-year solar cycle, since cosmic rays follow the Sun’s cycle.] Furthermore, advances in understanding of Sun-Earth magnetic and particle activity are being applied to successfully predict dangerous weather and climate change events months and years ahead; whereas all predictions of the CO2-centred theory have failed and will continue to fail, and anti-CO2 taxes and measures will never stop a single extreme weather event. The UN’s Climate Change committee (the IPCC) have still failed to respond to requests from an international group of scientists to provide data evidence for the CO2 theory.
Dr. Roy Spencer has also identified a 60-year cycle called the ‘Pacific Decadal Oscillation’, a fluctuation between 30-year ‘positive’ and ‘negative’ phases based on “two different average circulation states that the ocean-atmosphere system seems to have a difficult time choosing between.” (If James McCanney is correct about the Sun-Earth connection and its influence on the jet streams and atmospheric phenomena, the PDO could conceivably be an effect driven by solar influences.) Spencer, too, is critical of the consensus view that CO2 drives global warming, seeing instead cycles within cycles based on changing cloud cover. Based on observations of these cycles, he writes, “And now, as of late 2008, it looks like we might have entered into a new, negative (cooling) phase of the PDO. Only time will tell whether this pattern persists.” See his graph of global temperatures, culled from NOAA satellite data, here. Notice the sinusoidal pattern of the graph, indicating that earth is currently swinging into a 30-year trend of cooling. Incidentally,
The last time the PDO changed phase was in 1977, an event that some have called the “great Climate Shift of 1977.” This event brought an end to the slight global cooling trend that started in the 1940s …, which was then replaced with a warming trend from the late 1970s through the 1990s.
After the Great Climate Shift, Alaska warmed immediately and then remained warm. Temperatures in the Arctic started rising … Arctic sea ice cover was observed to start shrinking in the 1980s by our new satellite measurements … Contrary to what you may have heard in news reports, the recent warming in the Arctic is probably not unprecedented. It was just as warm in the late 1930s and early 1940s when the PDO was also in its positive, warm phase. … Most of the all-time high temperature records in the United States were set in the 1930s. (Spencer, p. 19)
Of course, there is a whole lot more to these issues than the information presented above. You can find more articles dealing with these subjects in the archives on SOTT. After researching all these related subjects over the years, a picture is starting to emerge. The Earth Changes we are experiencing are a natural phenomenon, and human activity has little to nothing to do with them (at least not in the ways popularly imagined). Something strange, but not unprecedented, is happening throughout our solar system. It has to do with cosmic influences and their effects on and through our Sun and, as a result, our weather. Stay tuned for installments on our Sun’s possible companion star and other earth and solar processes. Our cosmic environment is changing, according to the Cs, in ways we can’t even begin to imagine.
Posted in The Cassiopaean "Hit" List